


When it comes to dairy farmers, there are certainly huge differences of opinion about what size of dairy operation is best. Those that operate smaller operations tout the higher than average production that they feel offsets the increased costs per animal for milk production. On the other hand, larger operations flaunt that lower cost of production results in the greatest profitability. Therefore, the Bullvine asks, “Which of these two claims is correct?” To answer this, the Bullvine looked at dairy operations in the USA to see what changes are occurring and just what size operations are the most profitable.
Dairy farming in the United States is undergoing dramatic changes, driven by both supply and demand factors. Consumption is shifting from fluid milk, produced for local markets, toward manufactured products, such as cheese, and dairy-based ingredients produced for national and global markets. Innovations in breeding, management and feeding systems have led to large increases in the amount of milk that a cow produces. The location of milk production is shifting toward Western States such as California, Idaho and New Mexico. Finally, production is shifting to much larger farms. The number of dairy farms with fewer than 200 cows is shrinking fast. Very large operations, with 1,000 to 30,000 cows on one site, account for a rapidly growing share of milk production. The trend towards large dairy farms that first emerged in the Western States is now appearing more frequently in traditional dairy states as well. (Read more: Where have all the dairy farmers gone? In Depth Analysis of the 2013 U.S. and Canadian National Dairy Herd Statistics)
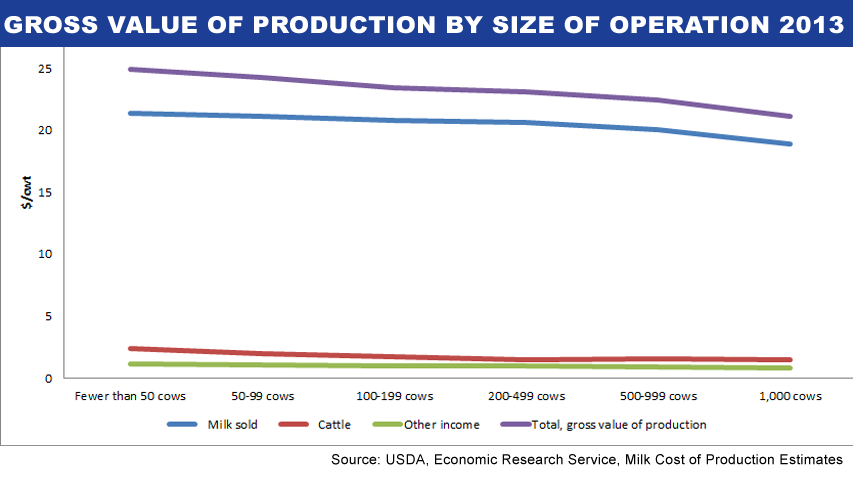
Revenue
Based on 2013 data from USDA, the revenue $/cwt of sold went from a high of $24.88 for producers with fewer than 50 cows to $21.14 for producers milking over 1,000 cows, with an overall average of $22.29. That is a 15% range. Producers who milked fewer than 50 cows had the greatest percentage of their income (9.4%) come from cattle sales while producers who milked 200-499 cows had the smallest percentage of their revenue come from cattle sales (6.5%), with the average dairy operations seeing 7.1% of their revenue come from cattle sales.
| Name | Milk | Fat | Prot | SCS | Conf | Rel | BPI |
|---|---|---|---|---|---|---|---|
| CRACKHOLM FEVER | 620 | 56 | 20 | 2.63 | 15 | 0.93 | 100.0% |
| GEN-I-BEQ BRAWLER | 910 | 62 | 46 | 2.85 | 10 | 0.94 | 99.8% |
| GEN-I-BEQ TOPSIDE | 1197 | 72 | 45 | 2.75 | 12 | 0.92 | 91.1% |
| GEN-I-BEQ ALTABUZZER | 1417 | 82 | 46 | 2.82 | 6 | 0.89 | 90.2% |
| DOMICOLE CHELIOS | 845 | 78 | 41 | 2.78 | 14 | 0.93 | 89.2% |
| COMESTAR LAUTREC | 1168 | 72 | 47 | 3.06 | 9 | 0.9 | 88.9% |
| BUTOISE BAHAMAS | 1725 | 52 | 73 | 3.18 | 6 | 0.9 | 88.7% |
| HYLLTOP PRESLEY RED | 866 | 78 | 56 | 3.02 | 6 | 0.89 | 88.4% |
| DELABERGE DEMOCRACY | 443 | 69 | 47 | 2.65 | 9 | 0.85 | 86.9% |
| GILLETTE WINDBROOK | 937 | 62 | 40 | 3.06 | 15 | 0.85 | 86.0% |
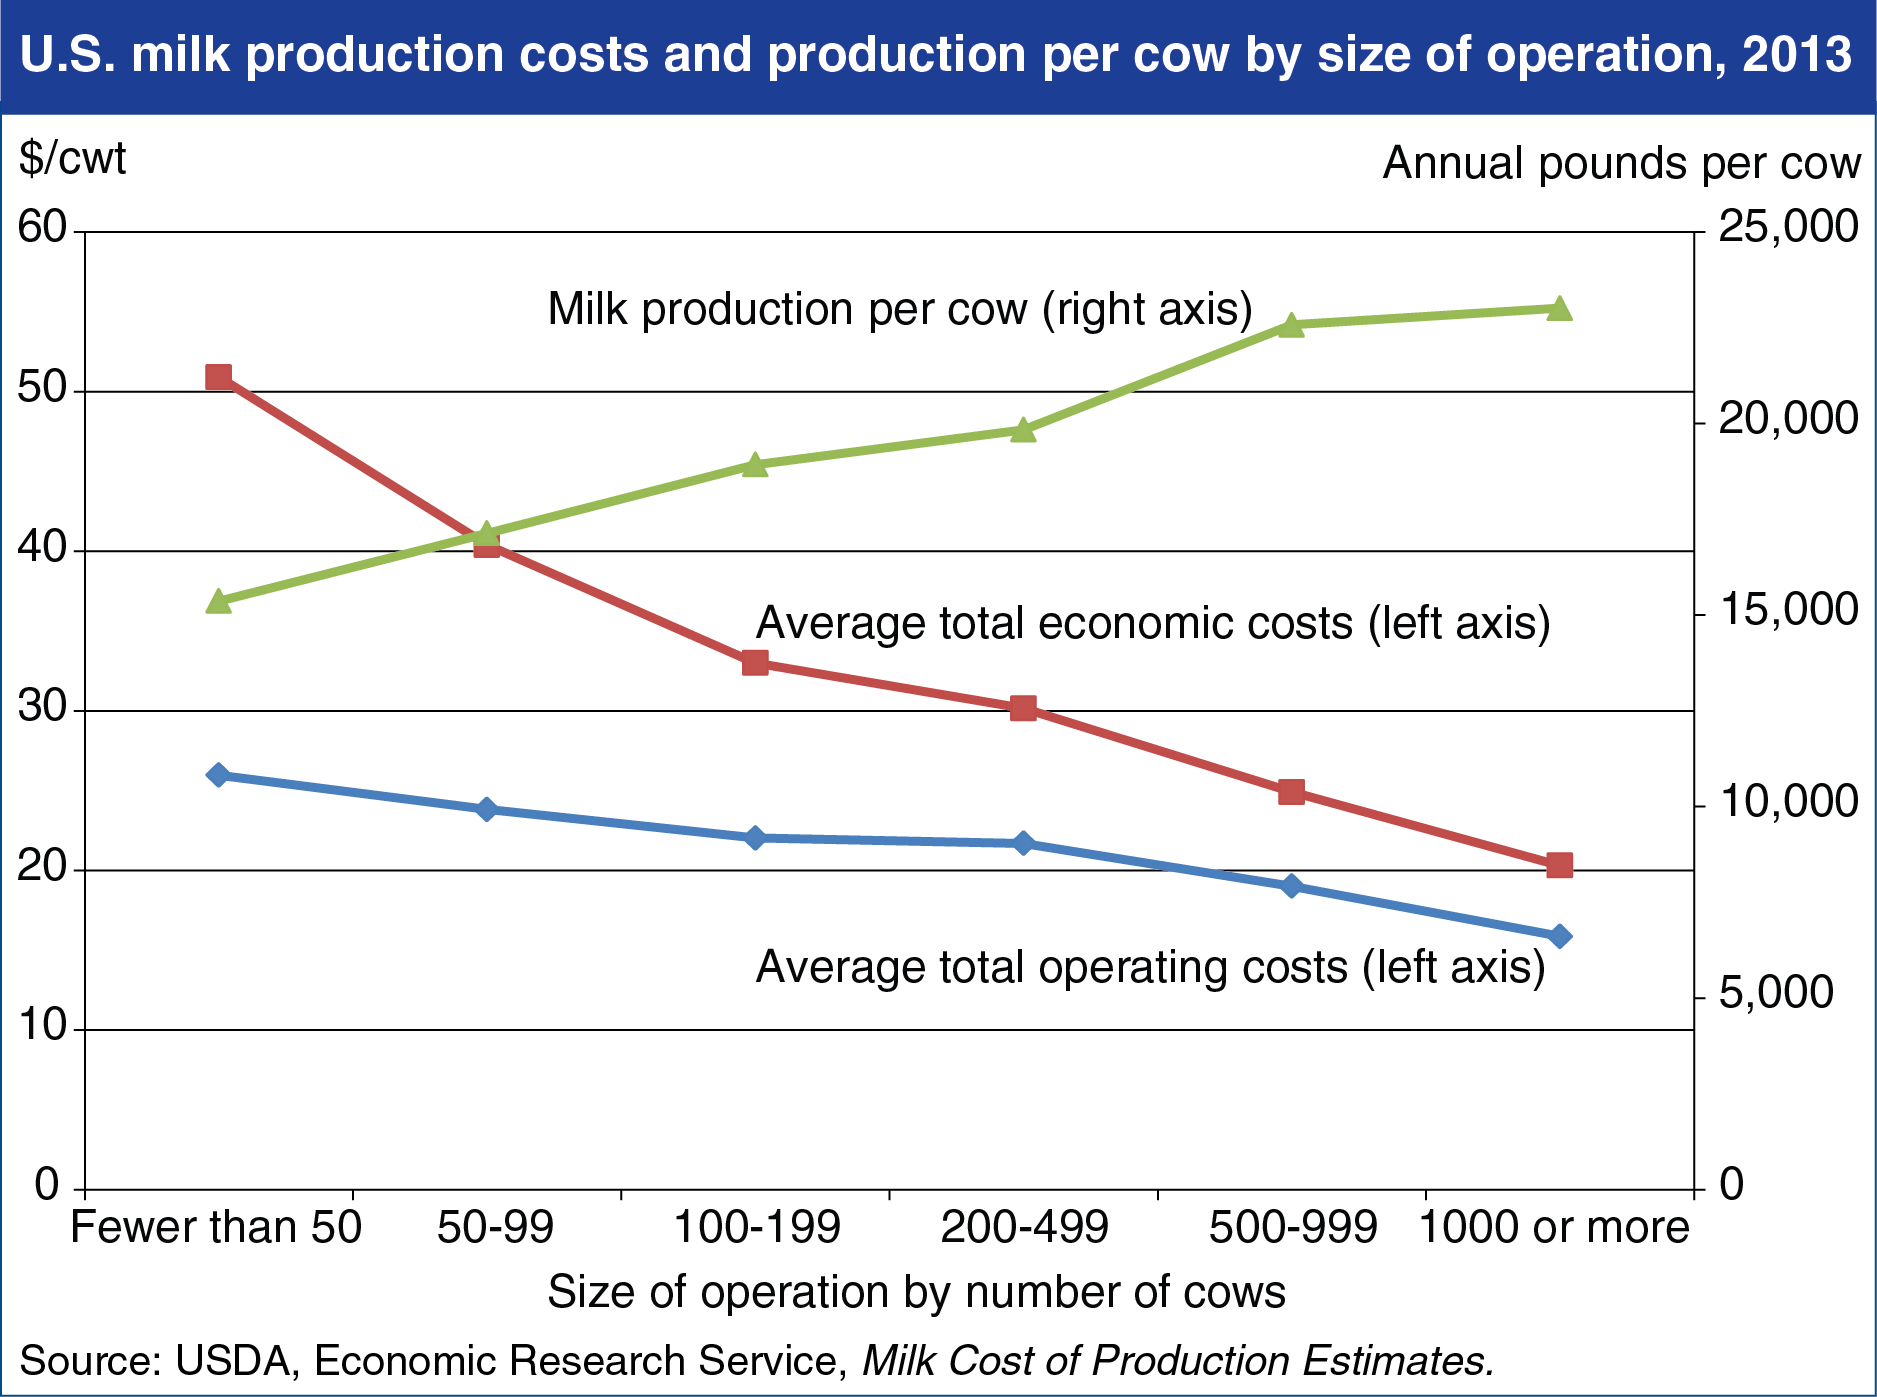
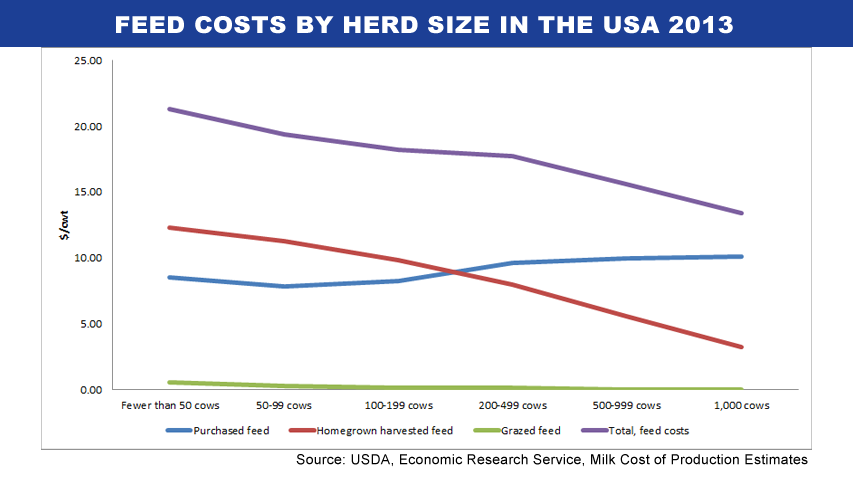
Operating Costs
When it comes to expenses on any dairy operation, there is no question that the cost of feed takes up the largest portion, with feed costs accounting for 58% of all the expenses. The highest percent is among those who milk over 1,000 cows where feed costs are 66% of operating expenses, and the lowest is among those who milk 50 cows or less where feed costs account for 41.9% of the expenses. At $21.31/cwt of milk sold the cost of feed for producers who milk 50 cows or less is 60% higher than those that milk 1,000 or more cows. Also of interest to note is that producers who milk under 200 cows typically produce their own feed, while those who milk over 1,000 cows only get about 24% of their feed from harvesting their own feed, and they purchase the rest. The average dairy operation in the US grows about 60% of their feed and purchase about 40%.
| Name | Milk | Fat | Prot | SCS | Conf | Rel | BPI |
|---|---|---|---|---|---|---|---|
| SUNTOR JOYRIDE | 2162 | 87 | 92 | 2.72 | 17 | 0.66 | 83.0% |
| GENERVATIONS LEXOR | 1635 | 90 | 84 | 2.89 | 12 | 0.72 | 82.1% |
| COMESTAR LAUTRUST | 1896 | 90 | 80 | 2.75 | 12 | 0.67 | 81.9% |
| LEOTHE DAUPHIN | 1805 | 88 | 72 | 2.74 | 11 | 0.66 | 81.5% |
| JEANNIESTAR D MILKMASTER | 1955 | 94 | 88 | 2.99 | 11 | 0.67 | 79.9% |
| GENERVATIONS LIQUID GOLD | 1546 | 102 | 82 | 2.87 | 14 | 0.65 | 79.9% |
| BOLDI V S G ANTON | 1910 | 90 | 72 | 2.8 | 17 | 0.64 | 79.4% |
| GENERVATIONS LIMBO | 1755 | 103 | 75 | 2.85 | 10 | 0.67 | 79.0% |
| GENERVATIONS BIG KAHUNA | 2167 | 80 | 76 | 2.82 | 14 | 0.65 | 78.8% |
| GENERVATIONS L1423 | 2374 | 76 | 87 | 2.91 | 15 | 0.65 | 78.7% |
* expressed in $/cwt
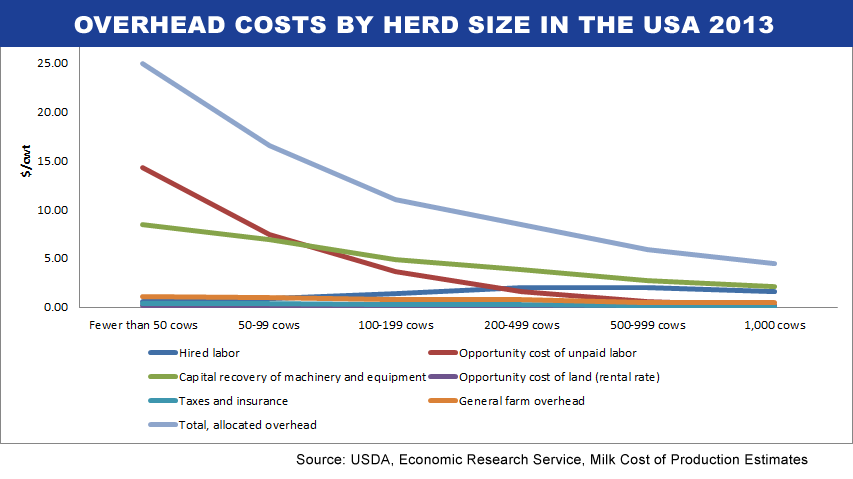
The greatest differential between large and small operations comes in relation to overhead. Those herds that are over 1,000 cows have an overhead expense per cwt sold of $4.44, which is 21.9% of their expenses. While herds that are under 100 cows have an expense of $16.58 or 41% of operating expenses. The average herd has an overhead expense of $8.20 or 29.9% of expenses. This difference $12.14/cwt sold is 373% higher for smaller operations and ultimately is the difference in the profitability between the two types of operations.
| Name | Milk | Fat | Prot | SCS | Conf | Rel | BPI |
|---|---|---|---|---|---|---|---|
| WEST PORT ARRON DOON MITEY P | -101 | 49 | 16 | 2.58 | 4 | 0.94 | 80.9% |
| MEMENTO BENEDICT P | 1023 | -11 | 10 | 2.75 | 9 | 0.92 | 78.4% |
| VENTURE TRANSFORMER P | 928 | 53 | 44 | 2.73 | 7 | 0.7 | 73.7% |
| LA PRESENTATION BEAR P | 567 | 21 | 19 | 2.94 | 4 | 0.9 | 72.6% |
| WEST PORT ARRON DOON MALTBY P | 1363 | 33 | 42 | 2.57 | 0 | 0.9 | 72.4% |
| OCONNORS BERKLEY | 1661 | 52 | 51 | 2.63 | 8 | 0.69 | 71.7% |
| ERBCREST SATCHEL P | 1137 | 21 | 40 | 2.72 | 11 | 0.7 | 70.5% |
| LA PRESENTATION BROYARD P | 1190 | 51 | 45 | 2.67 | 7 | 0.69 | 69.8% |
| VENTURE MAN O POLLED P | 769 | 37 | 58 | 3.06 | 10 | 0.69 | 69.6% |
| HICKORYMEA-I OKA P | -87 | 46 | 16 | 2.65 | 9 | 0.9 | 69.1% |
* expressed in $/cwt
Profitability
While most producers could tell you that milking less than 50 cows will not pay the bills, it is interesting to see that, unless you are milking over 500 cows, the return on your investment in dairy farming is less than t what you would make having your money sit in bank account (1.39% versus 3%). In fact, when you factor in overhead expenses, dairy farming in the USA does not become profitable unless you are milking over 1,000 cows. In 2013, the average dairy farmer had a net loss of 5.03% and even those milking over 1,000 cows only made a slight profit of 0.83%.
| Name | Milk | Fat | Prot | SCS | Conf | Rel | BPI |
|---|---|---|---|---|---|---|---|
| STANTONS FREDDIE CAMEO | 1784 | 108 | 71 | 2.81 | 7 | 0.71 | 95.4% |
| STANTONS MANOMAN EZRA | 1607 | 103 | 81 | 2.9 | 12 | 0.73 | 94.5% |
| MAPEL WOOD M O M LUCY | 2174 | 106 | 90 | 2.95 | 12 | 0.72 | 94.5% |
| VELTHUIS SG MOM ALESIA | 1897 | 91 | 71 | 2.84 | 16 | 0.72 | 93.8% |
| DELABERGE OMAN DOILEE | 1604 | 70 | 88 | 2.92 | 10 | 0.73 | 93.4% |
| STANTONS OBSERVER EXTREME | 2731 | 91 | 91 | 2.67 | 14 | 0.68 | 92.2% |
| BENNER MANOMAN JANESSE | 1467 | 113 | 78 | 3 | 11 | 0.72 | 91.8% |
| OCONNORS PLANET LUCIA | 2452 | 101 | 99 | 2.92 | 15 | 0.72 | 91.4% |
| STANTONS OBSERVER EXPOSE | 2200 | 79 | 84 | 2.83 | 11 | 0.7 | 91.2% |
| COMESTAR LAUTAMAI MAN O MAN | 2156 | 85 | 93 | 2.88 | 12 | 0.71 | 90.5% |
* expressed in $/cwt
This trend has been consistent since 2010. Namely, producers who milk over 1,000 cows are the only ones who have turned a profit on average over the past 4 years. However, 2013 has certainly been the toughest with the average operating profitability over the past 4 years being 4.96% in 2010, 5.86% in 2011, 3.81 in 2012, and 3.17 in 2013.
The Bullvine Bottom Line
U.S. dairy production is consolidating into fewer but larger farms. This report uses data from several USDA surveys to detail the consolidation and to analyze the financial drivers of consolidation. Specifically, larger farms realize lower production costs. Although small dairy farms achieve higher revenue per hundredweight of milk sold, the cost advantages available because of larger size allows large farms to be, on average, the most profitable segment. In fact, most small farms were unable to earn enough to replace their capital.
I am sure there are individual case examples from each size of operation demographic that could demonstrate herds that vary significantly from the National average. Nevertheless, there has been a strong, consistent pattern over recent years, which shows that herds that milk over 1,000 cows are significantly more profitable than their smaller counterparts are.
Based on data found in Milk Cost of Production Estimates.

Get original “Bullvine” content sent straight to your email inbox for free.


