


Explore the reasons behind the 0.8% decline in June milk production according to the USDA’s latest report. Uncover the evolving trends in the dairy industry and identify which states excel in milk yield per cow. Find out more.
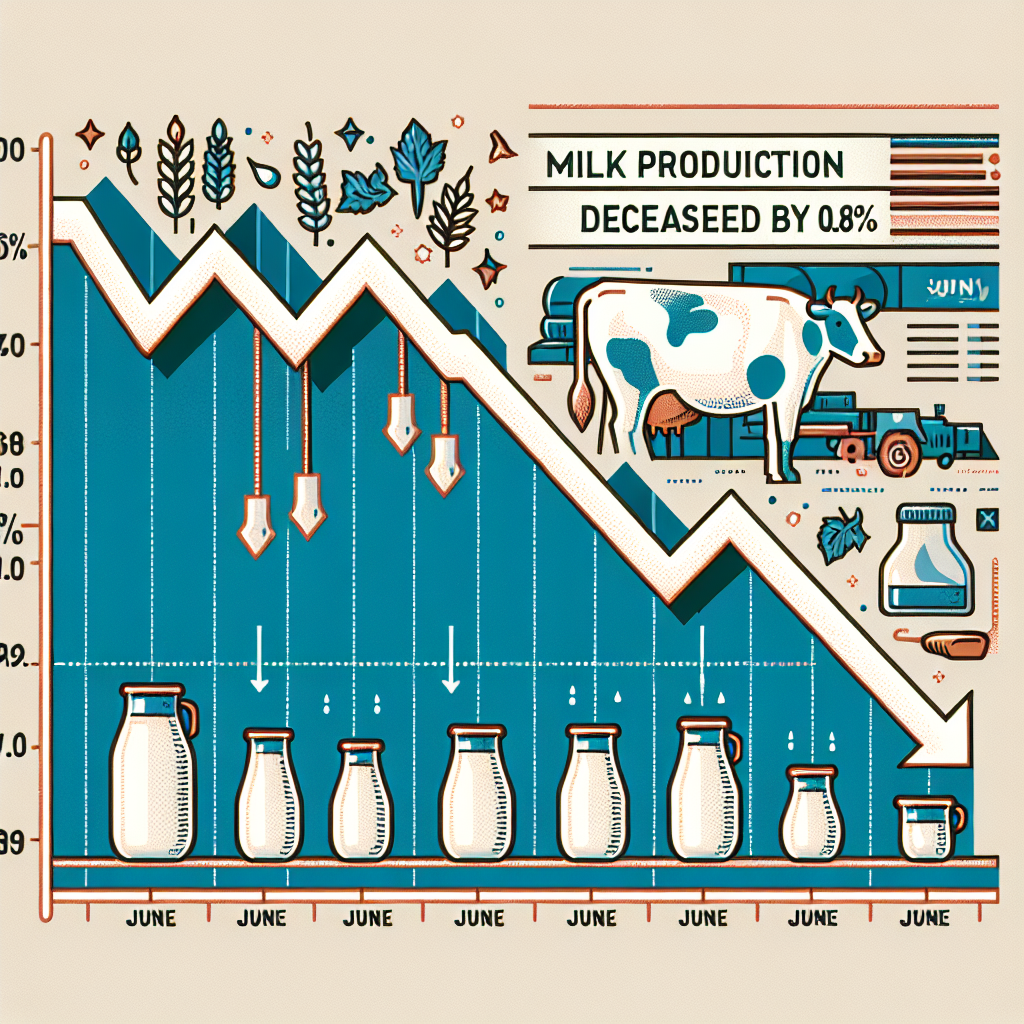
Attention to our esteemed dairy farmers and industry stakeholders: Your role is pivotal in understanding and addressing the impact of diminishing milk production. The most recent USDA data shows a significant drop in milk production for June, indicating possible difficulties and possibilities for the dairy industry. We want to deconstruct these facts, explain their consequences, and thoroughly examine what this trend implies for you—according to the USDA, milk output in June declined by eight-tenths of a percent from the same month in 2023. Your understanding and proactive response to these trends are crucial for the industry’s future.
Join us as we delve into the following critical points:
- June Production Figures: Examining the 18 billion pounds of milk produced by the 24 central dairy states, which include major dairy-producing states such as California, Wisconsin, and Idaho. These states collectively account for a significant portion of the country’s milk production, making their production figures crucial for understanding the industry’s trends and dynamics. Revised Figures: The USDA’s updated May report shows 18.8 billion pounds of milk, also down eight-tenths of a percent from the previous year.
- Quarterly Trends: Analysis of the total 2nd quarter production, which also saw a decrease.
- Production per Cow: A look at the average milk yield per cow and changes from the previous year.
- Herd Numbers: A snapshot of cow population trends across critical states.
This trend is important to dairy producers since it affects milk pricing, feed costs, and farm profitability. Understanding the entire scale of these manufacturing shifts will enable you to adjust your strategy better, prepare for the future, and minimize any hazards.
| Month | Total Production (Billion Pounds) | Year-over-Year Change (%) | Number of Cows (Million Head) | Production per Cow (Pounds) |
|---|---|---|---|---|
| April | 19.1 | -0.8 | 8.88 | 2,153 |
| May | 18.8 | -0.8 | 8.88 | 2,117 |
| June | 18.0 | -0.8 | 8.88 | 2,025 |
June’s Milk Production Data Reveals Significant Fluctuations in the Dairy Industry
The June milk production statistics indicate considerable swings in the dairy business, with the 24 central dairy-producing states generating 18 billion pounds of milk. This statistic represents a production amount and an eight-tenths of a percent decrease from the previous year, a significant change that underscores the need for adaptive techniques in dairy production to manage these negative trends.
USDA’s May Report Revision: A Critical Reassessment in the Dairy Sector
The USDA’s amendment of the May report makes a significant change, highlighting crucial changes in the dairy business. Initially published data have been amended to reflect a production volume of 18.8 billion pounds for May, a considerable fall of eight-tenths of a percent from the previous year. This modification more accurately depicts current market trends and shows the complex variables influencing milk production quantities throughout the country.
Second Quarter Analysis: A Reflection of Shifting Paradigms in Dairy Production
The statistics from the second quarter reveal that the dairy business has undergone a significant transition. Total milk output in April, May, and June was 57.5 billion pounds, down 0.8% from the previous year. This declining tendency is more than just a statistical footnote; it is an essential signal of overall dairy industry developments. Dairy producers face persistent problems, including variable herd numbers and changing market needs, as seen by their steady fall over three crucial months.
Subtle Shifts in Cow Productivity: Unveiling the Underlying Dynamics
The average milk output per cow in the 24 core dairy-producing states reveals a complex dynamic in the industry. This year’s yield per cow is 2,025 pounds, a noteworthy eight-pound reduction from the prior year. Despite its seeming tiny size, this drop might suggest underlying concerns that need additional research. Feed quality, cow health, and environmental circumstances may significantly influence this decline. Understanding these factors is critical since even modest productivity changes may dramatically impact the dairy industry’s total production and economic stability. This minor but essential shift emphasizes the need for continuous examination and modification in dairy farming operations to maintain long-term production and industry development. Your role in this continuous improvement is crucial.
January to June: Observing Subtle Shifts in Dairy Cow Populations Reflecting Stability Amidst Minor Fluctuations
From January to June, we saw small changes in the number of cows, indicating a degree of stability despite slight swings. January had an initial total of 8.87 million heads, which increased slightly to 8.88 million by February. This little increase was followed by a modest fall in March and May before reverting to the February record of 8.88 million in June. Such little changes indicate an underlying consistency in the cow population, with the 8.88 million head in June as a focal point for the period’s relative stability.
Regional Powerhouses: Examining California, Wisconsin, and Idaho’s Dominance in Dairy Cow Populations
When we get the details, California stands out for its vast dairy cow herd, which is 1.7 million. This towering monument symbolizes California’s dominance in the dairy sector, establishing a high production efficiency and volume standard. Wisconsin is a close rival, with 1.2 million head, confirming its position as a critical player in dairy production. Meanwhile, Idaho’s 668,000 headcount demonstrates the state’s significant contribution and the judicious dispersion of dairy businesses around the country. These statistics depict the concentrated centers of dairy activity, each contributing distinctively to the overall topography of the United States dairy industry.
Milk Yield Efficiency: A Comparative Hierarchy Among Leading States
Examining cow numbers shows a distinct hierarchy, with California leading the way with an astonishing 1.7 million cattle. This dominating number unabashedly places the state at the pinnacle of the dairy production landscape, highlighting its significant contribution to the industry. Following in its footsteps is Wisconsin, which has 1.2 million cattle. This large amount confirms the state’s position as a critical participant in the dairy business. Despite following behind, Idaho retains a considerable presence with 668 thousand head of cattle, preserving its position among the top dairy-producing states. These numbers, which represent strategic breeding and resource allocation, give a glimpse of the overall dynamics within the key dairy-producing areas of the United States.
The Bottom Line
June’s results show a minor but noticeable decrease in milk output, indicating a continuing trend in the dairy business. Cow production is declining, while cow numbers have changed little. The updated May report and second-quarter analysis confirm this little reduction. In June, 18 billion pounds of milk were produced, an average of 2,025 pounds per cow. The dairy cow population remained stable but fluctuated between January and June. California, Wisconsin, and Idaho have the most cows, but Michigan has the highest per-cow productivity. These findings underscore the importance of your adaptability and proactive steps in maintaining the industry’s viability. Your actions will be critical in shaping the industry’s future.
Key Takeaways:
- June milk production decreased by eight-tenths of a percent compared to the previous year.
- The 24 major dairy-producing states produced 18 billion pounds of milk in June.
- May’s milk production numbers were revised to 18.8 billion pounds, reflecting an eight-tenths percent decrease year-over-year.
- The total milk production for Q2 (April, May, June) also dropped by eight-tenths of a percent, totaling 57.5 billion pounds.
- The average milk production per cow in the major states was 2,025 pounds, which is eight pounds less than the previous year.
- Dairy cow populations have shown slight fluctuations, maintaining an overall stability from January to June.
- California, Wisconsin, and Idaho lead in the number of dairy cows, with California housing the most at 1.7 million head.
- Michigan reported the highest milk yield per cow, averaging 2,290 pounds per cow.
Summary:
The USDA’s latest data shows a significant drop in milk production in June, affecting milk pricing, feed costs, and farm profitability. The dairy industry faces persistent problems, including variable herd numbers and changing market needs. The second quarter analysis revealed a significant transition in the dairy industry, with total milk output being 57.5 billion pounds, down 0.8% from the previous year. Cow productivity has also changed, with this year’s yield per cow being 2,025 pounds, an eight-pound reduction from the prior year. From January to June, small changes in the number of cows reflected a degree of stability, with California having a vast dairy cow herd with 1.7 million head, Wisconsin having 1.2 million head, and Idaho having 668,000 head. In conclusion, the dairy industry’s future is influenced by cow production and cow numbers, with actions being critical in shaping its future.


