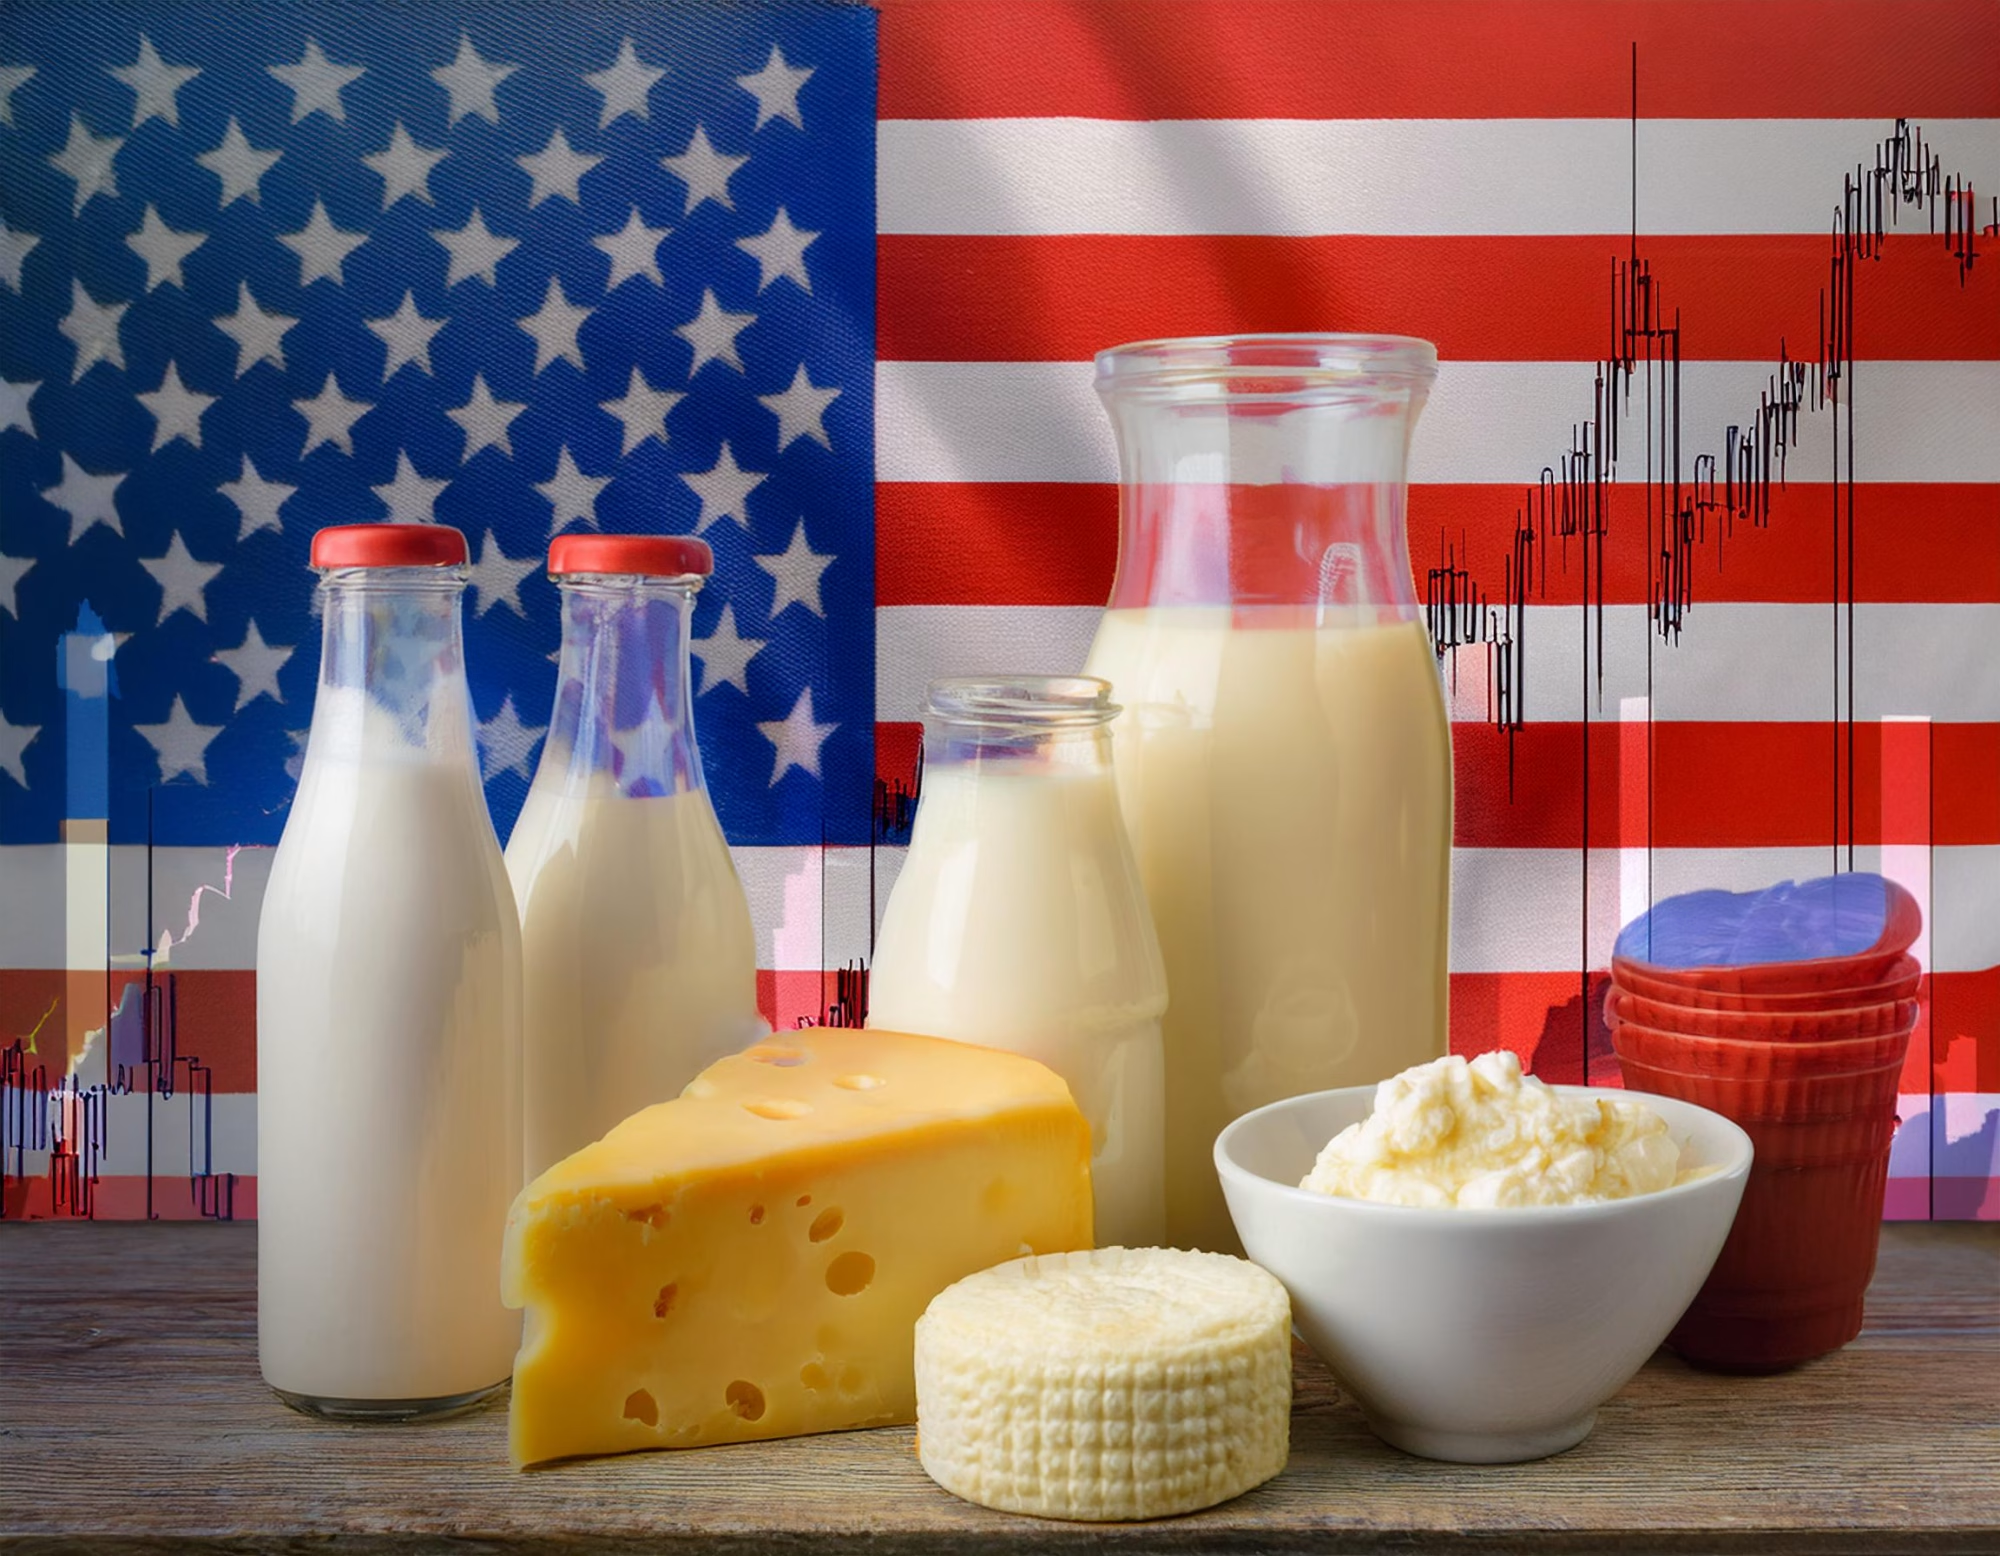
How can dairy farmers stay competitive with tighter milk supplies and new challenges? Are you ready for the evolving dairy market?
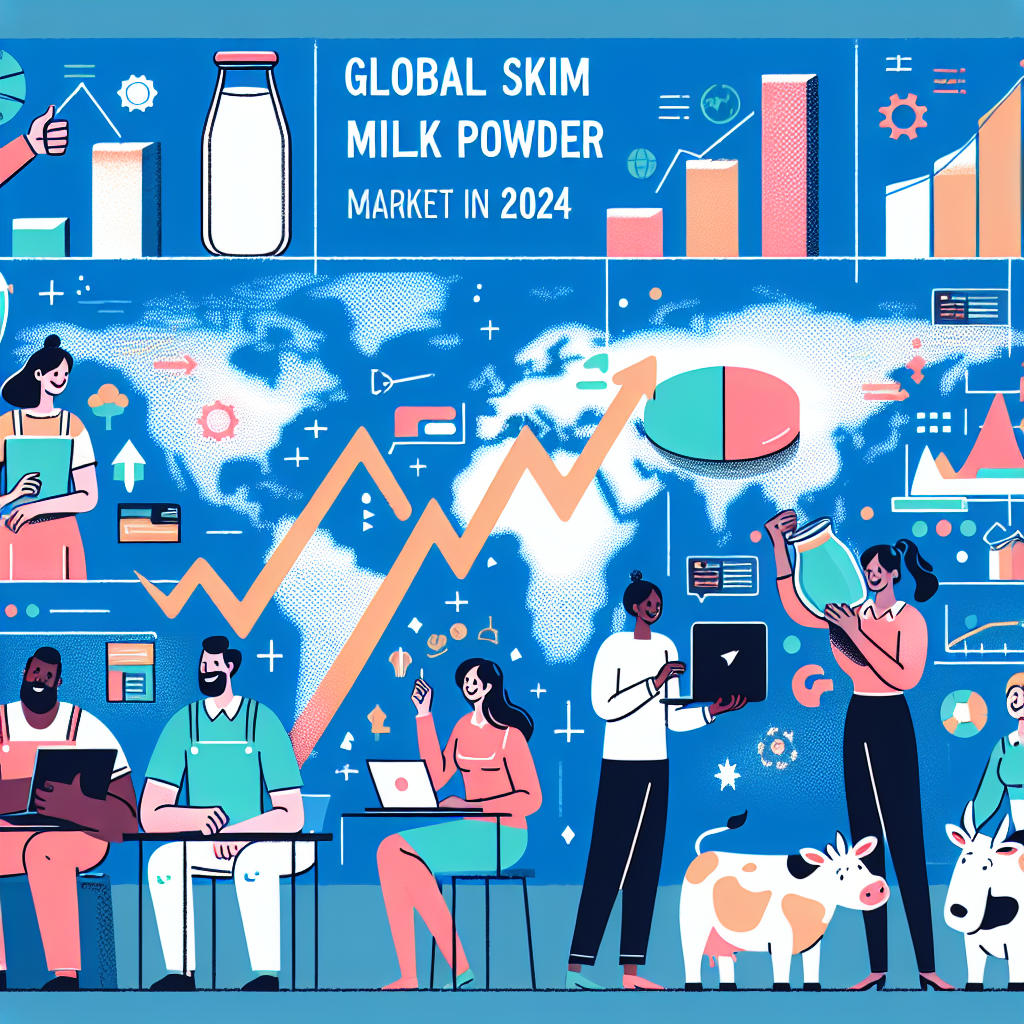
Summary: The dairy industry faces tighter milk supplies and lower milk solids output, leading to heightened competition among processors. Recent data shows a significant drop in nonfat dry milk and skim milk powder production, contrasting with a surge in exports, especially to Mexico and the Philippines. Global stockpiles are also feeling the pinch, with European inventory levels shrinking and prices rising across the board. As a dairy farmer, staying informed and adaptable in these dynamic market conditions is crucial. Understanding these trends, you can better navigate the challenges and opportunities ahead. “Milk powder output is 14.6% behind the 2023 pace, marking the slowest start since 2013.”
- Data shows a significant drop in nonfat dry and skim milk powder production.
- Exports are surging, especially to key markets like Mexico and the Philippines.
- Global stockpiles of skim milk powder are shrinking, driving up prices.
- Dairy farmers must stay informed and adaptable to dynamic market conditions.
- Understanding these industry trends can help tackle future challenges and seize opportunities.
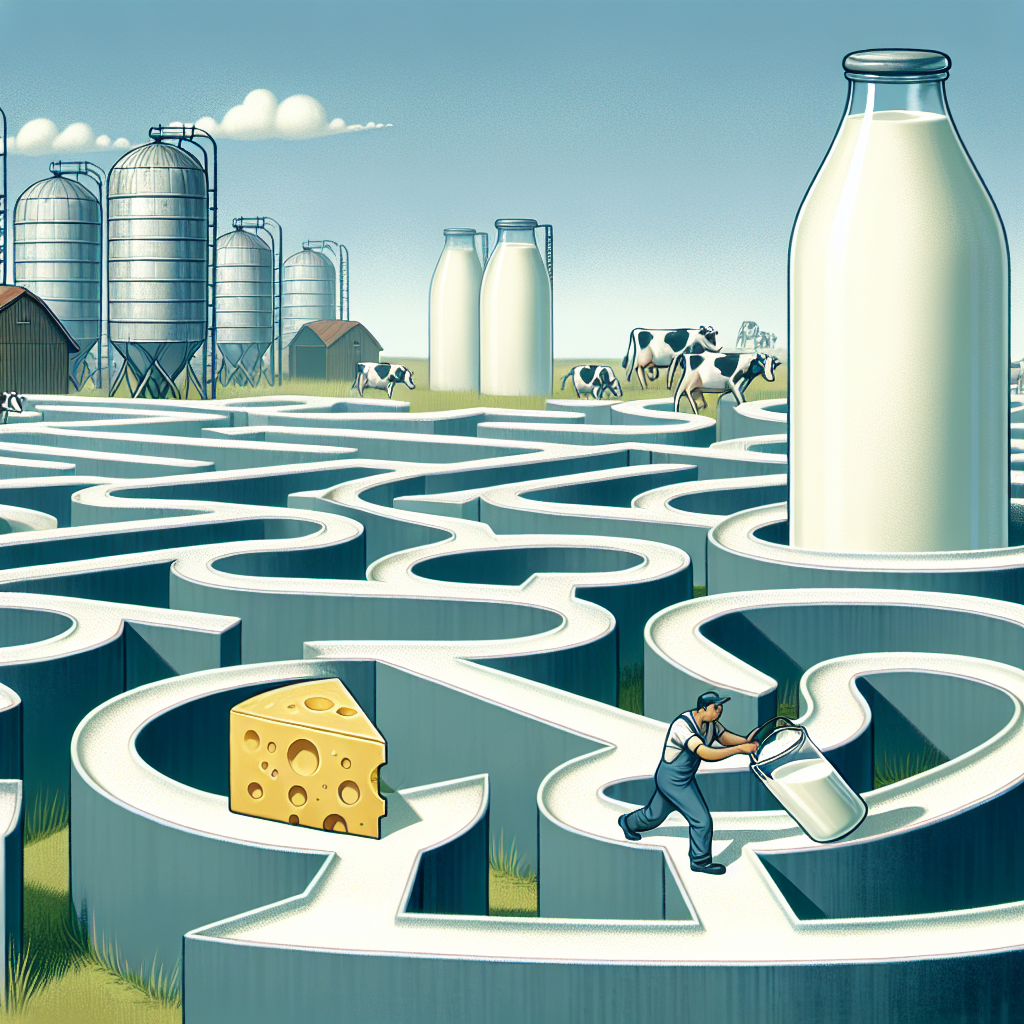
Do you feel the pinch in the dairy industry? You are not alone. A tighter milk supply and decreased milk solids production present challenges, but you, as dairy farmers and processors, have shown resilience in the face of adversity. In July, the combined output of nonfat dry milk (NDM) and skim milk powder (SMP) fell to 184 million pounds, a 10.6% decrease from the previous year. With such significant declines in productivity, it’s evident that we’re all up against unprecedented obstacles. How are you going to navigate these rough waters?
Facing the Reality: The Dairy Market’s Tightening Grip
Let’s take a look at the present dairy market. It’s no news that milk supplies are tightening, and milk solids yield is declining. This year, the combined output of nonfat dry milk (NDM) and skim milk powder (SMP) fell by 10.6% in July, reaching just 184 million pounds compared to the previous year. In the first half of 2024, milk powder output fell 14.6%, the weakest start since 2013.
This drop in output has created a very competitive environment for dairy processors. And this is not simply a local problem but a global concern. For example, the USDA’s Dairy Market News reports that Europe’s SMP supplies are “thin,” spurred by fears of decreased supply owing to bluetongue illness.
Meanwhile, competition heated up as NDM exports rose 10.3% in July compared to the previous year. Key countries like Mexico witnessed a 20% rise in shipments, while exports to the Philippines, our second-largest market, increased by an astonishing 79%. Despite these prominent export figures, manufacturers’ NDM supplies are tight, with 269.7 million pounds recorded as of July—down marginally from June but up 0.4% from last July.
Prices are also rising owing to constrained supply and strong demand. For example, during a recent Global Dairy Trade (GDT) auction, SMP prices rose by 4.5%, hitting their highest since June.
The Global Squeeze: Europe’s Tight Dairy Market
Let us take a step back and look at the bigger picture. Europe, a traditional dairy industry powerhouse, is under pressure. According to the USDA’s Dairy Market News, SMP stockpiles are ‘thin,’ causing purchasers to scramble to obtain items. This shortage is exacerbated by bluetongue illness, which threatens to severely reduce SMP output. This ‘Global Squeeze’ is not simply a European issue but a global concern that could impact the U.S. dairy industry by increasing competition and potentially raising prices.
As stocks deplete, prices rise. At the most recent Global Dairy Trade (GDT) auction, SMP prices increased by 4.5%, reaching their highest point since June. Interestingly, although whole milk powder (WMP) witnessed a tiny decrease, there is a silver lining. China stepped up, purchasing substantial amounts for the third consecutive auction. This is an optimistic indicator that China’s massive WMP stockpile would eventually decline after years of low imports.
How Do These Trends Impact You, the U.S. Dairy Farmer?
Lower milk solids yield, and tighter milk supply have a direct impact on your financial line. With CME spot prices for nonfat dry milk (NDM) at $1.365 per pound, the highest since late 2022, you may find some respite if you can demand these higher prices. However, with avian influenza in central California, there is a genuine potential for future disruptions.
- Avian Influenza: This is not simply a bird issue. When it affects a significant dairy-producing region, such as central California, it raises concerns about further limits on milk supply. Any decrease in production will increase prices, impacting your sales and profit margins. The avian influenza outbreak in central California can potentially disrupt the dairy industry by limiting milk supply, leading to increased prices and impacting sales and profit margins.
- Cheddar blocks reached a multi-year high of $2.27 per pound, while butter prices of $3.175 per pound highlight the market’s robust demand. While increased pricing may seem appealing, they may also result in more extraordinary input expenses for feed and supplies, reducing your profits.
- Whey Powder and Protein Isolates: With whey powder production at its lowest level since 1984, while whey protein isolates outperformed last year’s volumes by 30-34%, you’re probably experiencing a change in demand for higher-value goods. If you’re in the whey manufacturing business, this may be a profitable niche to enter. Despite the challenges, there are opportunities for profit in the current market conditions.
- Market Volatility: Despite high spot dairy product prices on the CME, milk futures have not followed pace. September Class III milk futures increased marginally to $22.77 per cwt., but most other futures fell 20 to 30 cents. This unpredictability might make it difficult to plan long-term investments or growth. We understand the challenges you face in navigating this market volatility.
- Feed Costs: While silage yields seem fair, worldwide concerns, such as dry weather in Brazil, may influence future grain prices. Any rise in feed prices directly impacts operating expenditures, stressing the need for effective feed management measures.
These shifts provide both possibilities and problems. Higher spot prices may increase income, but the danger of disease outbreaks and fluctuating feed costs needs careful planning. Stay adaptive, and you can economically traverse these challenging times.
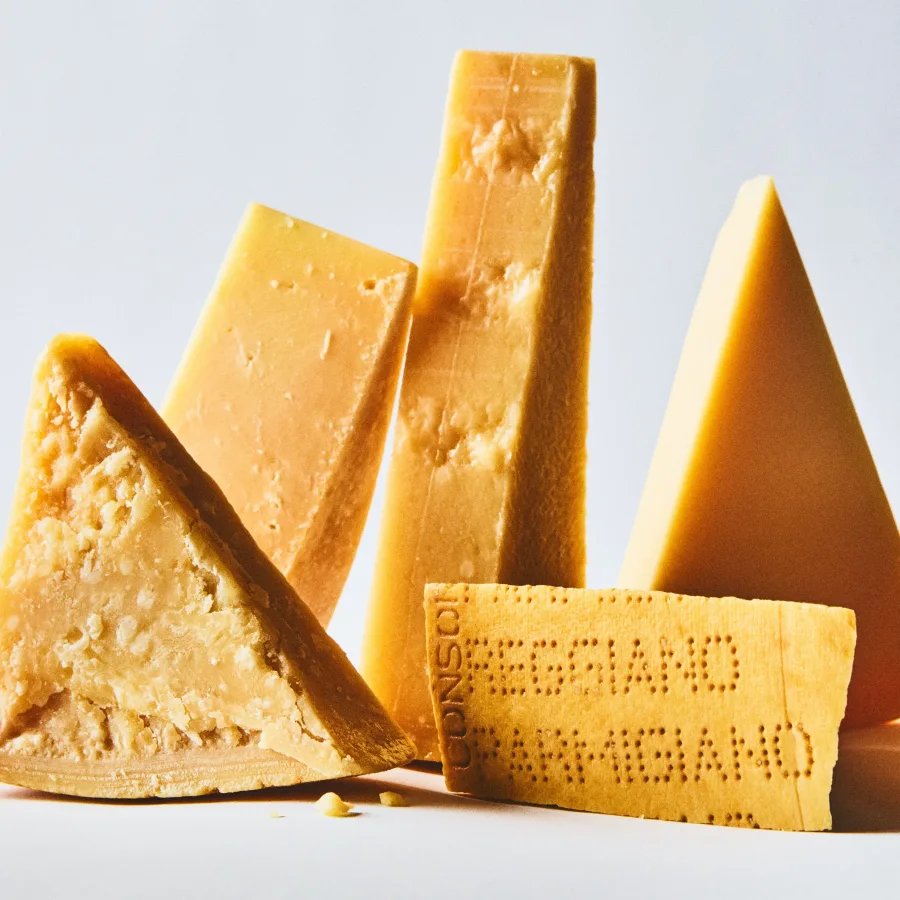
Cheese & Butter: The Heavyweights of the Dairy Market
Cheese and butter are at the forefront of the dairy industry, with high demand and pricing.CME spot Cheddar blocks hit a multi-year high, rising to $2.27 per pound. Despite plentiful cheese production exceeding last year’s volumes by 1.9%, cheddar output declined 5.8%, the lowest since 2019. So far this year, U.S. cheddar production is behind by 7.2%, reducing supply and increasing prices. Nonetheless, U.S. cheese exports remained strong, reaching roughly 89 million pounds in July, the most significant number ever.
The butter market continues to be robust, with output rising to 162 million pounds in July, a 2.2% rise over July 2023, and a new monthly record. However, strong demand kept prices rising, with CME spot butter reaching $3.175. Despite the higher churn, high prices indicate a large draw from the market, confirming the strong demand for butter products.
Whey: From Powder to Protein Powerhouse
Whey powder production has dropped significantly, reaching its lowest level since 1984, as producers focus more on high-protein whey concentrates and isolates. Whey protein isolate output increased by 34% in June and 30% in July. This shift in production objectives considerably impacts the supply and demand dynamics of the whey market.
As more whey is diverted into high-protein products, the availability of classic whey powder has decreased. This dip in whey powder manufacturing maintains stockpiles low, as indicated by a 27.7% fall over the previous year, reaching levels not seen since 2012. Prices have increased, with CME spot whey reaching 58.75¢ per pound.
What’s causing this shift? Consumer demand. Americans are becoming more health-conscious, increasing their intake of high-protein food. This isn’t a fad but rather a significant commercial change, resulting in a feedback cycle in which increased demand for protein isolates limits the supply of ordinary whey powder, pushing up costs.
As a consequence, the market rewards those that are fast to adjust. If you are a dairy farmer, this might imply more significant whey product margins and more difficult choices about where to focus your production efforts. Navigating these changes successfully may help you remain afloat and grow in this fast-changing environment.
Mixed Fortunes in Dairy and Feed Markets: Opportunities Amidst Uncertainty
Milk futures seem unable to keep up with dairy markets’ rapid growth. Despite new cheese price highs, which pushed September Class III to a high of $22.77 a cwt., the rest of the Class III and Class IV futures did not follow. This week, most contracts dropped between 20˼ and 30ɼ. The gap emphasizes an important point: although cheese prices impact Class III futures, maintaining upward momentum is difficult without strong demand.
We notice a mix of good and warning indicators in the feed markets. Silage choppers are in operation, and yields are encouraging. Expect robust grain and soybean crops, which will restrict margins as prices attract new demand. Ethanol output rose 3.3% yearly in July and August, suggesting more significant activity in connected markets.
Furthermore, beef output is robust, with cattle grown to record weights, and the United States remains the most economical market for maize and soybeans. Despite a period of low sales, the market is waking up. However, fears remain over Brazil’s dry period. Persistent dryness may delay planting and limit production potential, impacting market behavior. This week, December corn increased by 5 cents to $4.0625 per bushel, while November soybeans rose a few cents to $10.02. Soybean meal remained solid at $324 per ton, up $11.
Although the dairy market is mixed for milk futures, the feed markets provide both possibilities and hazards. As you navigate these stormy seas, watch demand changes and external variables, such as weather conditions, which impact worldwide supply.
Stay Agile: Mastering Global Market Dynamics
Understanding global market dynamics is critical to keeping ahead. International trade rules, tariffs, and worldwide events considerably impact the local dairy industry. Tariffs, for example, may raise the cost of dairy exports, lowering profit margins and restricting market access. Disease outbreaks and political instability may disrupt supply networks and drive up costs.
To reduce these effects, consider remaining up to speed on current trade regulations and foreign market developments. Diversifying your market base might also be beneficial. If one market is experiencing a decline, another may have steady or growing demand. Building strong connections with local and foreign customers may offer a buffer against market changes. Furthermore, boosting productivity and lowering farm expenses make your goods more competitive, even when global circumstances are challenging.
Adapting to These Market Shifts Requires Forward-Thinking Strategies
Adapting to these market shifts requires forward-thinking strategies. Here are some practical tips for staying ahead:
- Diversify Your Product Line
If you haven’t already, this is an excellent moment to explore diversifying your product offering. Introducing new goods such as flavored milk, yogurts, and gourmet cheeses may help you enter niche markets. According to the USDA, value-added items often command higher pricing, making your business more robust to market swings [USDA]. - Improve Operational Efficiency
In tight marketplaces, you must streamline your processes. Consider investing in devices that will increase milk output and feed efficiency. Automated milking methods, for example, save labor expenses while increasing production. Programs such as Dairy Margin Coverage (DMC) may offer financial safety nets [FSA]. - Explore New Markets
Global marketplaces are developing, and there are chances to broaden your reach. Exports to nations like Mexico and the Philippines have increased, indicating good opportunities for American dairy producers. Keep an eye on foreign trade rules and consider creating collaborations with export organizations to help you traverse these markets more efficiently. - Adapt to Consumer Trends
Consumers are increasingly seeking responsibly produced and organic items. You can enter this booming market by implementing sustainable practices and obtaining organic certifications. Not only does this command a higher price, but it also boosts your brand’s reputation. - Leverage Data and Analytics
Use data analytics to make sound judgments. Tools that gather and analyze data on feed efficiency, milk output, and herd health may provide valuable insights for optimizing your operations. Implementing predictive analytics may help you anticipate milk production patterns and make proactive modifications.
Embracing these methods will help your dairy farm prosper in the face of market pressures. Remember that long-term sustainability requires flexibility and proactive behavior.
The Bottom Line
The dairy market is undergoing considerable changes. Lower milk solid production and tighter supply have increased competition and pricing. While the worldwide market is under pressure due to low inventory levels and external factors such as illnesses, U.S. exports remain reasonably robust. The cheese, butter, and whey markets exhibit various patterns, which affect supply and demand in multiple ways. Meanwhile, shifting feed and grain prices provide both obstacles and possibilities for dairy producers.
As you manage these complicated dynamics, examine how you may adapt your strategy to survive and succeed in this changing market. Stay alert, knowledgeable, and proactive to capitalize on new possibilities and prevent threats.
Learn more:
- Why 80% of U.S. Dairy Farms Are Struggling: An Insider’s Look at the Unseen Challenges
- Navigating the Waves: Dairy Producers Defy Challenges to Keep Barns Full Amid Soaring Milk Prices and Adverse Conditions
- The Dairy Dilemma: Oversupply or Under-demand? Unpacking the Issue
 Join the Revolution!
 Join the Revolution!
Bullvine Daily is your essential e-zine for staying ahead in the dairy industry. With over 30,000 subscribers, we bring you the week’s top news, helping you manage tasks efficiently. Stay informed about milk production, tech adoption, and more, so you can concentrate on your dairy operations.