Central Asia is rising in the global dairy scene. Could these nations become the new dairy leaders? Find out more.
Summary: Have you ever wondered where the next big player in the dairy industry might be? Look no further than Central Asia. According to Dou Ming, Chief Analyst at Beijing Orient Agribusiness Consultant, Ltd., Central Asia is on the brink of becoming a significant force in the global dairy sector. Central Asia is set for a transformation thanks to technological advancements, increased productivity, and a closer partnership with China’s growing dairy industry. The region could soon rival traditional dairy giants with abundant resources and lower production costs. Central Asia’s average milk yield per cow is similar to China’s 20 years ago, indicating colossal growth potential. Factors contributing to this growth include cost advantages, natural resources, and learning from neighboring markets like China. While China’s dairy sector has modernized with cutting-edge technology, challenges like market volatility and structural separations persist. Central Asia can leverage China’s dairy farming skills and automation and precision farming breakthroughs to boost production and efficiency. Lower production costs in Central Asia mean high-quality dairy products at competitive prices, positioning the region to meet China’s growing demand.
- Central Asia is poised to become a significant player in the global dairy industry.
- Technological advancements and increased productivity are key drivers of growth.
- Central Asia benefits from abundant resources and lower production costs.
- The region’s average milk yield per cow suggests significant growth potential.
- China’s dairy sector has modernized but faces challenges like market volatility.
- Central Asia can learn from China’s dairy farming techniques and technology advancements.
- Lower production costs in Central Asia allow for competitive pricing of high-quality dairy products.
- Central Asia is well-positioned to meet China’s growing demand for dairy products.
Did you know Central Asia is poised to become a significant player in the global dairy market? It’s not just a possibility; it’s a promising reality! Central Asia, often overshadowed by dairy giants like the United States and New Zealand, is rapidly gaining recognition for its remarkable growth and potential. With its abundant natural resources and cost-effective production, this region is set to revolutionize the dairy sector. Central Asia is on the brink of becoming the new star of the global dairy market, and dairy producers worldwide should be excited about this burgeoning opportunity.
Breaking Down the Numbers
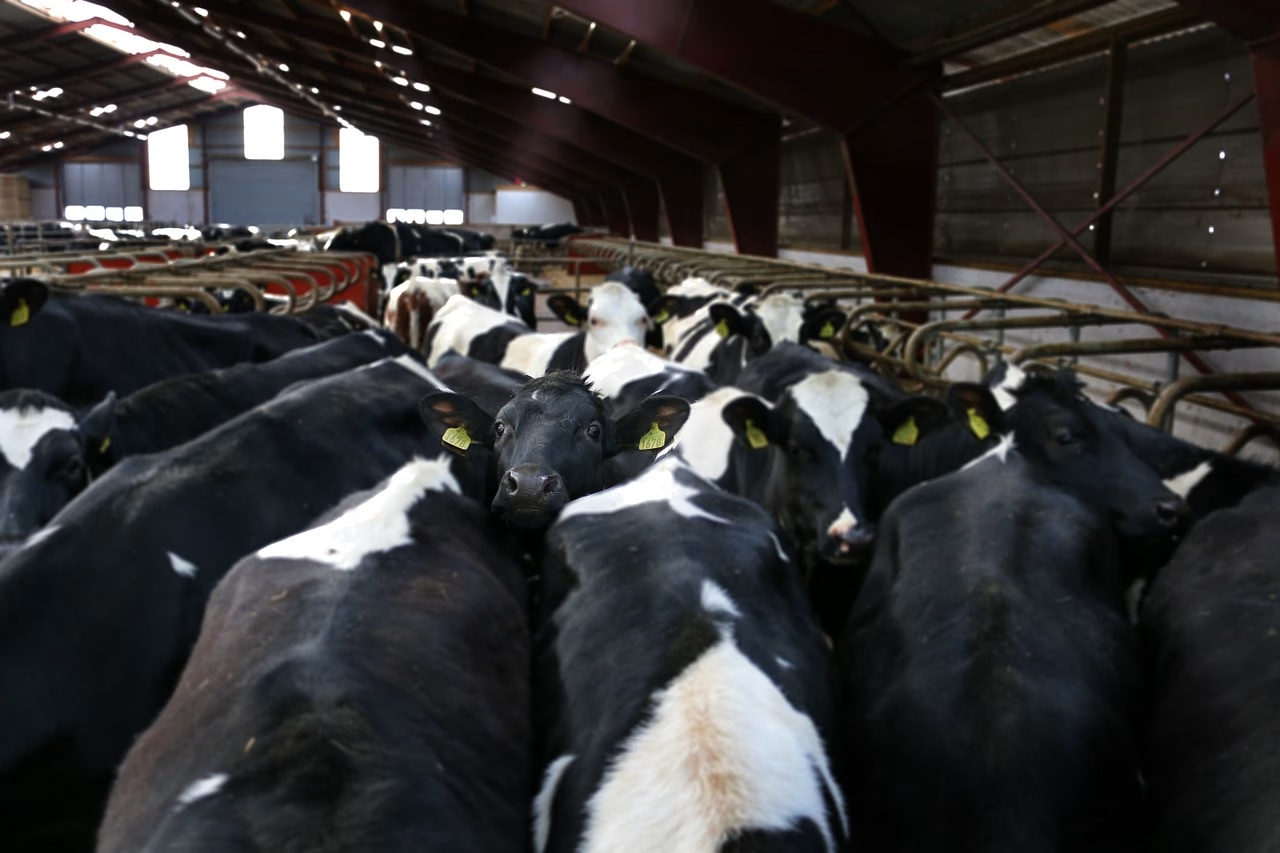
Let’s look at some eye-opening data. Kazakhstan, for example, produces over 6.5 million tons of dairy products yearly. Uzbekistan produces 12 million tons, while Turkmenistan provides around 2.4 million tons. In terms of herd size, these countries have always had access to enough grazing pasture and feed supplies, providing them a significant competitive advantage.
It’s not just about the current statistics; it’s about the growth potential. Central Asia’s average milk yield per cow is comparable to what China achieved over 20 years ago, indicating a vast opportunity for development. This growth potential makes Central Asia an attractive prospect for dairy producers worldwide.
Why the Growth?
Several factors are fueling this impressive rise:
- Cost Advantage: Central Asia benefits from relatively low production costs, especially land and forage.
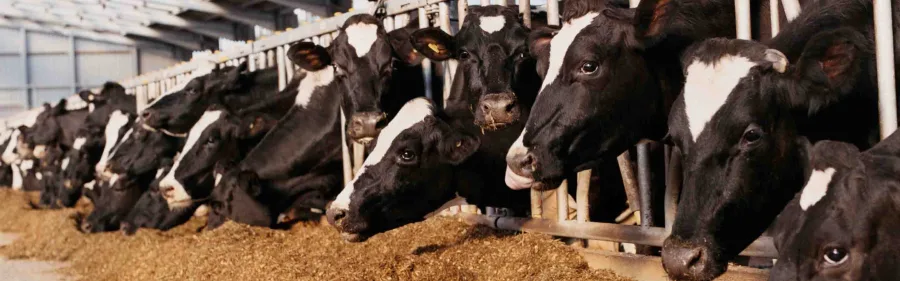
- Natural Resources: Abundant grazing land and rich feed resources make healthier, more productive herds.
- Learning from Neighbors: There’s potential for significant knowledge-sharing and collaboration with more advanced dairy markets like China.
From Modest Beginnings to Milk Giants: China’s Dairy Revolution Explained!
Over the last two decades, China’s dairy business has seen significant transformation. Imagine this: 2000 China produced around 9 million tons of milk yearly. Fast-forward to 2023, and that quantity has risen to 42 million tons annually! How did they make this leap? A single word: transformation.
First, let us speak about cows. Twenty years ago, China had around 5 million cows. Today, the herd has increased to almost 10 million. This includes both specialist dairy cows and those raised for other uses. In addition, per-cow production has increased significantly. Average milk output has increased from 2.5 tons per cow to around 9.4 tons. This is over four times more milk from the same number of cows!
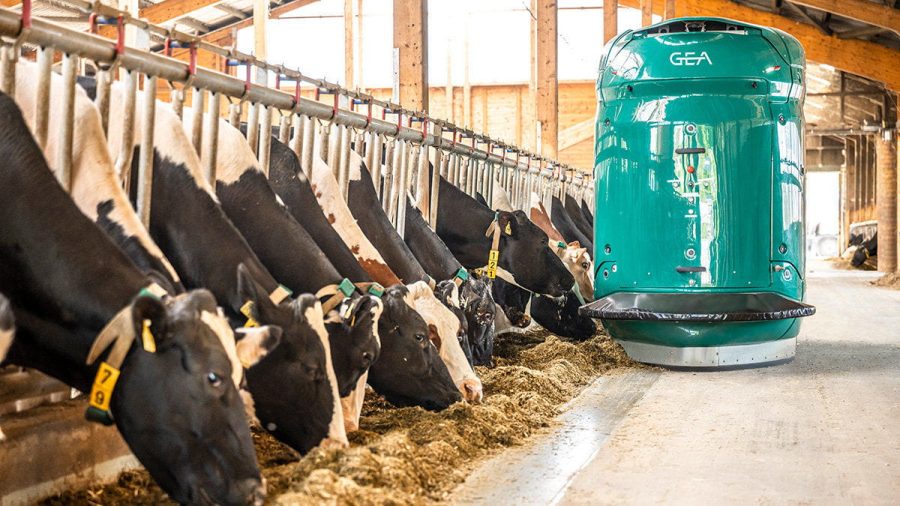
So, what drove this extraordinary growth? Technology and large-scale agriculture had critical roles. Modern dairy farms in China have adopted cutting-edge technology such as automated milking equipment and precision farming methods. These advances have boosted efficiency, output, and even animal welfare.
But it isn’t just about technology. The industry’s transition from small, traditional dairy farms to substantial commercial operations has allowed for mass production at cheaper costs. Improved herd genetics also had a considerable impact. The number of High-yield Holstein cows increased from around 2 million to 7 million.
In short, concerted technological, farm management, and genetic development efforts have made China’s dairy industry a productivity and efficiency powerhouse.
What’s Holding Back China’s Dairy Industry?
So, what’s slowing China’s dairy industry? Let us break it down. First, there’s the matter of market volatility. The milk price in China swings like a pendulum, varying not just seasonally but also monthly. How does this affect dairy farmers? It’s simple: predictability declines. How can you prepare for next month when you don’t know what you’ll earn today?
Then, there’s the structural separation between dairy farms and processors. In regions like Europe, processors often own farms, resulting in a seamless supply chain. However, this is different in China. Farms and processors operate autonomously in this location. Farmers sell their milk to processors, but here’s the kicker: processors have the power. They determine the buying price, and farmers often find themselves on the losing end of the bargaining table. This gap renders farmers vulnerable as they struggle to secure fair pricing for their hard-earned milk.
These variables combine to produce an unpredictable and frequently dangerous situation for China’s dairy farmers. They must negotiate not just market fluctuations but also unfavorable power dynamics. So, what is the endgame? Once these challenges are overcome, Chinese dairy producers can achieve stability and predictability.
Central Asia’s Dairy Revolution: Powered by Chinese Know-How
Central Asia is on the cusp of a dairy revolution, and it doesn’t have to navigate this transformation alone. Central Asian nations can leverage China’s advanced dairy farming techniques and technical innovations to propel their dairy businesses to new heights. Collaboration with China is not just a possibility; it’s a promising opportunity that could significantly boost Central Asia’s dairy industry.
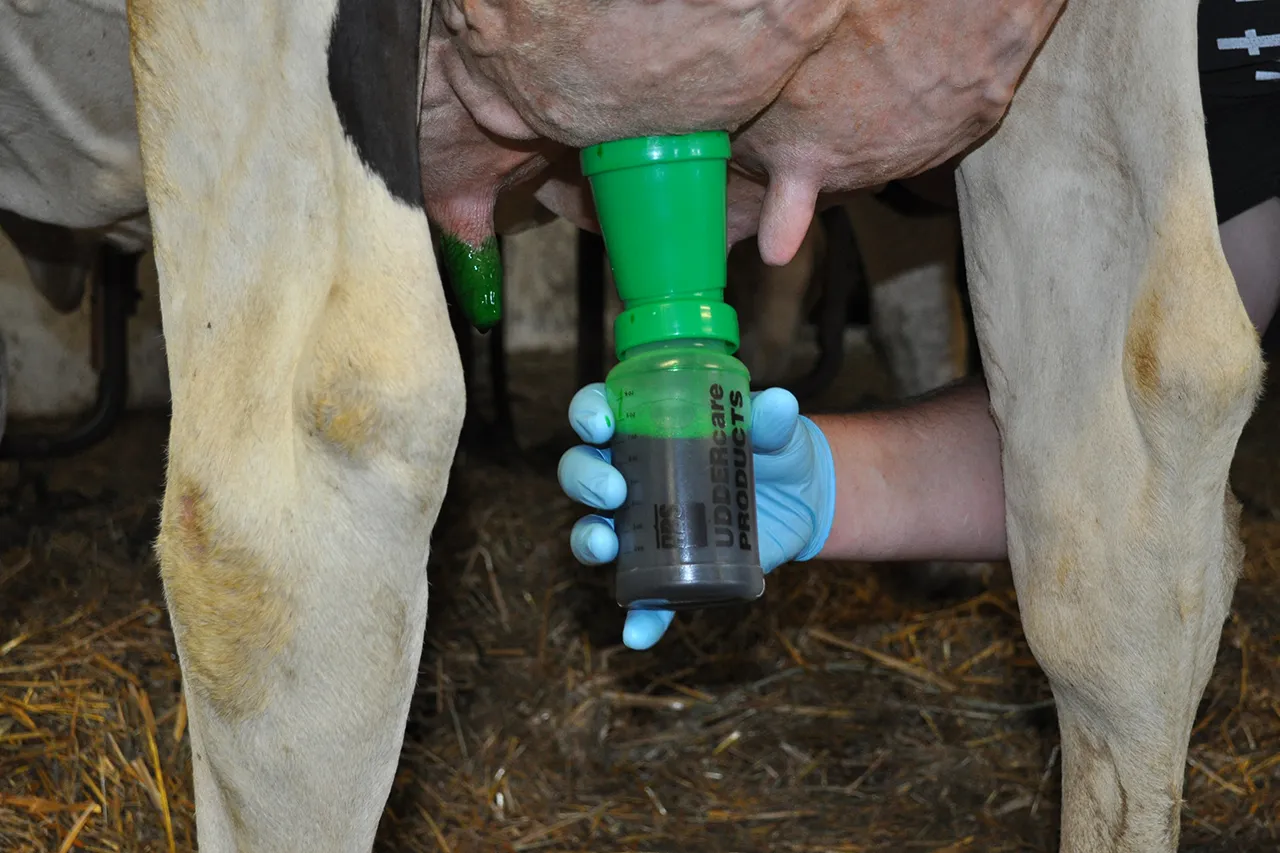
Consider using automated milking systems, precision farming, and improved herd genetics. These developments helped drive China’s dairy sector to where it is now. Central Asian nations may significantly increase production and efficiency by using comparable strategies, closing the milk output difference per cow.
So, what’s in it for Central Asia? A lot! Let us remember the economic rewards. Lower production costs in Central Asia provide an opportunity to create high-quality dairy products at a more competitive pricing. This alliance can make Central Asia a key supplier for China’s ever-increasing dairy demand.
The rewards are reciprocal. While Central Asian farmers improve their techniques, Chinese companies may get a more consistent and cheaper supply of dairy goods. These connections may take several forms, including industry conferences, study group exchanges, and on-site training sessions.
By cultivating a collaborative culture, China and Central Asia may unleash enormous potential, laying the groundwork for the region’s thriving dairy sector. The stars are aligned; all that remains is to grasp the chance!
Unleashing the Power of Innovation: China’s Dairy Tech Meets Central Asia
Central Asia is on the verge of a dairy revolution but does not have to do it alone. Central Asian nations may use China’s dairy farming skills and technical breakthroughs to propel their dairy businesses to new heights.
Consider using automated milking systems, precision farming, and improved herd genetics. These developments helped drive China’s dairy sector to where it is now. Central Asian nations may significantly increase production and efficiency by using comparable strategies, closing the milk output difference per cow.
So, what’s in it for Central Asia? A lot! Lower production costs in Central Asia present a unique opportunity to produce high-quality dairy products at a more competitive price. This alliance has the potential to position Central Asia as a critical supplier for China’s ever-growing dairy demand, promising significant economic rewards for the region.
The rewards are reciprocal. While Central Asian farmers improve their techniques, Chinese companies may get a more consistent and cheaper supply of dairy goods. These connections may take several forms, including industry conferences, study group exchanges, and on-site training sessions.
By cultivating a collaborative culture, China and Central Asia may unleash enormous potential, laying the groundwork for the region’s thriving dairy sector. The stars are aligned; all that remains is to grasp the chance!
Understanding the Future of Global Dairy Markets: Trends and Dynamics
Understanding the global dairy industry’s future requires examining existing trends and dynamics. Global demand for dairy products is continually expanding, driven by increased consumption in developed and developing countries. This poses obstacles and possibilities for significant powers, including China and Central Asia.
Increasing Demand and Supply
Recent consultations with industry experts have shown a consensus: as global dairy demand rises, so will the need for expanded supply. Developed nations with high manufacturing costs may need help to meet growing demand. Central Asia is ripe for opportunity.
With its extensive resources and cheap manufacturing costs, Central Asia has the potential to close this increasing gap. Countries in the area, such as Kazakhstan and Uzbekistan, have the potential to improve their dairy exports, becoming significant suppliers worldwide considerably. This is not just guesswork but a strategic prognosis based on resource availability and competitive production costs.
The China Connection
China, a significant participant in the dairy industry, now covers around 70% of its dairy demands via local production, with the remaining 30% coming from imports. As China’s population expands, so does its need for dairy, implying that it will continue to be a significant importer of dairy goods. This steady demand bodes well for Central Asian manufacturers looking to enter the Chinese market by taking advantage of cheaper production costs.
China’s success in ramping up dairy production via technical advancements might serve as a model for Central Asia. Knowledge exchange and collaborations might help Central Asian nations improve their manufacturing efficiency, ensuring they match global standards and needs.
A promising future.
Central Asia’s involvement in the global dairy business has become more critical. The region’s potential for growth is well aligned with the worldwide trend of shifting industrial dynamics owing to cost restrictions in more affluent countries. In turn, China will continue to play an essential role in balancing its production with significant import requirements.
As global dairy demand rises, Central Asia’s strategic stance might usher in a new era of development and partnership, making it a vital player worldwide.
The Bottom Line
Reflecting on the information presented during our meeting, it is evident that China and Central Asia have several potentials in the global dairy business. China’s spectacular increase in milk output, technical innovations, and efficiency gains demonstrate a dynamic and fast-changing industry. Simultaneously, Central Asia, with its enormous natural resources and cheap manufacturing costs, is ready to capitalize on these advantages to become a significant participant in the world arena.
Market instability, structural issues in China, and the need for more innovation uptake in Central Asia all pose obstacles that may be solved via cooperation and information exchange. With enhanced collaboration, these areas may learn from one another’s accomplishments, resulting in a more integrated and efficient dairy business that benefits all stakeholders.
Imagine a future in which Central Asia emerges as a global dairy market leader, propelled by innovation and innovative collaborations with its neighbors. This ideal is achievable only if we keep informed and actively engage in current changes. Stay tuned to see how these rising developments impact the dairy industry.