Latest News
 Cabot Creamery Butter RecallCabot's butter recall exposes critical processing gaps every dairy farmer should address. Quality control lessons inside EXECUTIVE SUMMARY: Cabot Creamery has r […]
- U.S. Dairy Farmers Unlikely to Cash in on Chinese Demand84% tariffs slam U.S. dairy exports to China. Why can't farmers capitalize on China's milk shortage despite crashing prices & production? EXECUTIVE SUMMARY: […]
- Trade War Redux: Why Milk Prices Already Dropped 12% Before Tariffs HitTrump's tariffs spark 12% milk price crash. With 43% of dairy exports at risk, can farmers survive the trade war? EXECUTIVE SUMMARY: The U.S. dairy industry fac […]
- CME Dairy Market Report – April 9, 2025: Cheddar Barrel Prices Surge on Strong Buying Interest; Dry Whey Declines Notably Amidst Generally Firming Dairy FuturesCheddar barrels surge 1.75¢ as whey plummets; feed costs squeeze dairy margins—market braces for volatility amid global uncertainty. EXECUTIVE SUMMARY: Today's […]
- GLP-1 Weight Loss Drugs Reshape Dairy Demand: The $35,000 Question No Dairy Farmer Can Afford to IgnoreGLP-1 drugs slash cheese sales 7.2% but boost Greek yogurt 40%. Dairy farmers: Adapt to protein or risk $35k losses. EXECUTIVE SUMMARY: GLP-1 weight-loss medica […]


Feature Articles
- Dad at 80: How Murray Hunt Revolutionized Canadian Dairy GeneticsAt 80, Murray Hunt’s dairy genetics innovations still shape global herds—meet the visionary who made science the farmer’s ally. E229 Dad at 80: How Murray Hunt […]
- When Faith Meets Farming: Mark Yeazel’s Amazing Journey from Holstein Breeder to Tanzanian Dairy MissionaryFrom elite Holstein breeder to Tanzanian missionary: How Mark Yeazel trades show rings for orphan care through dairy farming. E228 When Faith Meets Farming: Mar […]
- BLACK HIDE BLINDNESS: Why Breeding Only for Color is Destroying Your Dairy-Beef ProfitsBlack hide obsession is costing you thousands. Those cheap Angus straws? Economic suicide. Discover why color alone won't save your beef-on-dairy profits. E227 […]
- Stud Wars: April 2025 – The Genetic Force AwakensSexing Tech's 40% NM$ empire vs ABS's 68% polled coup – the dairy genetics galaxy will never be the same. E225 Stud Wars: April 2025 – The Genetic Force Awa | R […]
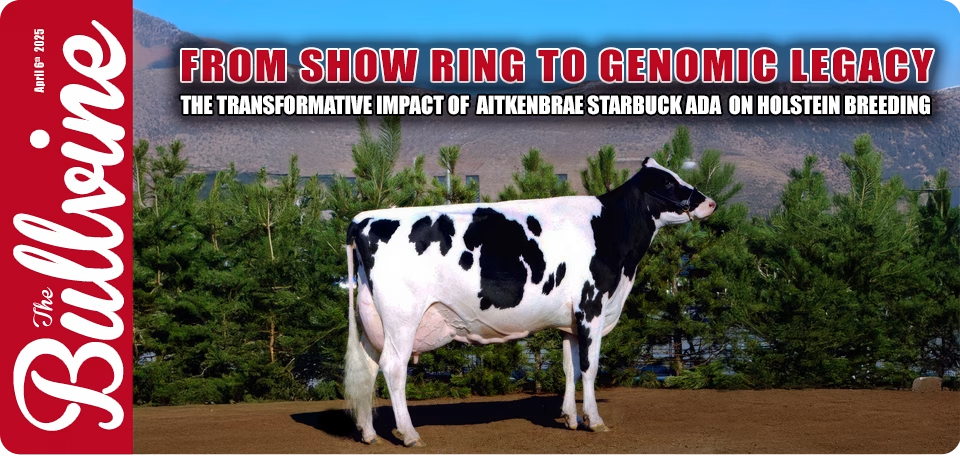
- From Show Ring to Genomic Legacy: The Transformative Impact of Aitkenbrae Starbuck Ada on Holstein BreedingHow one unassuming cow born in rural Ontario revolutionized Holstein genetics worldwide, bridging show ring glamour with genomic science. E222 From Show Ring to […]


- Dad at 80: How Murray Hunt Revolutionized Canadian Dairy Genetics
-

- When Faith Meets Farming: Mark Yeazel's Amazing Journey from Holstein Breeder to Tanzanian Dairy Missionary
-

- BLACK HIDE BLINDNESS: Why Breeding Only for Color is Destroying Your Dairy-Beef Profits
-
- Stud Wars: April 2025 - The Genetic Force Awakens
-
- From Show Ring to Genomic Legacy: The Transformative Impact of Aitkenbrae Starbuck Ada on Holstein Breeding
-
- Spring Pasture Powerplay: Balancing Grazing Efficiency with Milk Component Goals
-
- Unlocking Dairy Robot Financing: How Smart Farmers Are Funding Their Automated Future
-
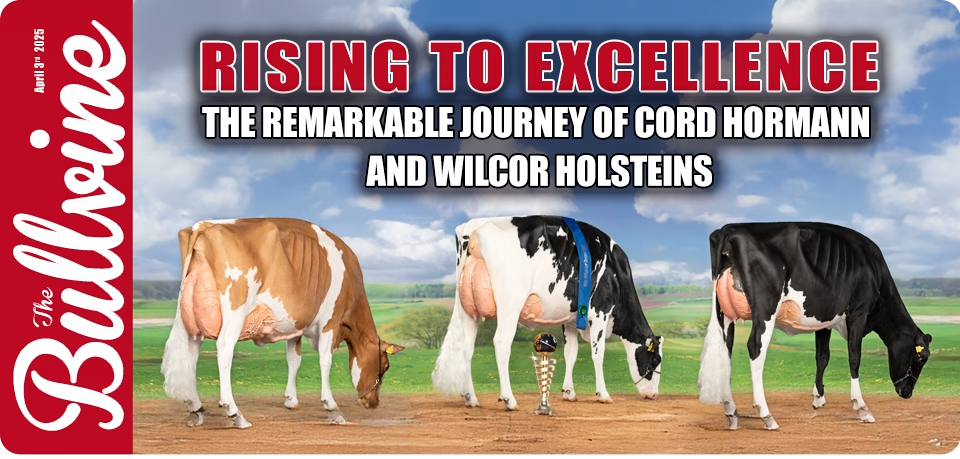
- Rising to Excellence: The Remarkable Journey of Cord Hormann and Wilcor Holsteins
-
- April 2025 Global Holstein Evaluations: New Leaders Emerge as Genetic Progress Accelerates Worldwide
-
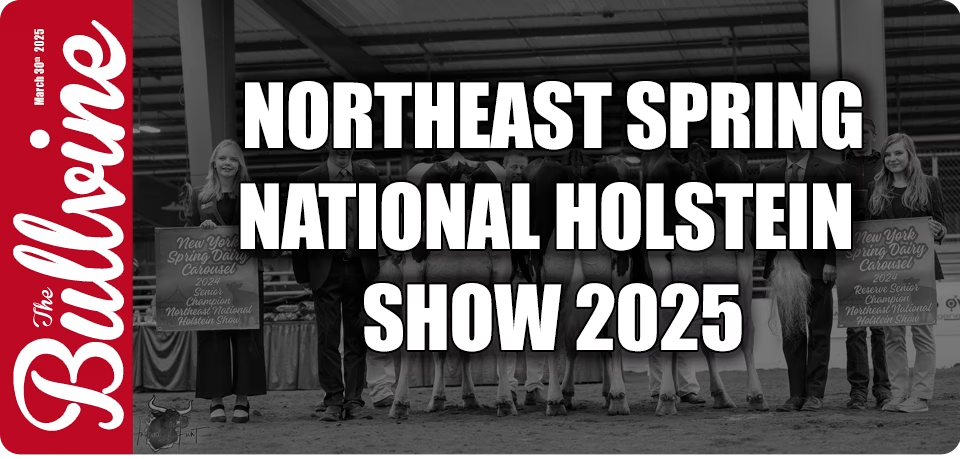
- Northeast Spring National Holstein Show 2025
-


Tanbark Trail
- Northeast Spring National Holstein Show 2025March 31st, 2025 @ Hamburg, NY E217 Northeast Spring National Holstein Show 2025 | RSS.com The New York Spring Holstein Show, judged by Ryan Krohlow, showcased exceptional dairy cattle across multiple age divisions. The competition featured remarkabl […]
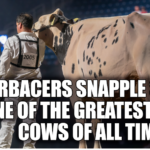
- Is Erbacers Snapple Shakira One of the Greatest Show Cows of All Time?Uncover why Erbacres Snapple Shakira stands among the top dairy show cows of all time. What makes her excel in the competitive dairy arena? E55 Is Erbacers Snapple Shakira One of the Greatest Show Cows of All Time? From the moment she steps into the […]
- The Royal Winter Fair 2024 – JerseyJudge Jeff Sales NTENSE JOEL DELPHIE ETGrand ChampionThe Royal - Jersey Show 2024WEEKSDALE/HI-CALIBER/ROCK ALLEN/F&D BORBA, BREADALBANE, PE c LEACHLAND VIDEO MOCHA K Intermediate Champion The Royal - Jersey Show 2024 WEEKSDALE HOLSTEINS, BRE […]
- The Royal Winter Fair 2024 – HolsteinJudge Blair Weeks JEFFREY-WAY HARD ROCK TWIGS Grand Champion The Royal - Holstein Show 2024 K. DOEBERIENER, L. BOWEN & PAT CONROY, R&F LIVESTOCK INC, & WALKER DAIRY INC. Grand Champion: Jeffrey-Way Hard Rock Twigs, 1st 4-year-old, K Doebe […]
- The Royal Winter Fair 2024 – Red & White HolsteinNovember 4th 2024 Judge: Markus Hehli, Rimbey, AB PREMIUM APPLE CRISP LILLY Grand Champion The Royal - Red & White Holstein Show BUTLERVIEW FARM, CHEBANSE, IL Grand Champion: Premium Apple Crisp Lilly (Apple-Crisp), 1st 5-year-old, Butlerview Far […]