Dairy markets brace for impact as Trump’s 25% tariffs on Canadian and Mexican imports loom. With cheese stocks tight, butter abundant, and feed costs volatile, the industry faces a perfect storm. Will these trade tensions reshape North American dairy or trigger another costly market disruption?
Summary
The U.S. dairy industry faces unprecedented challenges as President Trump’s 25% tariffs on Canadian and Mexican imports are set to take effect on March 4, 2025. This Weekly Dairy Market Report highlights the potentially devastating consequences for U.S. dairy exports, with Mexico, China, and Canada being key markets at risk. CME spot markets have already responded with significant declines across most dairy commodities. While cheese supplies remain tight due to record exports, butter inventories are surging, creating a complex supply dynamic. The USDA has adjusted its 2025 milk production forecast downward, reflecting lower-than-expected output. Feed costs continue to pressure dairy margins, with recent market movements showing corn and soybean futures declines. Amid these challenges, the industry grapples with profitability concerns, as indicated by a concerning milk-feed ratio of 2.10. As stakeholders brace for potential market disruptions, the report underscores the critical juncture at which the U.S. dairy industry stands, with the outcome of these trade disputes potentially reshaping North American dairy trade for years to come.
Key Takeaways
- President Trump’s 25% tariffs on Canadian and Mexican imports will take effect on March 4, 2025, and they threaten key U.S. dairy export markets.
- The CME spot markets showed significant declines: cheddar blocks were down 12.5¢ to $1.775/lb, and butter was at $2.345/lb (the lowest since April 2023).
- U.S. cheese supplies are tight (down 5.7% YoY), while butter inventories surged 26% in January alone.
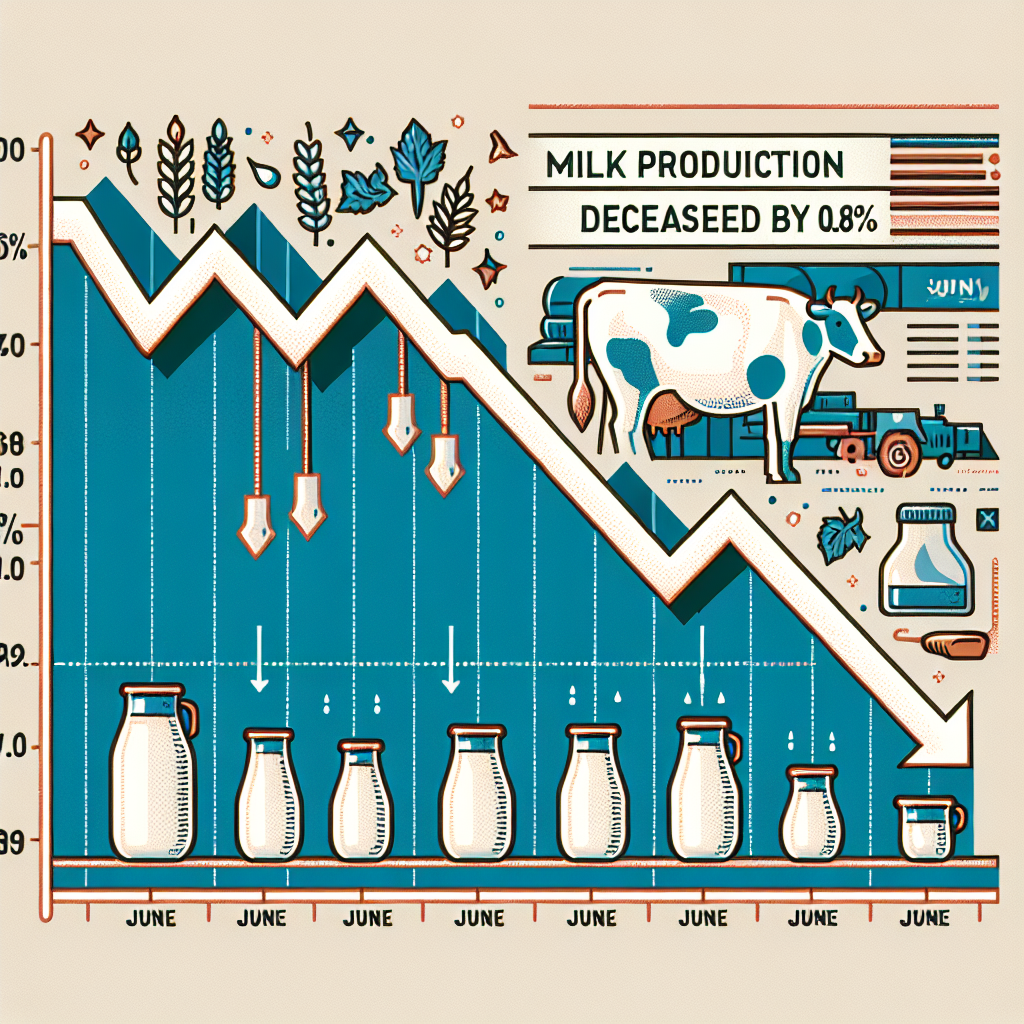
- USDA lowered the 2025 milk production forecast to 227.2 billion pounds, down 0.8 billion from previous estimates.
- Feed costs remain a concern: May corn futures are down to $4.695/bushel, and soybeans at $10.25/bushel.
- The milk-feed ratio is at 2.10, well below the 2.45 five-year average, indicating profitability challenges.
- Despite current disruptions, the global dairy market is expected to grow from $649.9 billion in 2025 to $813.6 billion by 2030.
- Industry experts warn of potential farm-gate revenue losses of up to $16.6 billion due to trade tensions.
- 62% of traders are reportedly bearish on dairy markets, prompting cautious approaches and hedging strategies.
- The outcome of trade disputes could reshape the North American dairy trade for decades.

The U.S. dairy industry faces a perfect storm of challenges as February 2025 approaches. President Trump’s confirmation that 25% tariffs on Canadian and Mexican imports will take effect on March 4th has sent ripples through dairy markets already dealing with complex supply dynamics and volatile commodity prices. The threat of retaliatory measures from America’s top dairy export destinations presents a significant risk to an industry grappling with tight margins and production adjustments. Let me explain what’s happening and what it means for dairy stakeholders nationwide.
Tariff Tensions Threaten Key Export Markets
President Trump has cleared up any confusion about his administration’s trade policy, confirming via Truth Social that the proposed 25% tariffs on Canadian and Mexican imports will take effect on March 4th. This announcement comes despite a prior 30-day reprieve granted to both countries in exchange for cooperation on fentanyl trafficking and immigration issues. The timing couldn’t be more precarious for the U.S. dairy industry, which counts Mexico, China, and Canada among its top export destinations.
Howard Lutnick, Trump’s pick for Commerce Secretary, has been particularly vocal about Canada’s dairy policies during his recent confirmation hearings:
“Canada … treats our dairy farmers horribly. That’s got to end. I’m going to work hard to make sure, as an example for your dairy farmers, they do much better in Canada than they’ve ever done before.”
| Top U.S. Dairy Export Markets (2024) | Volume (Metric Tons) | % of Total Exports | Value (USD Millions) |
| Mexico | 576,000 | 24.8% | $1,840 |
| Southeast Asia | 395,000 | 17.0% | $1,320 |
| China | 311,000 | 13.4% | $970 |
| Canada | 246,000 | 10.6% | $810 |
| Middle East/North Africa | 172,000 | 7.4% | $580 |
The administration appears determined to use tariffs as leverage to dismantle Canada’s supply management system, which imposes tariffs as high as 298% on imported dairy products. When questioned about the potential economic impacts of these tariffs, Lutnick pivoted to frame the issue as one of national security:
“If we are your biggest trading partner, show us respect: shut your border and end fentanyl coming into this country. It’s not a tariff, per se; it is an action of domestic policy.”
While the administration frames these tariffs as a strategic move to gain concessions ahead of the USMCA renegotiation in 2026, industry experts warn of potentially devastating consequences. Previous analysis by the U.S. Dairy Export Council found that tariffs during past trade tensions with Mexico and China could reduce farm-gate revenue by up to $16.6 billion through 2023. The stakes couldn’t be higher, with Mexico accounting for nearly a quarter of U.S. dairy exports by volume.
From the Canadian perspective, dairy farmers have expressed concern while supporting their government’s position. David Wiens, President of Dairy Farmers of Canada, stated on February 2, 2025:
“Like all Canadians, our nation’s dairy farmers are deeply concerned about the far-reaching impacts that the high tariffs imposed by the United States on Canadian products will have on consumers, industries, and economies on both sides of the border. We stand with our federal government and all parties, showing determination and commitment to swiftly resolving this impasse.”
Recent market reactions show the industry is already feeling the impact. Butter prices plunged 4.50 cents to $2.3700 per pound amid concerns about Canada’s impending retaliatory tariffs on U.S. exports. This sharp decline translates to a $0.48/cwt loss in butterfat payouts for farmers – an unwelcome hit to already strained profit margins.
U.S.-Canada Dairy Tariff Comparison
| Product Category | Canadian Over-Quota Tariff | U.S. Over-Quota Tariff | Canadian Within-Quota Tariff | U.S. Within-Quota Tariff |
| Fluid Milk | 241% | 77% | 0% | 0.4¢/liter |
| Cheese (Cheddar) | 245% | 35% | 0.7% | 12% ad valorem |
| Butter | 298% | 69% | 1% | 12.4¢/kg |
| Yogurt | 237% | 20% | 0.5% | 2.8¢/kg |
| Ice Cream | 243% | 22% | 0.6% | 5% ad valorem |
Current Market Conditions: A Sea of Red Ink
The CME spot markets have responded to the tariff threats with significant declines across most dairy commodities. Cheddar blocks plunged 12.5 cents to $1.775 per pound by week’s end, while barrels fell 2 cents to $1.78. The latest CME data shows butter at $2.345 per pound, touching its lowest price since April 2023. Meanwhile, nonfat dry milk retreated 4 cents to $1.20, its lowest price since July 2024, and whey fell 3.5 cents to 51 cents, also hitting a seven-month low.
While many economists have raised concerns about tariffs potentially driving inflation, Howard Lutnick dismissed these concerns during his confirmation hearing:
“A particular product’s price may increase, but all of them? This is not inflationary. It is just nonsense that tariffs cause inflation. It is nonsense.”
| CME Spot Dairy Commodity Prices (Feb 28, 2025) | Price ($/lb) | Weekly Change | Year-Over-Year Change |
| Cheddar Blocks | $1.775 | -12.5¢ | -8.3% |
| Cheddar Barrels | $1.780 | -2.0¢ | -7.2% |
| Butter | $2.345 | -7.0¢ | -12.4% |
| Nonfat Dry Milk | $1.200 | -4.0¢ | -5.1% |
| Dry Whey | $0.510 | -3.5¢ | -11.3% |
These price movements occur against a backdrop of interesting supply dynamics. U.S. cheese supplies remain relatively tight, thanks to record-breaking exports in 2023 and 2024. The USDA’s Cold Storage report shows 1.37 billion pounds of cheese in warehouses as of January 31st, 5.7% less than a year ago. Stocks of American-style cheese are particularly tight, trailing year-ago volumes by 7.4% and registering the lowest January volume since 2018.
However, the butter market tells a different story. Industry contacts report that “recent milkfat levels are like nothing they have ever witnessed,” with average butterfat from all milk sold through Federal Milk Marketing Orders in January reaching an all-time high of 4.43%. This has led to a cream surplus that’s putting significant pressure on butter processing capacity. The result? Butter churns are running full-tilt, but the larder is already packed with 270.28 million pounds of butter in cold storage at the end of January – up 26% in just 31 days and 9.2% higher than January 2024.
Cold Storage Inventory Comparison
| Product | Jan 2025 Inventory (Million lbs) | Dec 2024 Inventory | Monthly Change | Year-Over-Year Change |
| Total Cheese | 1,370 | 1,412 | -3.0% | -5.7% |
| American Cheese | 742 | 771 | -3.8% | -7.4% |
| Butter | 270.28 | 215 | +26.0% | +9.2% |
Production Forecasts and Supply Outlook
The USDA has adjusted its 2025 milk production forecast downward to 227.2 billion pounds, about 0.8 billion pounds less than the previous forecast. This reduction reflects lower-than-expected milk per cow output, revised by 85 pounds to 24,200 pounds per cow. The national milking herd is projected to average 9.390 million head in 2025, unchanged from previous forecasts when accounting for rounding.
| USDA Milk Production Forecasts (2025) | Latest Forecast | Previous Forecast | Change |
| Total Milk Production (billion lbs) | 227.2 | 228.0 | -0.8 |
| Milk Per Cow (lbs) | 24,200 | 24,285 | -85 |
| Dairy Cow Inventory (million head) | 9.390 | 9.390 | 0 |
| All-Milk Price Forecast ($/cwt) | $23.05 | $22.55 | +$0.50 |
Despite these downward revisions to production forecasts, there appears to be more than enough milk for cheese vats, with spot milk trading at a discount in central cheese-producing states. Market participants remain concerned that new online cheese processing capacity could quickly boost U.S. cheese supplies – a worrying prospect if retaliatory tariffs compromise export markets.
Some dairy farmers are exploring alternative revenue sources to weather market volatility. Abbi Prins, livestock analyst with CoBank, notes the growing trend of beef-dairy crossbreeding as one such strategy:
“The data also showed that beef-on-dairy cattle maintained the largest proportion of their value from feeder price to slaughter cattle auction price on a per hundredweight basis. That’s an important financial metric for feedlots… preliminarily, it reaffirms the value proposition beef-on-dairy brings to the wider beef sector.”
The all-milk price for 2025 is now at $23.05 per hundredweight, up 50 cents from last month’s forecast. However, these price projections may need further revision if the brewing trade disputes escalate as feared. Weekly futures markets have already reacted, with Class III and IV contracts losing 25 and 50 cents this week. Class III futures are fading to the low $18s, and Class IV milk is trading in the high $18s and low $19s.
U.S. Trade Representative Katherine Tai, speaking about the upcoming USMCA review, hinted at the administration’s strategy:
“The whole point is to maintain a certain level of discomfort, which may involve a certain level of uncertainty…”
Federal Milk Order Class Prices ($/cwt)
| Month | Class I | Class II | Class III | Class IV |
| Feb 2025 | $21.42 | $19.87 | $18.25 | $19.15 |
| Jan 2025 | $22.10 | $20.12 | $18.55 | $19.43 |
| Dec 2024 | $22.87 | $20.45 | $18.62 | $19.62 |
| Nov 2024 | $23.56 | $20.78 | $19.95 | $20.12 |
| Oct 2024 | $23.12 | $20.35 | $19.42 | $19.87 |
| Change (Feb vs Jan) | -$0.68 | -$0.25 | -$0.30 | -$0.28 |
Feed Market Developments
Feed costs continue to pressure dairy margins. Recent market movements show May corn closing at $4.695 per bushel, down more than 35 cents weekly, while May soybeans plunged 32 cents to $10.25. The May soybean meal contract closed at $300 per ton, down $4 this week.
| Feed Futures Prices (Feb 28, 2025) | Current Price | Weekly Change | Annual Change |
| Corn (May 2025), $/bushel | $4.695 | -$0.35 | -8.2% |
| Soybeans (May 2025), $/bushel | $10.25 | -$0.32 | -10.5% |
| Soybean Meal (May 2025), $/ton | $300.00 | -$4.00 | -7.8% |
| Hay (Premium Alfalfa), $/ton | $235.00 | -$2.50 | -5.2% |
The USDA’s Outlook Forum projected that farmers will plant 94 million acres of corn this spring, up significantly from 90.6 million acres last year. Using a trendline yield at a record-high 181 bushels per acre, U.S. corn production for the 2025-26 crop year is tentatively predicted to reach nearly 15.6 billion bushels – potentially the largest harvest on record.
Interestingly, farmers aren’t particularly enthusiastic about planting corn at current prices, but they’re even less thrilled about soybeans. USDA predicts farmers will plant 84 million acres of soybeans this spring, down from 87.1 million in 2024. With high input costs and relatively low crop prices, marginal farmers may pivot toward forages and specialty crops.
USDA Crop Acreage Projections (2025 vs 2024)
| Crop | 2025 Projected Acreage (millions) | 2024 Actual Acreage | Change (millions) | Change (%) |
| Corn | 94.0 | 90.6 | +3.4 | +3.8% |
| Soybeans | 84.0 | 87.1 | -3.1 | -3.6% |
| Wheat | 48.5 | 47.2 | +1.3 | +2.8% |
| Hay | 52.3 | 52.8 | -0.5 | -0.9% |
Consumer Trends Amidst Market Volatility
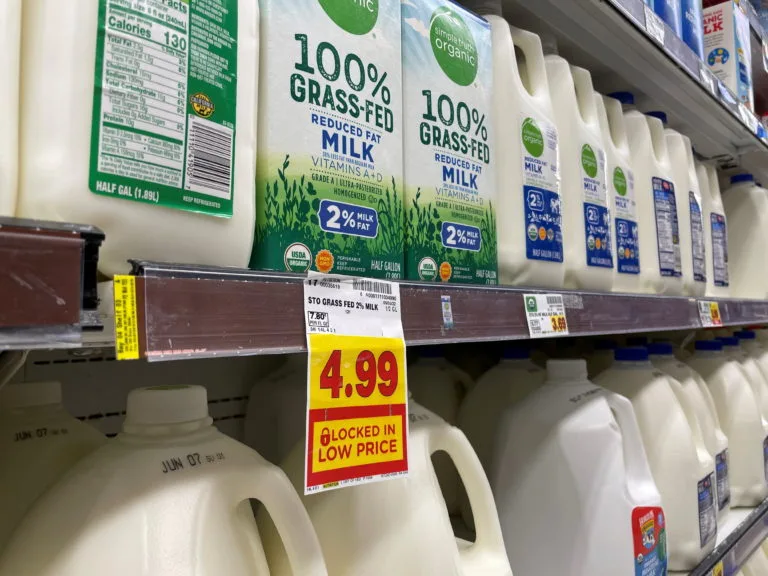
While market volatility dominates headlines, the underlying consumer trends shaping dairy demand are worth noting. Consumers increasingly prefer functional dairy products, low-fat options, and organic/grass-fed products. Growth in on-the-go dairy snacks and single-serve portions continues to provide bright spots in an otherwise challenging market environment.
The global dairy market is expected to grow from $649.9 billion in 2025 to $813.6 billion by 2030, suggesting that long-term demand remains strong despite current market disruptions. However, American producers may be disadvantaged if trade disputes limit their ability to capitalize on this growth.
US Consumer Dairy Price Index (2025)
| Dairy Product Category | Price Index (Jan 2024=100) | Monthly Change | Annual Change |
| Fluid Milk | 105.8 | +0.3% | +3.2% |
| Cheese | 108.2 | +0.2% | +4.7% |
| Butter | 110.5 | -0.5% | +5.8% |
| Ice Cream | 106.3 | +0.1% | +3.5% |
| Yogurt | 104.2 | -0.2% | +2.8% |
Trading Strategy in Uncertain Times
With 62% of traders reportedly bearish on dairy markets, stakeholders are adopting cautious approaches. Experts recommend monitoring regional production trends closely and considering hedging strategies to mitigate price volatility risks. Some farmers struggling with tight margins are exploring niche markets like direct-to-consumer raw milk sales, which can offer premiums of up to $4.50/cwt.
The milk-feed ratio, a key measure of dairy profitability, sits at a concerning 2.10, well below the five-year average of 2.45 and the 2.25 typically needed for a 5% profit margin. This tight margin environment makes the threatened tariffs all the more concerning for dairy operators still recovering from previous market disruptions.
Dairy Profitability Indicators (Feb 2025)
| Indicator | Current Value | 5-Year Average | Threshold for Profitability |
| Milk-Feed Ratio | 2.10 | 2.45 | 2.25 |
| Income Over Feed Cost | $7.92/cwt | $9.35/cwt | $8.50/cwt |
| Operating Margin | 4.3% | 6.8% | 5.0% |
| Debt-to-Asset Ratio | 0.38 | 0.32 | <0.35 |
Conclusion: Industry at a Crossroads
The U.S. dairy industry is at a precarious crossroads. While some support the administration’s tough stance against Canada’s dairy policies, many farmers fear repeating the costly mistakes of past trade wars. The 2018 trade disputes resulted in a $28 billion government bailout and accelerated the decline of small dairy operations—a scenario no one wishes to repeat.
Canadian Ministers Mary Ng and Lawrence MacAulay have made their position clear regarding previous CUSMA dairy disputes:
“Canada is very pleased with the dispute settlement panel’s findings, with all outcomes favoring Canada. This is good news for Canada’s dairy industry and supply management system. The Government of Canada will continue to preserve and defend Canada’s supply management system, which supports producers by providing the opportunity to receive fair returns for their labor and investments.”
As March 4th approaches, stakeholders are watching for both the implementation of tariffs and potential retaliatory measures from trading partners. The outcome of these disputes could reshape the North American dairy trade for decades. For now, the industry must prepare for potential market disruptions while advocating for policies that support long-term sustainability rather than short-term posturing.
Canadian Public Safety Minister David McGuinty perhaps best summarized the path forward:
“When the new administration suggests that we need to bear down on this question of fentanyl, we agree. We want to see progress in cooperation because we know the best way to tackle this crisis is together.”
Whether these tariffs will lead to meaningful reforms in global dairy trade or trigger another market disruption remains to be seen. What’s clear is that dairy farmers, processors, and exporters are bracing for turbulence ahead, hoping that policy objectives can be achieved without sacrificing the health of America’s dairy industry.
Learn more
- Trump’s Tariffs: Can History Repeat Without Repeating Mistakes?
- 25% Tariffs Ignite $1.2 Billion Dairy Trade Crisis Between U.S. and Canada
- Trump’s Tariff Strategy: A Game-Changer for America’s Dairy Industry
 Join the Revolution!
 Join the Revolution!
Bullvine Daily is your essential e-zine for staying ahead in the dairy industry. With over 30,000 subscribers, we bring you the week’s top news, helping you manage tasks efficiently. Stay informed about milk production, tech adoption, and more, so you can concentrate on your dairy operations.