Latest News
 Dairy’s Big Break: How New Snap Legislation Could Reshape Your Bottom LineNew SNAP bill could put $2.4B/year in dairy farmers' pockets while fixing America's nutrition gap. Here's how to cash in. EXECUTIVE SUMMARY: The bipartisan Dair […]
- Dairy’s Golden Calf Rush: $1,000+ Crossbreds Reshape Farm Economics$1,000+ calves rewrite dairy profits! Why beef shortage means YOUR herd is now a goldmine. EXECUTIVE SUMMARY: Record-high calf prices ($1,000+/head) are reshapi […]
- Milk Tsunami Ahead: USDA Exposes 2025 Price Crash TriggersUSDA warns of 2025 dairy profit meltdown: Milk prices crash $1.95/cwt in 4 months. Discover survival tactics for the coming storm. EXECUTIVE SUMMARY: The April […]
- 84% Chinese Tariffs Slam US Dairy: Why Whey & Lactose Exports Face Crisis84% Chinese tariffs slam US dairy exports. Prices plunge, markets scramble. Can producers pivot fast enough to survive? EXECUTIVE SUMMARY: Escalating US-China t […]
- CME Dairy Market Report: April 10, 2025 – Cheese Blocks and Butter Prices Surged Despite Bearish USDA OutlookCheese and butter prices surge despite bearish USDA forecast and 84% China tariffs. What's driving this contradictory market behavior? EXECUTIVE SUMMARY: CME da […]


Feature Articles
- Revolutionary Colostrum Protocol Adding $500 Per Heifer to Your Bottom LineAre you discarding liquid gold? Discover how extended colostrum feeding adds $500 per heifer while slashing treatment costs and boosting lifetime milk. E232 Rev […]
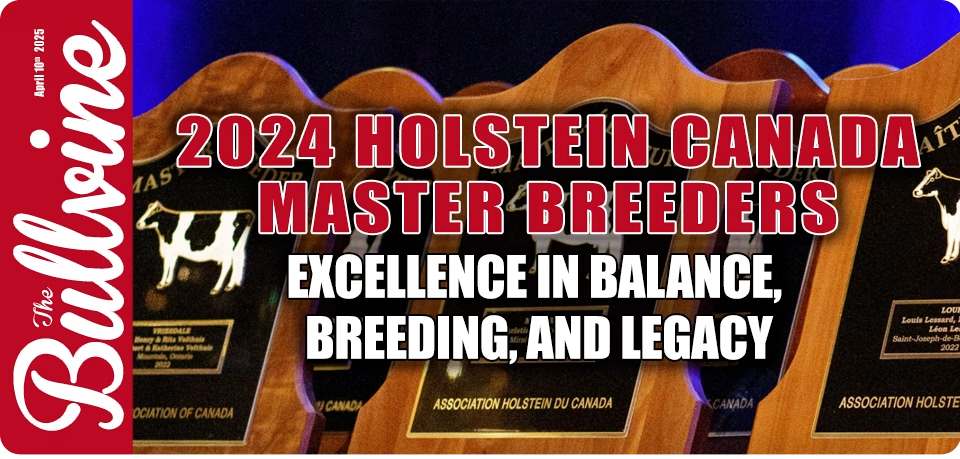
- 2024 Holstein Canada Master Breeders: Excellence in Balance, Breeding, and Legacy19 Canadian dairy farms earn elite 2024 Master Breeder status—discover the secrets behind their balanced breeding success! E230 2024 Holstein Canada Master Bree […]
- Dad at 80: How Murray Hunt Revolutionized Canadian Dairy GeneticsAt 80, Murray Hunt’s dairy genetics innovations still shape global herds—meet the visionary who made science the farmer’s ally. E229 Dad at 80: How Murray Hunt […]
- When Faith Meets Farming: Mark Yeazel’s Amazing Journey from Holstein Breeder to Tanzanian Dairy MissionaryFrom elite Holstein breeder to Tanzanian missionary: How Mark Yeazel trades show rings for orphan care through dairy farming. E228 When Faith Meets Farming: Mar […]
- BLACK HIDE BLINDNESS: Why Breeding Only for Color is Destroying Your Dairy-Beef ProfitsBlack hide obsession is costing you thousands. Those cheap Angus straws? Economic suicide. Discover why color alone won't save your beef-on-dairy profits. E227 […]


- Revolutionary Colostrum Protocol Adding $500 Per Heifer to Your Bottom Line
-

- 2024 Holstein Canada Master Breeders: Excellence in Balance, Breeding, and Legacy
-

- Dad at 80: How Murray Hunt Revolutionized Canadian Dairy Genetics
-
- When Faith Meets Farming: Mark Yeazel's Amazing Journey from Holstein Breeder to Tanzanian Dairy Missionary
-
- BLACK HIDE BLINDNESS: Why Breeding Only for Color is Destroying Your Dairy-Beef Profits
-
- Stud Wars: April 2025 - The Genetic Force Awakens
-
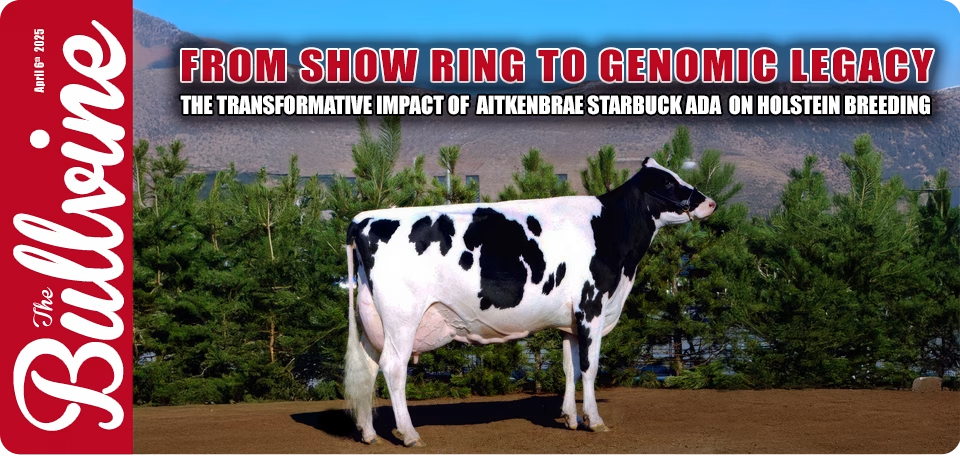
- From Show Ring to Genomic Legacy: The Transformative Impact of Aitkenbrae Starbuck Ada on Holstein Breeding
-
- Spring Pasture Powerplay: Balancing Grazing Efficiency with Milk Component Goals
-
- Unlocking Dairy Robot Financing: How Smart Farmers Are Funding Their Automated Future
-
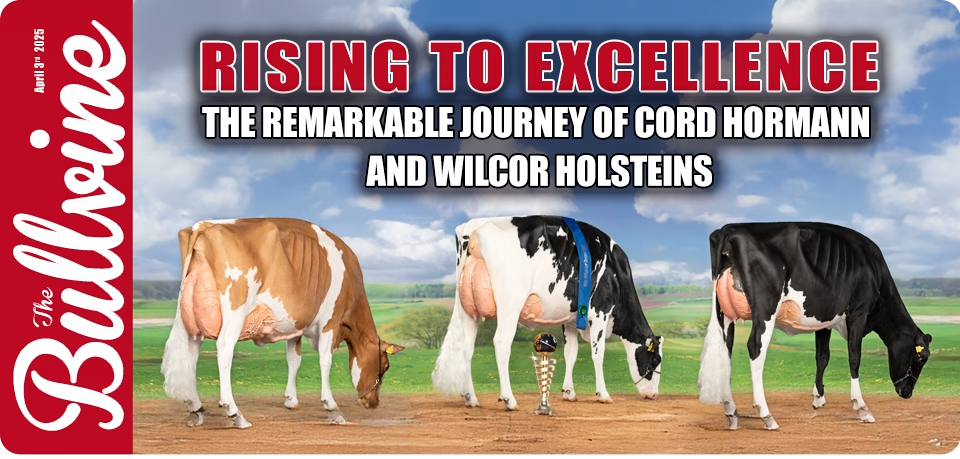
- Rising to Excellence: The Remarkable Journey of Cord Hormann and Wilcor Holsteins
-


Tanbark Trail
- Northeast Spring National Holstein Show 2025March 31st, 2025 @ Hamburg, NY E217 Northeast Spring National Holstein Show 2025 | RSS.com The New York Spring Holstein Show, judged by Ryan Krohlow, showcased exceptional dairy cattle across multiple age divisions. The competition featured remarkabl […]
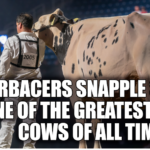
- Is Erbacers Snapple Shakira One of the Greatest Show Cows of All Time?Uncover why Erbacres Snapple Shakira stands among the top dairy show cows of all time. What makes her excel in the competitive dairy arena? E55 Is Erbacers Snapple Shakira One of the Greatest Show Cows of All Time? From the moment she steps into the […]
- The Royal Winter Fair 2024 – JerseyJudge Jeff Sales NTENSE JOEL DELPHIE ETGrand ChampionThe Royal - Jersey Show 2024WEEKSDALE/HI-CALIBER/ROCK ALLEN/F&D BORBA, BREADALBANE, PE c LEACHLAND VIDEO MOCHA K Intermediate Champion The Royal - Jersey Show 2024 WEEKSDALE HOLSTEINS, BRE […]
- The Royal Winter Fair 2024 – HolsteinJudge Blair Weeks JEFFREY-WAY HARD ROCK TWIGS Grand Champion The Royal - Holstein Show 2024 K. DOEBERIENER, L. BOWEN & PAT CONROY, R&F LIVESTOCK INC, & WALKER DAIRY INC. Grand Champion: Jeffrey-Way Hard Rock Twigs, 1st 4-year-old, K Doebe […]
- The Royal Winter Fair 2024 – Red & White HolsteinNovember 4th 2024 Judge: Markus Hehli, Rimbey, AB PREMIUM APPLE CRISP LILLY Grand Champion The Royal - Red & White Holstein Show BUTLERVIEW FARM, CHEBANSE, IL Grand Champion: Premium Apple Crisp Lilly (Apple-Crisp), 1st 5-year-old, Butlerview Far […]