Markets have been buzzing with activity, and you’re probably wondering what’s moving on the needle today. On Thursday, September 5, 2024, we saw interesting, steady-to-higher movements in CME cash dairy trading. It’s a sign that underlying shifts might need our attention. Let’s dive right into the numbers.
Dry Whey: Increased slightly by $0.0025 to hit $0.5675. Although no sales were recorded, this minor uptick is worth noting.
Forty-Pound Cheese Blocks: The price held steady at $2.23, with no sales recorded.
Cheese Barrels: Unchanged at $2.25, but we did see one sale at that price.
Butter: Increased by $0.0150, reaching $3.1625. Notably, three sales were recorded at prices ranging from $3.1625 to $3.17.
Nonfat Dry Milk: A modest uptick of $0.0025 brought the price to $1.3575. Two sales were recorded at prices close to this mark, $1.3575 and $1.36.
Class III and Cheese began lower Thursday morning, reflecting the previous day’s follow-through selling. Nearby futures fell 40-50 cents ahead of spot trade. While Wednesday’s spot stability dampened buyer interest, yesterday was different. Futures recovered from their lows, finishing just 10-20 cents down, thanks to an unaltered spot market. Remember that you must fuel a bull market, and spot stability might often be enough, given bullish fundamentals. Given previous USDA report shocks, market investors may also be positioning ahead of today’s July Dairy Product data. Class III futures traded well with over 2,600 contracts, with open interest increasing by 235 contracts. Cheese futures activity decreased, with 304 contracts traded, while open interest increased by 72 contracts.
Spot butter recorded its first advance in six days, up 1.5 cents on three deals. After 500 contracts were traded on Wednesday, barely 100 were transacted yesterday, mainly for September. Butter output is predicted to fall month after month and climb just 1.5% from last year, owing to potential milk diversions to cheese production. This will continue to boost these markets as we approach contract highs.
Spot nonfat increased marginally to a new high, while futures have stabilized over the past two days, decreasing by around 1-2 cents through Q2. Stable to weaker global markets are expected to have slowed the increase, but solid US fundamentals will keep nonfat prices high. As we trade near contract highs, end-users may feel under-hedged for 2025 and must decide whether to wait for a price drop or get coverage.
For the first week of September in the Upper Midwest, spot milk basis levels were consistent with the previous year. Labor Day brought fewer trading volumes. According to farmers and processors, recent warm weather has pressured milk production. School districts are in full gear, resulting in increased Class I demand. Despite the poor trade, several stakeholders reported no milk load proposals to the USDA, which was uncommon for a holiday week. Margin levels are usually favorable, signaling expansion to alleviate the limited milk supply, but there are few substitutes to fuel that increase.
Dairy cow slaughter in the United States remains low. For the week ending August 24th, the slaughter was a little over 50,000 head, down 12.91% from the previous year. Year-to-date slaughter is 14.40% lower than the prior year after 34 weeks. Over the last four weeks, dairy cow slaughter declined 14.04% year on year, the smallest margin in 14 weeks. Total beef slaughter is somewhat lower than a year ago, down 2.81%, as beef cows reclaimed some market share in the cattle market this week.
Daily CME Cash Dairy Product Prices ($/lb.)
Final
Change ¢/lb.
Trades
Bids
Offers
Butter
3.1625
1.5
3
3
1
Cheddar Block
2.23
NC
0
1
1
Cheddar Barrel
2.25
NC
1
0
0
NDM Grade A
1.3575
0.25
2
0
3
Dry Whey
0.5675
0.25
0
2
1
Weekly CME Cash Dairy Product Prices ($/lb.)
Tue
Wed
Thur
Current Avg.
Prior Week Avg.
Weekly Volume
Butter
3.1525
3.1475
3.1625
3.1542
3.182
16
Cheddar Block
2.215
2.23
2.23
2.225
2.128
2
Cheddar Barrel
2.26
2.25
2.25
2.2533
2.2115
3
NDM Grade A
1.3425
1.355
1.3575
1.3517
1.3115
10
Dry Whey
0.57
0.565
0.5675
0.5675
0.5605
2
CME Futures Settlement Prices
Tue
Wed
Thur
Class III (SEP) $/CWT.
22.54
22.6
22.83
Class IV (SEP) $/CWT.
22.51
22.38
22.7
Cheese (SEP) $/LB.
2.213
2.219
2.227
Blocks (SEP)$/LB.
2.135
2.135
2.217
Dry Whey (SEP) $/LB.
0.5328
0.5285
0.5558
NDM (SEP) $/LB.
1.2775
1.29
1.3275
Butter (SEP) $/LB.
3.165
3.17
3.1853
Corn (SEP) $/BU.
3.8525
3.9125
3.9
Corn (DEC) $/BU.
4.09
4.13
4.1075
Soybeans (SEP) $/BU.
9.96
1.005
9.995
Soybeans (NOV) $/BU.
1.015
1.0275
1.0225
Soybean Meal (SEP) $/TON
320
323.3
320.6
Soybean Meal (DEC) $/TON
321.1
328.6
326.9
Live Cattle (OCT) $/CWT.
179.53
179.18
177.13
Join the Revolution!
Bullvine Daily is your essential e-zine for staying ahead in the dairy industry. With over 30,000 subscribers, we bring you the week’s top news, helping you manage tasks efficiently. Stay informed about milk production, tech adoption, and more, so you can concentrate on your dairy operations.
Keep up with dairy farming trends: higher cheese prices, lower butter costs, and shifts in the global market. How will these changes affect your farm?
Summary: Are you keeping up with the ever-fluctuating dairy market? If you blink, you might miss a crucial change affecting your business. From recent USDA reports on wholesale dairy prices to global trends, we dive deep into what’s trending in the dairy industry. We’ll explore how weather conditions and herd management are influencing milk production. Plus, understand the impact of lower culling rates. The dairy market is experiencing fluctuations, with Cheddar cheese prices rising and butter prices falling. The USDA reports a rise in Cheddar cheese blocks by 0.48 cents per pound and 500-pound barrels by 3.38 cents per pound. NDM prices increased by 1.97 cents per pound and dry whey by 2.93 cents per pound. Export prices for most dairy products have fallen in Oceania and Western Europe. Milk production has varied, with New Zealand producing less due to unfavorable weather, while Australia and the E.U. increased output. U.S. dairy prices have generally been less competitive globally, but domestic Cheddar prices remain steady with international rates. Milk output for the top five exporters is forecasted to be 636.3 billion pounds in 2024, down by 1.4 billion pounds from last year.
USDA reports show an increase in wholesale prices for most dairy products from mid-July to early August.
Cheddar cheese prices rose by 0.48 cents for blocks and 3.38 cents for 500-pound barrels per pound.
NDM and dry whey prices increased by 1.97 and 2.93 cents per pound, respectively.
Butter prices experienced a decline of 3.03 cents per pound.
Spot prices for dairy products at the CME varied, highlighting the overall market fluctuation.
Internationally, Oceania and Western Europe saw declining export prices for most dairy commodities from June to July.
New Zealand’s milk production is projected to decrease due to adverse weather conditions, while Australia and the EU are anticipated to increase production.
US dairy exports declined in June relative to May, partially due to less competitive pricing.
The farm milk margin above feed costs improved in June, driven by lower feed prices and higher all-milk prices.
US butter has gained competitiveness in the international market, unlike other dairy products.
The all-milk price for 2024 is forecasted to be $22.30 per cwt, with a similar increase predicted for 2025.
As a dairy farmer, your knowledge of current market trends and pricing is your power. The recent rise in wholesale prices for Cheddar cheese blocks and barrels and the sharp fall in butter prices are significant shifts. Understanding these changes and how they affect your dairy business empowers you to navigate this pricing environment efficiently.
Keeping Tabs on Shifting Dairy Prices: How to Navigate the Landscape
Are you keeping up with the current market pricing for your dairy products? According to the most recent USDA National Dairy Products Sales Report (NDPSR), we’ve witnessed some intriguing trends. The price of 40-pound blocks of Cheddar cheese rose by 0.48 cents per pound, while 500-pound barrels increased by 3.38 cents per pound. Nonfat dry milk (NDM) prices rose by 1.97 cents per pound, with dry whey following closely after at 2.93 cents per pound. In contrast, butter prices fell by 3.03 cents per pound.
Spot prices on the Chicago Mercantile Exchange (CME) reflect a similar pattern. For the week ending August 9, 500-pound barrels of Cheddar cheese were $1.9470 per pound, while 40-pound blocks were $1.9220 per pound. Butter spot prices were $3.1010 per pound, NDM $1.2225 per pound, and dry whey $0.5865 per pound.
These pricing changes will indeed affect your company plans. However, they also present opportunities. Have you thought about how to deal with these market fluctuations and potentially turn them to your advantage?
Global Dairy Market Watch: The Rising and Falling Trends You Need to Know
Regarding the global dairy market, export prices for most dairy goods have fallen in Oceania and Western Europe. According to the USDA Dairy Market News (DMN), the declines varied from 0.1 cents per pound for dry whey in Western Europe to more considerable reductions of almost 4 cents per pound for skim milk powder in Oceania.
Milk production has varied among areas this year, presenting both challenges and opportunities. New Zealand has produced less milk than the previous year, possibly due to continued issues such as unfavorable weather conditions. In contrast, Australia and the European Union have reported increased milk output, demonstrating the industry’s resilience and adaptability.
Regarding competitiveness, U.S. dairy pricing has historically been less beneficial on a global scale. U.S. U.S. pricing for nonfat dry milk (NDM) and dry whey is much higher than that of Oceania and Western Europe. However, domestic Cheddar cheese costs have remained consistent with overseas equivalents. It is noteworthy that U.S. U.S. butter prices have grown more competitive, perhaps opening up new export opportunities.
Weather Woes and Herd Trends: What’s Impacting Your Milk Production?
According to the USDA National Agricultural Statistics Service (NASS) Milk Production report issued in July, the milking cow herd was assessed at 9.335 million in June, down 62,000 from June 2023 but up 2,000 from the previous month. This modest month-over-month increase may seem optimistic. Still, the more considerable year-over-year fall demonstrates a continued pattern of herd reduction.
In June, milk output per cow averaged 2,010 pounds, representing a 0.3 percent decrease from the previous year. This decline is primarily due to hot weather, which has a direct influence on cow comfort and, as a result, output. Elevated temperatures cause more heat stress, which may dramatically reduce milk yield.
Overall, June milk production fell by 1 percent compared to 2023. This drop results from a smaller milking herd, lower milk output per cow, and higher heat stress. Furthermore, overall milk output per day has decreased by around 0.90 percent year to date compared to the first half of 2023.
Interestingly, milk fat production has increased by 1.7 percent despite lower total milk output. This is attributable, in part, to a 2.2% increase in the average fat test, which indicates more excellent milk fat contents per cow. The tendency toward increased fat, protein, and other solids (such as lactose and minerals) implies that less milk is needed to produce dairy products.
Several causes have influenced these developments. On the one hand, favorable feed prices encourage farmers to keep older cows in the productive cycle for extended periods, reducing culling rates. On the other side, feed costs influence economic margins, as shown by the Dairy Margin Coverage (DMC) program. In June, the farm milk margin over feed expenses was $11.66 per hundredweight (cwt). This amount was $8.01, more significant than June 2023 due to decreased feed costs and higher all-milk pricing.
Striking a Balance: Understanding the Fluctuations in Dairy Trade
In June, dairy exports were 1,027 million pounds on a milk-fat milk-equivalent basis, a 39 million-pound decrease from May but an increase of 133 million pounds over June 2023. On a skim-solids milk-equivalent basis, June exports were 4,114 million pounds, 31 million less than May and 110 million less than June 2023. Exports of American cheese, other-than-American cheese, and dry whey fell in June compared to May. In the second quarter, milk-fat milk-equivalent exports reached 3,125 million pounds, up 12.5% from the previous quarter and 16.6% year on year. Exports in the second quarter were 12,412 million pounds on a skim-solids milk-equivalent basis, up slightly from the first quarter but down 3.3 percent from the previous year.
The import statistics for June were likewise remarkable. In June, imports reached 713 million pounds on a milk-fat basis, 51 million less than in May but 243 million more than in June 2023. On a skim-solids basis, June imports were 562 million pounds, 28 million more than May and 78 million more than June 2023. According to quarterly statistics, second-quarter imports were 2,228 million pounds on a milk-fat milk-equivalent basis, up 11.6 percent from the first quarter and an astonishing 27.2 percent higher than the previous year. Second-quarter imports were 1,719 million pounds on a skim-solids basis, up 3.0 percent from the first quarter and 23.8 percent from the prior year’s second quarter.
What is causing these trends? Price competition is significant. The absence of a pricing advantage for U.S. dairy products in overseas markets has resulted in lower export quantities. Furthermore, recent statistics show robust domestic demand, which decreases exports. Simultaneously, growing imports reflect the strong demand for dairy in the United States, where higher predicted costs drive purchasers to explore outside domestic boundaries. Finally, better macroeconomic circumstances in major overseas markets such as South Korea, Mexico, and the Philippines provide a favorable environment for a possible resurgence in U.S. exports if pricing competitiveness improves.
Deciphering Domestic Dynamics: Consumption and Stock Insights for Q2 2024
The dairy market in the United States is undergoing subtle shifts in domestic consumption. Domestic milk-fat consumption was somewhat lower in the second quarter of 2024 than at the same time in 2023, although skim-solids consumption increased slightly. Other-than-American cheese, butter, and dry whey consumption increased. In contrast, American-type cheese and dry skim milk products declined in popularity.
Ending stocks provides an insight into the supply side. As of June, ending milk-fat stockpiles were down 566 million pounds from the previous year, totaling 17,933 million. On a skim-solids basis, stockpiles were at 10,966 million pounds, 1,433 million pounds lower than in June 2023. While supply levels for other essential dairy products fell year on year, butter remained higher.
Several things affect these dynamics. Milk output fluctuates significantly according to herd size and yield per cow. Market circumstances such as foreign demand and export competitiveness directly influence local consumption and stock levels. Lower culling rates indicate that farmers are keeping cows longer, which impacts both output and stock trends along with higher milk margins.
Shaping the Future: Global Dairy Production Projections for 2024
On July 23, the USDA Foreign Agricultural Service (FAS) released its biennial study Dairy: World Markets and Trade, which provides a detailed analysis of worldwide trade, production, consumption, and stock levels. Updating this analysis with the most recent August 12 World Agricultural Supply and Use Demand Estimates, the FAS forecasts that milk output for the top five significant exporters will reach 636.3 billion pounds in 2024, a 1.4 billion-pound decrease from the previous year.
Several key factors are influencing these projections:
Australia: Favorable weather conditions, greater pasture availability, and a stable macroeconomic environment are expected to raise milk output by 0.7 billion pounds.
European Union (E.U.): Despite a shrinking dairy herd, small gains in milk per cow are expected to boost output by 0.2 billion pounds. However, weak economic margins and onerous environmental laws are persistent concerns.
New Zealand: Milk output is predicted to decrease by 0.2 billion pounds owing to a reduced dairy herd and severe meteorological conditions, including the current El Niño impacts.
Argentina: Argentina’s dairy business has lost 2 billion pounds due to high inflation rates and a falling peso, contributing to lower dairy margins and herd levels.
These elements, from regional weather to more significant economic settings, impact the global dairy scene as we approach 2024.
Avian Influenza Alert: Navigating the 2024 HPAI Impact on Dairy Herds
As of August 14, HPAI has been verified in 13 states and 191 dairy herds, with the majority of new detections occurring in Colorado. The USDA enforces severe testing regulations for nursing dairy cows before interstate travel and requires the reporting of positive influenza A test findings in animals.
The USDA and its partner organizations provide assistance programs for dairy herd farmers afflicted by HPAI. These initiatives offer financial help, advice on biosecurity measures, and resources for efficient epidemic management. For further information, see the USDA Animal and Plant Health Inspection Service website, which provides updates on HPAI detections in animals.
The Bottom Line
The dairy market continuously changes, with fluctuating pricing and altering worldwide trends. As previously stated, although other U.S. dairy product costs have risen, the cost of butter has significantly decreased. On the international front, prices for numerous dairy goods have decreased in Oceania and Western Europe. Domestically, production problems such as hot weather and a smaller milking herd have reduced yields despite improved milk fat production. Milk production in important locations is expected to expand at varying rates, with environmental restrictions and economic variables potentially influencing output levels further.
Keeping an eye on these market trends is critical. Staying educated enables you to make intelligent choices regarding herd management, feed purchasing, and general operations that enhance profitability. As we go ahead, examine how these trends may affect your practice. Whether adjusting to changing market circumstances or improving production tactics, being proactive can help you effectively manage the dairy industry’s intricacies.
The Chicago Mercantile Exchange (CME) kicked off the week with several essential dairy commodities rising and wondering what’s trending higher and how it might impact your operation. Let’s dive into the specifics.
Mon
Tue
Wed
Thur
Fri
Current Avg.
Prior Week Avg.
Weekly Volume
Butter
3.1750
–
–
–
–
3.1750
3.1590
3
Cheddar Block
2.1400
–
–
–
–
2.1400
2.0820
7
Cheddar Barrel
2.2500
–
–
–
–
2.2500
2.2250
1
NDM Grade A
1.2975
–
–
–
–
1.2975
1.2790
14
Dry Whey
0.5650
–
–
–
–
0.5650
0.5610
0
Firstly, dry whey stayed steady at $0.5650. Stability is always a relief. Now, onto the changes. Cheese blocks saw a modest rise of $0.01025, bringing the price to $2.14 per pound across seven sales. Cheddar barrels significantly jumped, going up $0.15 to hit $2.25 with a single trade at that price, largely thanks to USDA’s bullish Cold Storage report. Blocks shot up $0.1025 to reach $2.1400 per pound, the highest price since January 2023.
Butter climbed by $0.0450 to $3.1750, with three sales ranging from $3.16 to $3.18.
Nonfat dry milk increased by $0.0150, now at $1.2975 after fourteen sales in the range of $1.29 to $1.2975.
How will this week’s dairy price surge impact your farm? Are you ready for changes in milk futures and crop conditions? Keep reading to stay informed.
Summary: The dairy market saw steady to higher cash prices on the Chicago Mercantile Exchange (CME) with butter and nonfat dry milk seeing minor increases while cheese prices stayed steady. The September Class III futures contract rose by 39 cents to $22.30 per hundredweight, and crop conditions for corn and soybeans remain favorable, holding above the five-year average. Despite these improvements, margins for dairy farms remain tight. Regular updates on market conditions and industry developments are crucial for farmers to stay informed. The CME reported a significant increase in milk futures and cash dairy prices, with butter prices hitting a new year-to-date high. These changes affect profit margins and strategic planning for dairy farmers, highlighting the importance of capitalizing on opportunities and navigating risks to stay profitable.
Cash dairy prices were generally higher on the CME, with notable increases in butter and nonfat dry milk prices.
September Class III futures contract saw a significant rise, reaching $22.30 per hundredweight.
Crop conditions for corn and soybeans remain favorable, well above the five-year average.
Despite market improvements, dairy farmers continue to face tight margins.
Strategic planning and regular updates on market conditions are essential for navigating risks and capitalizing on opportunities.
Butter prices hit a new year-to-date high, reflecting positive market momentum.
The Chicago Mercantile Exchange (CME) showed a significant increase in milk futures, and cash dairy prices also witnessed strong action to begin the week, with butter prices reaching a new year-to-date high. Consider what these implications are for your profit margins and strategic planning! The September Class III futures contract climbed 39 cents to $22.30 per hundredweight. Dry whey remained stable at $0.55, forty-pound cheese blocks at $2.10, cheese barrels at $2.2550, butter at $3.1850, and nonfat dry milk at $1.2650. With concerns about higher crop conditions adding another layer to the market environment, staying current is more critical than ever. Staying educated isn’t only good for dairy farmers; it’s also necessary for success in a competitive market.
Bullish Butter and Nonfat Dry Milk: Market Trends You Can’t Ignore
Dry Whey: Prices held steady at $0.55 with no market activity recorded, indicating stability in this segment.
Cheese Blocks: Remained unchanged at $2.10. This lack of movement highlights a period of price stability. No transactions were reported, signifying a balanced supply and demand.
Cheese Barrels: They are similarly stable, maintaining their price at $2.2550. The absence of sales confirms market equilibrium.
Butter: Saw a modest increase of $0.0050, reaching $3.1850, with six transactions recorded between $3.1850 and $3.2025. This rise sets a new year-to-date high, showing a promising trend.
Nonfat Dry Milk (NDM): Prices rose by $0.01 to $1.2650, with three sales reported, ranging from $1.26 to $1.2650. This minor uptick also represents a new year-to-date high, reflecting growing demand.
It is worth noting that both butter and NDM have reached their top prices for the year, indicating critical market trends for both products. Market players should keep a careful eye on these developments since they might signify more significant swings in supply and demand.
For more context on the dairy market trends, you can explore our detailed US Dairy Farmers’ Revenue and Expenditure Rise Slightly in March and stay updated with the latest Big Milk Checks and Low Feed Costs stories.
The Ripple Effect of Recent Market Movements on Dairy Farming
The recent market movements have significant implications for dairy farmers. Let’s break down the potential benefits and challenges:
Increased Revenue: With butter and nonfat dry milk reaching new year-to-date highs, farmers can capitalize on higher market prices.
Stable Cheese Prices: While cheese prices have remained unchanged, stability can provide a predictable source of income for those heavily invested in cheese production.
Higher Class III Futures: The rise in Class III futures suggests an optimistic outlook for milk prices, potentially leading to better contract deals for farmers.
Managing Costs: As market prices rise, feed and other inputs may also increase. Effective cost management becomes crucial to maintaining profitability.
Export Opportunities: With cheese exports up by 20.5% from the previous year, there’s potential to explore international markets, enhancing revenue streams.
Crop Conditions: Favorable crop conditions for corn and soybeans could mean more affordable feed options, positively impacting profit margins.
Market Volatility: Despite the current highs, market volatility is a constant challenge. Farmers need to stay informed and possibly use hedging strategies to mitigate risks.
Reduced Herd Sizes: The reduction in the U.S. dairy herd could lead to less competition in the market but may also reflect broader economic pressures on farmers.
Ultimately, these market trends offer both opportunities and challenges. Staying agile and informed will be vital to navigating this dynamic landscape.
The Bottom Line
Recent changes in dairy pricing, notably for butter and nonfat dry milk, indicate crucial adjustments that may affect your bottom line. While spot market activity remained reasonably consistent, the rise in Class III futures and strong crop conditions highlight the importance of caution. As margins remain tight despite increased milk prices and lower feed costs, market dynamics provide both possibilities and problems.
Consider how these movements will impact your agriculture. Proactively monitoring your price strategy and keeping up with market variations may make a significant impact. Mechanisms such as dairy futures and options may help limit price volatility, although their applicability will vary based on your unique business.
It’s crucial not to navigate these market changes alone. Keep abreast of the latest market news and engage with industry professionals to develop plans that align with your farm’s objectives. Your next steps could be the key to success in this dynamic industry. Stay informed, stay active, and seize the opportunities that come your way.
The risk of loss in trading commodity futures and options is significant. Investors must evaluate these risks considering their financial situation. While the information is deemed reliable, it has not been independently verified. The views expressed are solely those of the author and do not necessarily reflect those of The Bullvine. This content is meant for solicitation purposes. Remember, past performance doesn’t guarantee future results.
Find out how rising dairy prices affect your farm and what you can do to stay ahead. Are you ready for the market changes? Read more now.
Summary: The dairy market is experiencing a whirlwind of changes this summer, with significant fluctuations in butter, cheese, and milk production across the United States. Tight spot cream supplies in the East and Central regions contrast with steady churning in the West, while cheese production faces regional disparities due to varying milk availability. Fluid milk volumes are dipping across much of the country, influenced by high temperatures, although the Pacific Northwest remains an exception. As milk production forecasts for 2024 and 2025 are lowered, dairy farmers are navigating a complex landscape marked by supply limitations and shifting demands. International dynamics further add to the complexity, with changing production patterns in Europe, Australia, and South America influencing global dairy prices. Dairy costs have reached record levels, affecting farmers and producers. Factors driving these prices include fluctuations in milk output and increased demand in global markets. Butter prices have remained stable, while cheese prices have varied. Nonfat dry milk has decreased slightly, but dry whey has maintained a mixed trend. Grade AA butter closed around $3.1800 in mid-August, with a weekly average approaching $3.1410. Declining cream supplies in the East and Central areas have made churning rare, while the West remains active. Cheese demand is constantly in flux, with milk supplies tightening as schools stock up. Retail cheese demand is increasing, providing vitality to the market. Grade A NDM and dried whey have remained slightly lower than the weekly average, leading to constrained supply and surging demand. The Pacific Northwest has moderate temperatures, while dry dairy products are making waves due to their complex supply and demand dynamics. International markets significantly impact U.S. dairy pricing, with hot weather worsening the seasonal decline in milk output in Europe.
Tight spot cream supplies in the East and Central regions, with steady churning in the West.
Cheese production faces regional disparities due to varying milk availability.
Fluid milk volumes are dipping across much of the U.S., except in the Pacific Northwest, influenced by high temperatures.
Milk production forecasts for 2024 and 2025 have been lowered, impacting dairy farmers.
International dynamics, including production patterns in Europe, Australia, and South America, influence global dairy prices.
Dairy costs have reached record levels due to fluctuations in milk output and global demand.
Butter prices remain stable, while cheese prices show regional variations.
Nonfat dry milk prices have slightly decreased, and dry whey prices show mixed trends.
Increasing retail cheese demand suggests a strengthening market.
Moderate temperatures in the Pacific Northwest are aiding milk production stability.
International hot weather conditions are worsening the seasonal decline in milk output in Europe.
Have you ever wondered why your grocery store’s dairy section has become more expensive recently? It’s not just inflation; dairy costs are skyrocketing at record levels. These fluctuating market movements may have a significant impact on farmers. Staying educated is more than just a good idea; it’s essential for managing this ever-changing world. Understanding the mechanics behind these pricing changes might make the difference between prospering and barely scraping by. Several reasons are driving these growing prices, including fluctuations in milk output and increased demand in worldwide markets. Butter prices have remained stable over the previous week, whereas cheese prices have varied. Nonfat dry milk has decreased somewhat, although dry whey has maintained a mixed trend. These little adjustments have a significant effect on dairy producers like you. By the end, you’ll better understand why keeping ahead of market trends is not just advantageous, but necessary for proactive decision-making.
Product
Latest Closing Price
Weekly Average Price
Price Change (+/-)
Butter (Grade AA)
$3.1800
$3.1410
+0.0400
Cheese (Barrels)
$2.2550
$2.1840
+0.2370
Cheese (40# Blocks)
$2.1000
$2.0495
+0.1275
Nonfat Dry Milk (Grade A)
$1.2550
$1.2380
-0.0155
Dry Whey (Extra Grade)
$0.5500
$0.5590
-0.0275
Wondering How the Dairy Market is Faring This Summer? Let’s Break It Down.
How was the dairy market doing this summer? Let us break it down. First, let’s discuss butter. As of mid-August, Grade AA butter closed around $3.1800, with a weekly average approaching $3.1410. “Why the uptick?” you may wonder. Declining cream supplies in the East and Central areas have made churning rare, while the West remains active.
Cheese is now the subject of an ongoing drama. Barrel cheese closed at $2.2550, while 40-pound chunks sold for $2.1000. Weekly averages rose significantly, with barrels at $2.1840 and blocks at $2.0495. Cheese demand is constantly in flux: milk supplies are tightening, mainly as schools stock up, making Class I requirements a top priority. But guess what? Retail cheese demand is increasing, providing vitality to the market.
What about nonfat dry milk (NDM) and dried whey? Grade A NDM finished at $1.2550, slightly lower than the weekly average of $1.2380. Dry whey concluded at $0.5500, with the weekly average dropping to $0.5590. The story here is one of scarcity—whether condensed skim or whey, everyone feels the squeeze.
The primary result is that constrained supply and surging demand are paving the way for a volatile market. As a dairy producer, it’s crucial to monitor these market trends and navigate these developments. This vigilance will help you understand the market’s future direction and make informed decisions. Will these tendencies remain consistent? Only time will tell, but your proactive monitoring will keep you ahead of the curve.
What’s Going On with the Butter Market? Spoiler: It’s Quite the Roller Coaster!
Are you aware that the butter market is seeing exciting changes this summer? Let’s get into it. Butter production has reached a seasonal low, which is unsurprising given the time of year. Limited spot cream supplies have hampered churning schedules in the East and Central areas. However, the West has a different narrative. Despite the seasonal fall, butter output in this area remains steady. This geographical disparity represents a fragmented market in which location influences manufacturing tendencies.
As the autumn season approaches, butter demand is expected to rise. Customers begin to reserve their quantities to get ahead of the seasonal rush. It’s that time when everyone prepares for Christmas baking and festive feasts. Don’t remember that consumers purchase 3-5% more butter in the autumn than in summer [Bureau of Labor Statistics]. This increase in demand has a positive impact on butter prices in the latter half of the year. This anticipation of increased demand should make you feel prepared and ready to capitalize on the market.
What does this imply for pricing? The butter market is stable, but those positive factors could impact prices as the autumn season unfolds. This is especially important for dairy producers and dealers seeking to capitalize on market circumstances. In summary, although supply may be at a seasonal low, demand is increasing. This dynamic will substantially influence butter prices as the year ends.
Let’s Talk Cheese: What’s Driving This Market’s Steady Climb?
Let’s discuss cheese. Have you observed how the cheese market has recently been stable with a modest upward tendency? There are a few main variables influencing this. One of the most potent influences is milk supply. Cheesemakers suffer when milk quantities tighten, as they have recently, particularly in the East. Limited milk implies fewer raw materials for manufacturing, resulting in a rippling impact on supply and pricing.
But it isn’t just about the milk. Regional demand is also an important consideration. Food service demand has been consistent, but retail demand is where things become interesting. Consider this: with schools resuming, there is an increase in demand for cheese. Why? Educational institutions are large consumers of dairy products, and their buying activity increases when the academic year begins. This increase in demand strengthens the market and helps to keep cheese prices firm.
The limited spot milk supply in the central area is projected to keep prices above Class III until around Labor Day. Meanwhile, farmers in the West feel the strain but seem to have enough milk to keep the wheels going. Inventory levels vary per company, but the overall message is cautious optimism. As we approach the autumn season, combining milk supply and increased school demand may pave the way for the next phase of cheese market dynamics. The resilience and determination of farmers in the face of supply constraints should inspire and motivate you in your own operations.
What’s the Real Story Behind Fluid Milk Production This Summer? It’s a Tale of Regional Contrasts
What is the true story behind fluid milk production this summer? It’s a story of regional disparities caused by temperature fluctuations and varying seasonal needs. Dairies throughout the United States report lower milk output as the summer heat takes its toll. Temperatures in the highland and southern desert regions reach triple digits, putting cow comfort at risk and decreasing milk output.
However, the Pacific Northwest is a significant exception. Here, moderate temperatures—peaking in the 70s during the day and dropping to the 50s at night—have helped to keep milk quantities stable. This geographical heterogeneity is essential in influencing our overall fluid milk trends.
Seasonal changes play a significant role in the dairy market. With the back-to-school season approaching, there is an increased demand for Class I, notably fluid milk products. This demand prompts milk to migrate within areas to fulfill local demands, resulting in restricted supply and higher spot market prices. For example, spot milk prices reached $3.50 over Class, up $1.00 from the previous week. Understanding and anticipating these seasonal shifts can help you prepare and adapt your business strategies accordingly.
While some areas see a seasonal fall in milk production, others maintain their levels. This intricate interaction of environment and seasonal demand affects the fluid milk market, keeping dairy producers on their toes. As we look forward to the following months, we should evaluate how these regional and seasonal elements will continue to impact milk quantities and pricing, posing difficulties and possibilities for individuals in the dairy business.
Why Are Dry Dairy Products Making Waves in the Market? Let’s Get Into It.
As we concentrate on dry dairy products, the landscape for commodities such as nonfat dry milk, dry buttermilk, and dry whey shows a complex narrative of supply and demand dynamics influencing pricing and availability. Nonfat dry milk (NDM) costs, for example, have stabilized somewhat while rising in some places. This variation corresponds to the lower availability of condensed skim, which tends to fall with seasonal milk production. Less milk means less opportunity to create NDM, pushing prices upward.
Dry buttermilk is a mixed bag: inventories are available but not growing, indicating a balanced market without oversupply. The supply limitations are less severe than in NDM, but they are strong enough to prevent prices from decreasing. End users should expect pricing to be steady or higher, depending on their geographical market.
Then, we have dry whey, which highlights the market’s intricacies. Prices have fluctuated across areas, mainly due to the limited supply of selected labeled whey, keeping the market somewhat positive. The selective scarcity adds an element of uncertainty, causing companies that manufacture higher-protein concentrates to prefer whey protein concentrate markets.
Overall, it is evident that, although supplies of these dry items remain constant in certain circumstances, they are tightening in others. This equilibrium, or lack thereof, profoundly influences market circumstances and price structures. Supply chain coordination and strategic procurement planning become more critical as processors and end users negotiate these challenges.
Global Dairy Dynamics: How International Markets Shape U.S. Dairy Prices
International markets substantially impact U.S. dairy pricing since different areas confront distinct difficulties and possibilities. Hot weather has worsened the seasonal decline in milk output in Europe, notably in Western countries such as France, Germany, and the Netherlands, resulting in lower milk yields and reduced availability of dairy products. This has added uncertainty to the market, raising farm gate milk and cream prices and impacting global trade dynamics.
Meanwhile, in Eastern Europe, the picture is more upbeat. Countries such as Belarus are increasing milk output. According to USDA and CLAL statistics, Belarus witnessed a 3.7% rise in milk output in June 2024 compared to the prior year. This localized expansion helps to offset shortages elsewhere and contributes to the more excellent worldwide supply chain.
Oceania’s story is a mixed bag. Australia’s dairy exports have fallen 23.5 percent from the previous year owing to weather-related challenges and a tight feed market. Despite this, estimates for ordinary to above-average rainfall indicate some respite in the next season. In contrast, during recent trading events, New Zealand’s anticipated milk price for the 2024/2025 season has increased, partly due to a higher index price for whole milk powder. This surge is anticipated to keep global dairy prices up.
South American dairy farmers have benefited from neutral weather trends. Countries such as Brazil and Uruguay indicate good circumstances that should sustain continuous milk production. Cow comfort and pasture quality have been constant and favorable, ensuring a consistent supply of dairy products.
These worldwide dynamics influence supply and demand in the United States market. Reduced output in crucial regions such as Western Europe and Oceania may require more imports to meet local needs, thus raising costs. On the other hand, increased production in Eastern Europe and South America may help stabilize world supply, reducing dramatic price volatility. It’s a delicate balance that American dairy producers must strike, with worldwide trends constantly changing the landscape.
Have You Noticed More Dairy Ads Lately? You’re Not Imagining Things.
Have you seen an increase in dairy advertising recently? You are not imagining things. According to recent studies, retail advertising totals have increased significantly. Conventional ad numbers are up 5%, but organic ads have increased by 52%. That’s quite a bump! Traditional ice cream in 48-to-64-ounce containers has been the most marketed item, with typical cheese in six-to-eight-ounce pieces following closely after. Even in the organic section, half-gallon milk remains popular.
So, what does this imply for you, the dairy farmer? These retail trends are more than simply statistics; they reflect customer desire. When marketing for dairy products rises, it usually indicates high customer interest. And increased customer interest generally results in higher costs. For example, the Bureau of Labor Statistics reported a 2.2% increase in the July Consumer Price Index (CPI) for total food, while dairy goods showed mixed patterns, including a 1.3% increase in fresh whole milk and a significant 6.1% increase in butter.
Now, let’s connect the dots. As demand rises, farmers must plan for both possibilities and problems. Higher retail pricing often results in more significant profit margins for manufacturers. However, it is a double-edged sword; increasing demand for feed and other resources may result in higher production costs. Furthermore, the pressure to maintain high-quality output will increase as prices rise.
Be watchful and adaptive. Monitor consumer trends and store ads. They provide crucial information on the market’s direction. Altering your strategy proactively may help you capitalize on these developments, ensuring that your efforts pay off now and in the future.
Supply and Demand Shifts: How Will Lowered Milk Production Forecasts Impact You?
As we examine the most recent supply and demand projections for the dairy market, it is clear that the picture is changing dramatically. The World Agricultural Outlook Board’s (WAOB) August Supply and Demand Estimates show that milk production predictions for 2024 and 2025 have been reduced. This change is based on the most current statistics, which show a fall in cow inventories and reduced production per cow for both years.
How does this affect dairy farmers? Lower milk production predictions inevitably result in tighter supply. In dairy economics, tighter supply often puts upward pressure on pricing. The predicted decrease in milk production coincides with the expected price rise for different dairy products. The price estimates for cheese, nonfat dry milk (NDM), and whey have been increased in response to recent price gains. The all-milk price is expected to climb to $22.30 per cwt in 2024 and $22.75 per cwt in 2025.
Butter, however, offers a somewhat different narrative. Despite decreasing milk output, the butter price projection 2024 has been revised downward. This might be due to altering market dynamics or current inventory levels that are adequate to fulfill demand. However, the lower milk supply for other goods, such as cheese and whey, is expected to sustain further price hikes.
Despite decreasing output, robust local and international demand for dairy is predicted to stabilize prices. Dairy producers should optimize their processes to capitalize on increased pricing while controlling decreasing milk yield.
The Bottom Line
The dairy industry is active and diverse, with butter production balancing seasonal lows with anticipated demand and cheesemakers dealing with limited milk sources and unpredictable stocks. Temperatures impact regional variations in fluid milk production. In contrast, dry dairy product pricing varies due to restricted milk supply and altering seasonal demand. International market patterns influence U.S. pricing, emphasizing the need for monitoring and agility. Are you using all available data and insights to improve your operations and keep ahead of these changes?
Discover the reasons behind the surge in US cheese prices and how dairy farmers can proactively maintain their global competitiveness. Understanding these dynamics is crucial for the future of your business.
Summary: Understanding pricing specifics in various regions is crucial in the highly competitive global dairy market. US cheese prices are almost on par with New Zealand but lag behind Europe, while butter prices significantly spread across regions. However, the US faces more challenges with higher NDM/SMP and dry whey prices than New Zealand and Europe. These price differences reflect where American dairy farmers might need to adjust strategies to maintain a competitive edge.
Spot cheese prices rose: blocks at $1.9650/lb and barrels at $1.9500/lb.
Dry whey and NDM saw minimal drops, while butter prices stayed stable at $3.1025/lb.
Class III futures rebounded: September futures at $20.80 per cwt, Q4 at $20.58.
US cheese is marginally cheaper than New Zealand’s but less competitive than Europe’s.
Butter prices show a wider spread: New Zealand’s cheapest at $2.87/lb, US at $3.10/lb, EU at $3.46/lb.
The US is less competitive in NDM/SMP and dry whey than New Zealand and Europe.
NDM/SMP in the US at $1.23/lb versus New Zealand’s $1.12/lb and Europe’s $1.18/lb.
Dry whey prices: US at $0.60/lb compared to $0.46/lb in New Zealand and $0.32/lb in Europe.
Have you been following the latest developments in the dairy industry? The recent spike in spot cheese prices has sparked discussions among dairy producers. Spot blocks now command $1.9650 a pound, a 6.5-cent increase. Barrels are not far behind, climbing four cents to $1.9500 per pound. While other changes in the dairy market were less pronounced, spot dry whey dipped marginally to $0.5900 per pound and nonfat dry milk (NDM) to $1.2300 per pound.
Why is this significant? The surge in spot cheese pricing, especially if you’re considering Class III contracts, is a game-changer. September futures are now at $20.80 per hundredweight, up 56 cents. Even Q4 futures have risen, closing at $20.58. In simple terms, these figures could have a direct impact on your financial performance.
A recently released analysis states, “In the global marketplace, US cheese at $1.93 per pound is just barely below New Zealand’s $1.94.”This shows that the price difference is shrinking, which might influence competition.
But how does the United States compare globally? Here’s a basic overview:
Cheese costs $1.93 per pound in the United States, $1.94 per pound in New Zealand, and $2.16 per pound in Europe.
Butter costs $3.10 per pound in the United States, $2.87 per pound in New Zealand, and $3.46 per pound in Europe.
NDM/SMP: $1.23/lb in the United States; $1.12/lb in New Zealand; $1.18/lb in Europe.
Dry whey costs $0.60 per pound in the United States, $0.46 per pound in New Zealand, and $0.32 per pound in Europe. While the United States remains competitive in the cheese and butter industries, NDM/SMP and dry whey face increased competition. The figures indicate where opportunities and problems exist; knowing them is critical for strategic planning.
To start the week at the CME trade in Chicago, prices are a mix of steady and slightly lower. But let’s break it down together.
First, dry whey didn’t make any waves—it stayed put at $0.61, with no sales on record. Cheese blocks took a tiny dip, down by $0.01 to sit at $1.84, though one sale was recorded at $1.85. Cheese barrels followed suit, going down $0.02 to $1.91, and like dry whey, no sales were reported.
Butter held its ground, unchanged at $3.1050, with no sales. However, the nonfat dry milk market saw a small slip, dropping $0.0075 to $1.2350, with two sales recorded at $1.2325 and $1.2350.
That sounds like a lot of numbers, right? However, keeping an eye on these details can make all the difference in the dairy business.
Discover how U.S. dairy producers are handling high costs even with rising prices and strong demand in 2024. Can new solutions keep the industry going?
Despite the challenges of a dynamic 2024 marked by rising costs, the U.S. dairy industry continues to demonstrate its unwavering resilience. The industry is on a positive trajectory with solid demand and promising price forecasts. The latest World Agricultural Supply and Demand Estimates report from the USDA projects the average all-milk price at $21.60 per hundredweight nationally, an improvement from last year. Essential products like Cheddar cheese, dry whey, and butter are expected to increase in price, with imports and exports projected to rise compared to 2023, indicating the industry’s steadfastness.
Global Demand Surge and Rising Prices: A Crucial Juncture for the U.S. Dairy Industry in 2024
Global Demand Surge and Price Increases Position the U.S. Dairy Industry at a Crucial Juncture in 2024, when the industry is experiencing a significant increase in global demand and rising prices. As 2024 begins, the U.S. dairy industry finds itself at a crucial juncture of solid demand and rising prices at home and abroad. The latest World Agricultural Supply and Demand Estimates report from the USDA shows domestic consumer preferences increasingly favor dairy, while middle-class growth in emerging economies boosts global demand. As a result, the average all-milk price is projected to increase to $21.60 per hundredweight, improving over last year.
The USDA also notes that crucial dairy products like Cheddar cheese, dry whey, and butter are expected to see price hikes, with significant growth in both imports and exports. This robust global appetite for U.S. dairy secures the nation’s position in the international dairy market. It opens up new trade and market expansion opportunities, providing a positive outlook and reason for optimism.
The Resilient Rebound: Navigating Post-Peak Pricing Amid Economic Recovery and Rising Costs
The forecasted average all-milk price of $21.60 per hundredweight highlights the dairy sector’s recovery from recent economic disruptions, though it remains below the 2022 peak of $25 per hundredweight. Extraordinary market conditions, including a surge in global demand and supply chain issues, drove this peak. The current price stability at $21.60 indicates a return to sustainable yet profitable pricing. This pattern reflects ongoing recovery, allowing producers to tap into market opportunities despite higher input costs affecting overall profitability.
An agricultural economist with the Mississippi State University Extension Service, Josh Maples, highlights the potential for further price increases in essential dairy products. He notes, “Dairy prices have strengthened significantly this year and are anticipated to rise further.” This optimistic forecast, which includes higher prices for products like Cheddar cheese, dry whey, and butter, as well as increased imports and exports, presents a promising market for U.S. dairy farmers, instilling a strong sense of hope and optimism for the future.
Examining Financial Pressures: The Multi-Faceted Challenges of Rising Production Costs for Dairy Producers
Dairy producers are navigating a complex web of rising expenses that challenge their economic stability. The need for equipment upgrades to keep pace with technological advances, climbing insurance premiums, and significant labor costs in a competitive market contribute to financial pressure. This situation is further compounded by increasing interest rates on loans, which many dairy farms rely on to finance their operations.
These layered cost increases highlight the complexity of maintaining profitability in today’s dairy industry. Producers’ resilience and adaptability will be crucial in navigating these financial challenges.
Regional Decline: Economic Pressures Force Downsize and Exit Among Dairy Farms in Mississippi and the Southeast
The decline in milk production across the Southeast, especially in Mississippi, reflects a regional trend of decreasing dairy farms and shrinking herd sizes. Economic pressures , including high production costs, market fluctuations, and the impact of climate change, have forced many dairy farmers to exit the industry or downsize.
The Role of Innovation in Tackling Production Costs: Jessica Halfen’s Strategic Research in Dairy Cow Nutrition
Jessica Halfen, the new dairy specialist at MSU Extension, spearheads efforts to mitigate high production costs through innovative research. She focuses on enhancing dairy cow nutrition and health with cost-effective dietary additives and natural compounds. By providing alternative feed options, Halfen aims to lower feed costs while improving herd well-being, easing the financial strain on dairy producers.
Halfen’s work is vital, especially for Mississippi dairies, which face production declines owing to long, hot summers. Her exploration of alternative feed sources represents a proactive step toward ensuring the sustainability and profitability of the region’s dairy sector.
“The objective is to explore alternative feed sources and identify new compounds that can reduce feed costs and enhance the overall well-being of dairy cows,” Halfen asserted. This research offers farmers immediate financial relief and strengthens the long-term resilience of dairy operations amid ongoing challenges.
Jessica Halfen Embarks on Revolutionary Research: Transforming Dairy Cow Nutrition with Alternative Feed Sources and Natural Compounds
Dr. Jessica Halfen’s research focuses on two main goals: exploring alternative feed sources and identifying new, beneficial compounds for dairy cow nutrition. Halfen aims to reduce the significant feed costs that challenge dairy producers by studying non-traditional, cost-effective feed ingredients. This includes assessing the nutritional value, digestibility, and overall impact of these alternative feeds on milk production.
At the same time, Halfen is devoted to discovering natural compounds that could enhance the health and productivity of dairy cows. Her research focuses on improving gut health, boosting immunity, and potentially increasing milk yield without incurring significant additional costs. These compounds range from plant-based additives to innovative probiotics, which, once verified through intensive studies, could offer sustainable solutions for reducing dependence on costly, traditional feed options.
Through her dual focus on alternative feeds and nutritional innovations, Halfen aims to equip the dairy industry with practical, science-backed strategies to improve efficiency and animal welfare. Her research addresses dairy farms’ economic challenges and promotes a more sustainable and health-conscious approach to dairy farming.
Confronting Climate Challenges: Tackling Heat Stress in Mississippi’s Dairy Industry
Mississippi’s extended hot summers significantly impact dairy production by exacerbating cow heat stress. These conditions reduce milk yield, fertility, and overall herd health, causing a notable decline in productivity during peak summer months. Managing heat stress is vital for sustaining milk production, leading producers to adopt cooling strategies like fans, misters, and shade structures. These innovations lower ambient temperatures, relieve cows, and minimize production losses. Nutrition optimization, incorporating feed additives that help cows cope with heat stress, is gaining focus.
Research at Mississippi State University is also developing heat-tolerant feed formulations and management practices. Jessica Halfen’s research explores alternative feed sources and natural compounds to enhance cows’ resilience to high temperatures. These efforts are crucial for improving welfare and sustaining farm profitability despite challenging climatic conditions.
Health Concerns Amidst Growth: Monitoring Highly Pathogenic Avian Influenza in Dairy Herds
In addition to economic and environmental challenges, the U.S. dairy industry is closely monitoring the situation with Highly Pathogenic Avian Influenza (HPAI) detected in dairy herds in Texas and Kansas. Authorities ensure that the commercial milk supply remains safe due to stringent pasteurization processes and the destruction of milk from affected cows.
The Bottom Line
While the U.S. dairy industry enjoys strong domestic and global demand and rising prices, it faces persistent production costs that jeopardize profitability. This balance of opportunity and challenge characterizes the sector today. The article highlights optimistic trends and increasing prices for products like Cheddar cheese, dry whey, and butter. Yet, rising costs for feed, equipment, labor, insurance, and loans heavily burden dairy farmers, especially in the Southeast. The decline in dairy farm numbers and herd sizes further underscores this strain.
Innovative efforts by experts like Jessica Halfen aim to improve dairy cow nutrition and production efficiency. Meanwhile, monitoring threats like the Highly Pathogenic Avian Influenza is vital to maintain milk safety. The future of the U.S. dairy sector depends on its ability to adapt, innovate, and ensure herd health. Stakeholders must support research and strategies to maintain dairy farm viability nationwide.
The resilience of the U.S. dairy industry lies in navigating these dynamics, ensuring it meets rising global and domestic demand while safeguarding producer livelihoods. Policymakers, consumers, and industry leaders must commit to innovation and sustainability to strengthen the sector against ongoing challenges.
Key Takeaways:
Robust Demand: Both domestic and global markets are showing an increased appetite for U.S. dairy products, contributing to optimistic price forecasts.
Rising Prices: The average all-milk price is projected at $21.60 per hundredweight, an improvement from last year, although still lower than the 2022 high of $25 per hundredweight.
Producer Challenges: Despite strong market conditions, dairy producers are struggling with high production costs, including labor, equipment, insurance, and interest on loans.
Regional Impact: Economic pressures have led to a decline in milk production in the Southeast, with fewer dairy farms and smaller herd sizes in states like Mississippi.
Innovative Research: Efforts to improve dairy cow nutrition and health are underway, with new dietary additives and natural compounds showing promise in reducing feed costs and enhancing productivity.
Health Monitoring: The industry remains vigilant about the threat of Highly Pathogenic Avian Influenza, with assurances from USDA and FDA about the safety of the commercial milk supply.
Summary:
The U.S. dairy industry faces challenges in 2024 due to rising costs and global demand. The USDA predicts an average all-milk price of $21.60 per hundredweight, with essential dairy products like Cheddar cheese, dry whey, and butter expected to increase. This global appetite secures the nation’s position in the international dairy market and opens up new trade and market expansion opportunities. The current price stability indicates a return to sustainable yet profitable pricing, allowing producers to tap into market opportunities despite higher input costs. Financial pressures include rising production costs, equipment upgrades, insurance premiums, labor costs, and increasing interest rates on loans. Jessica Halfen, a new dairy specialist at MSU Extension, is leading efforts to mitigate high production costs through innovative research.
Find out how a stronger dollar is affecting CME cash dairy prices. Check out the latest trades and price changes for butter, blocks, barrels, etc. Want to know the specifics?
If you look at Chicago Mercantile Exchange (CME) cash dairy prices, you’ll notice that most categories are trending downward. This is mainly due to a stronger dollar, which typically pushes lower commodity prices, including dairy.
Here’s a quick snapshot of the current state of CME cash dairy prices:
Dry whey: Price increased by $0.0150, now at $0.4850 per pound
Cheese blocks: Decreased by $0.0175, closing at $1.8725 per pound
Cheese barrels: Fell by $0.0050, settling at $1.91 per pound
Butter: Dropped $0.0325 to $3.0325 per pound
Nonfat dry milk: Reduced by $0.0050, now at $1.1875 per pound
Dry whey rose by $0.0150 to $0.4850 per pound, with one trade recorded at this price, showing some market activity.
Cheese blocks dropped by $0.0175, settling at $1.8725 per pound. Factors like the stronger U.S. dollar and supply fluctuations are likely behind this trend, affecting the pricing and making U.S. exports less competitive.
Cheese barrels also fell by $0.0050 to $1.91 per pound. One trade was made at this price. These changes mirror those in block prices and reflect broader market adjustments.
Butter prices decreased by $0.0325 to $3.0325 per pound, which is notable compared to last week’s higher values. Six trades were made between $3.0175 and $3.0325, indicating continued market engagement despite the decline.
Nonfat dry milk experienced a slight dip of $0.0050 to $1.1875. The fact that seven trades were recorded within the $1.18 to $1.1875 range underscores the active participation in this commodity, keeping the market engaged.
The Bottom Line
On Tuesday, the CME cash dairy market predominantly witnessed lower prices, a trend largely influenced by a stronger dollar. While dry whey saw a slight increase, key dairy products like blocks, barrels, butter, and nonfat dry milk experienced a decline. Notably, sales activity was significant in butter and nonfat dry milk, reflecting the challenging market conditions for dairy prices.
Dive into April’s U.S. cheese production trends. Curious about the rise of Italian cheese and the decline of American cheese? Uncover the compelling data and regional details.
April presented a mixed landscape for U.S. cheese production, with both promising gains and notable declines. According to the USDA, total cheese output, excluding cottage cheese, reached 1.19 billion pounds, up 1.8% year-over-year but down 3% from March. Italian-type cheese production rose by 6.2% from last year to 504 million pounds, though it fell 2.8% from March. On the other hand, American cheese production declined by 4.7% year-over-year and 4.3% from March, totaling 468 million pounds.
“The mixed trends in U.S. cheese production signal both resilience and challenges within the industry,” the USDA report suggests.
Category
Production (Million Pounds)
Year-Over-Year Change
Month-Over-Month Change
Total Cheese (excluding cottage)
1,190
+1.8%
-3.0%
Italian-Type Cheese
504
+6.2%
-2.8%
American Cheese
468
-4.7%
-4.3%
Butter
208
+5.3%
-1.0%
Nonfat Dry Milk
173
-12.7%
—
Skim Milk Powder
36.3
-20.8%
—
Dry Whey
—
+2.1%
—
Lactose
—
-1.5%
—
Whey Protein Concentrate
—
-6.1%
—
Hard Ice Cream
64.7 million gallons
+7.3%
—
Mixed Signals in April U.S. Cheese Production Reflecting Varied Trends
According to the USDA data, total cheese output, excluding cottage cheese, reached 1.19 billion pounds in April. This marks a 1.8% increase compared to the same period last year but shows a 3% decrease from March. The production dynamics underscore a mixed trend in U.S. cheese production for the month, reflecting both year-over-year growth and month-over-month decline.
Italian Cheeses Shine Year-Over-Year Despite Monthly Dip
Italian-type cheese production showcased a remarkable upturn, reflecting a year-over-year surge of 6.2%, culminating at 504 million pounds. Despite this annual growth, the month-over-month comparison revealed a marginal dip of 2.8% from March. This duality underscores both the strong demand for Italian cheeses over the year and the seasonal or market-driven fluctuations that influence monthly production volumes.
American Cheese Production Faces Significant Challenges in April
Amid the intricate landscape of U.S. cheese production, American cheese has faced a particularly challenging month. Specifically, April witnessed a decline in American cheese output, both when compared year-over-year and month-over-month. Production fell by 4.7% from April last year, resulting in a total output of 468 million pounds. The month-over-month comparison is similarly bleak, with a 4.3% decrease from March, accentuating the downward trend in this particular cheese category. This dual decline highlights ongoing shifts within the industry, signaling potential adjustments in consumer demand and production focus.
Butter Production Sees Minor Monthly Dip Amidst Impressive Annual Growth
Butter production trends exhibited a complex pattern, reflecting the overarching variability in the dairy sector. While there was a minor decline of just over 1% in butter output compared to March, the sector demonstrated resilience with a notable 5.3% increase compared to the same period last year. This duality in trends is indicative of broader market dynamics and seasonal production adjustments. In total, April’s butter production reached 208 million pounds, underscoring both the short-term and long-term shifts in the dairy landscape.
Sharp Declines in Dry Dairy Products Highlight April’s Downturn
Dry dairy products presented a downward trend in April, with significant declines observed in both nonfat dry milk and skim milk powder production. Nonfat dry milk saw a steep reduction, recording a 12.7% drop to reach a total of 173 million pounds. Skim milk powder production experienced an even sharper decline of 20.8%, culminating in a total output of 36.3 million pounds compared to the same period last year.
Contrasting Fortunes Within Dry Dairy Production Reflect April’s Complex Landscape
Nevertheless, not all dry dairy products shared the same fate. Dry whey production, for instance, edged up by 2.1%, offering a glimmer of optimism amidst broader declines in the sector. Specifically, dry whey output reached notable levels, counteracting the overarching downtrend. Conversely, lactose production did not fare as well, registering a 1.5% decline. Even more striking was the significant 6.1% decrease in whey protein concentrate production. Collectively, these figures underscore the mixed results within the dry dairy product landscape, highlighting areas of both growth and notable declines.
Unprecedented Fluctuations in Frozen Dairy Production: Hard Ice Cream Surges While Other Categories Slide
Frozen dairy product output varied significantly in April, illustrating a mixture of trends within the industry. The production of hard ice cream notably climbed by an impressive 7.3%, reaching 64.7 million gallons. This increase stands in stark contrast to the declines observed in other frozen dairy categories. The production of low-fat ice cream, sherbet, and frozen yogurt all experienced downturns, highlighting the sector’s fluctuations and the diverse consumer preferences shaping production dynamics.
Regional Production Trends: Wisconsin’s Cheddar Supremacy and California’s Mozzarella Dominance
In examining regional production trends, the data reveals that Wisconsin continues to dominate the Cheddar cheese market, producing an impressive 60.38 million pounds in April. California follows, contributing 21.29 million pounds to the nation’s Cheddar cheese supply.
Turning attention to Mozzarella, California leads with a substantial output of 134.14 million pounds, while Wisconsin is not far behind, generating 93.13 million pounds. This makes California the unrivaled leader in Mozzarella production, though Wisconsin’s figures are commendable.
When looking at overall cheese production, Wisconsin emerges as the top-producing state with an aggregate output of 281.48 million pounds. California comes in second, followed closely by Idaho and New Mexico. These states collectively form the backbone of the U.S. cheese manufacturing industry, each playing a crucial role in meeting domestic and international demand.
The Bottom Line
April’s cheese production data from the USDA paints a complex picture of the dairy industry, characterized by both advancements and setbacks. Italian-type cheeses exhibited impressive year-over-year growth, driven by a notable 6.2% increase, even as they faced a slight month-over-month decrease. In stark contrast, American cheese suffered significant declines both annually and monthly, highlighting underlying production challenges.
The broader dairy landscape reflected similar dualities. Butter production experienced a modest monthly dip but demonstrated robust annual growth. The production of dry dairy products such as nonfat dry milk and skim milk powder saw sharp drops, whereas dry whey managed a slight increase.
Frozen dairy products also showed variability, with hard ice cream production surging, while other categories like low-fat ice cream and frozen yogurt declined. Regionally, Wisconsin and California continued to dominate specific cheese categories, underscoring their pivotal roles in national dairy production.
Overall, these intricate trends underscore the multifaceted nature of the U.S. dairy industry, highlighting areas of growth and the need for strategic adjustments in response to declining segments.
Key Takeaways:
Total cheese production in April saw a slight year-over-year increase of 1.8%, despite a 3% drop from March.
Italian-type cheese production rose by 6.2% year-over-year but decreased by 2.8% from the previous month.
American cheese production experienced declines both year-over-year and month-over-month, down by 4.7% and 4.3% respectively.
Butter production was up by 5.3% compared to April of last year, although it saw a minor decline from March.
Dry dairy products faced significant declines: nonfat dry milk dropped by 12.7% and skim milk powder by 20.8% year-over-year.
Dry whey production slightly increased by 2.1%, while lactose and whey protein concentrate production declined by 1.5% and 6.1% respectively.
Hard ice cream production surged by 7.3%, but low-fat ice cream, sherbet, and frozen yogurt production all decreased.
Wisconsin led in Cheddar cheese production, contributing 60.38 million pounds, whereas California was the top producer of Mozzarella with 134.14 million pounds.
Summary: In April, U.S. cheese production experienced a mixed landscape, with both positive and negative trends. The USDA reported a total cheese output of 1.19 billion pounds, up 1.8% year-over-year but down 3% from March. Italian-type cheese production rose by 6.2% to 504 million pounds, while American cheese production declined by 4.7% year-over-year and 4.3% from March, totaling 468 million pounds. This dual decline highlights ongoing shifts within the industry, signaling potential adjustments in consumer demand and production focus. Butter production saw a minor monthly dip, while dry dairy products showed a downward trend, with significant declines observed in nonfat dry milk and skim milk powder production. Dry whey production edged up by 2.1%, but lactose production and whey protein concentrate production also saw a decline. Frozen dairy product output varied significantly, with hard ice cream production climbing by 7.3% to reach 64.7 million gallons. Wisconsin continues to dominate the Cheddar cheese market, producing an impressive 60.38 million pounds in April.
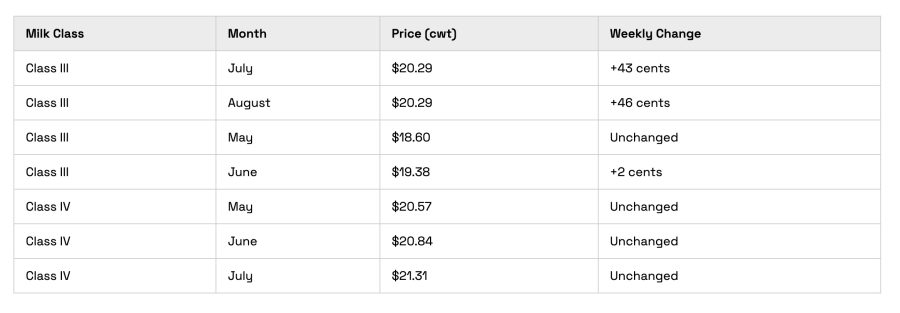
Uncover the dynamics driving late-week surges in the milk markets. Witness the ascent of Class III and IV milk prices. Eager to learn about the latest movements in dairy and grain sectors? Continue reading.
The milk markets experienced a volatile week, culminating in a significant late-week surge that notably impacted Class III and Class IV milk prices. The strength of class III milk, particularly in the latter half of the year, was a key highlight. July’s contracts saw a substantial increase of 43 cents to $20.29, while August mirrored this trend with a 46-cent climb to the same price of $20.29/cwt. In contrast, earlier months such as May and June were more subdued, with May closing at $18.60 and June showing a minimal increase of just 2 cents to $19.38/cwt.
Market analysts observed, “The late-week buying frenzy brought a refreshing upswing to the milk markets, particularly benefiting Class III prices in the latter months of the year.”
Class IV milk prices demonstrated a more tempered response, maintaining stability despite a modest gain in butter prices. May’s contracts settled at $20.57, June at $20.84, and July reached $21.31/cwt. These figures underscore the nuanced variations within the different milk classes, reflecting broader market dynamics and investor sentiment.
Class III Milk Prices Enjoy Summer Surge Amid Subdued Early-Year Performance
Date
May
June
July
August
Monday
$18.60
$19.36
$19.86
$19.83
Tuesday
$18.60
$19.37
$19.96
$19.94
Wednesday
$18.60
$19.38
$20.09
$20.05
Thursday
$18.60
$19.38
$20.15
$20.15
Friday
$18.60
$19.38
$20.29
$20.29
Class III milk experienced a notable improvement in the latter part of the year. July increased by 43 cents to reach $20.29 per hundredweight (cwt), while August followed with a rise of 46 cents, also hitting $20.29/cwt. In contrast, May ended at $18.60, showing little change, and June gained just 2 cents to close at $19.38/cwt. These numbers highlight a clear seasonal trend, with more robust market dynamics emerging in the summer months for Class III milk.
Class IV Milk Market Remains Steady Amid Modest Butter Price Gains
Future
May
June
July
Monday
$20.57
$20.84
$21.31
Tuesday
$20.57
$20.84
$21.31
Wednesday
$20.57
$20.84
$21.31
Thursday
$20.57
$20.84
$21.31
Friday
$20.57
$20.84
$21.31
The week in the dairy market has displayed notable shifts, particularly in the Class IV milk futures. Despite the muted movement, the overall trend leans toward stability with a few upward adjustments compensating for earlier lukewarm phases. For a clearer illustration, let’s delve into the Class IV milk futures trends over the past week:
Class IV milk prices remained steady compared to Class III, showing minimal volatility. Class IV milk held its ground despite a modest 6-cent rise in butter prices. May closed at $20.57/cwt, June slightly up at $20.84, and July continued this trend at $21.31. These figures highlight a consistent market with gradual gains, reflecting the steady performance of Class IV milk.
The CME Spot Trade Closes the Week with Significant Activity in the Dairy
Product
Monday
Tuesday
Wednesday
Thursday
Friday
Weekly Trend
Butter ($/lb)
$3.03
$3.04
$3.05
$3.07
$3.09
▲6 cents
Cheddar Blocks ($/lb)
$1.81
$1.81
$1.81
$1.81
$1.81
─
Cheddar Barrels ($/lb)
$1.94
$1.94
$1.94
$1.94
$1.94
─
Dry Whey ($/lb)
$0.41
$0.41
$0.41
$0.41
$0.41 1/2
▲1/2 cent
Grade A Non Fat Dry Milk ($/lb)
$1.16
$1.16
$1.16
$1.16
$1.16 3/4
▲3/4 cent
The CME spot trade saw significant action in the dairy sector, especially in the butter and cheese markets. Butter prices rose 6 cents to $3.09 per pound, hinting at increased demand or limited supply, which could positively impact the broader dairy market.
Cheddar cheese prices remained stable, with Blocks at $1.81 and Barrels at $1.94 per pound. This consistency suggests a balanced market without primary surpluses or deficits.
The block/barrel spread stayed inverted at 13 cents, indicating supply concerns or quality preferences. Typically, Blocks are pricier due to their broader use and better quality. The sustained average price of $1.87 1/2 per pound reflects the market’s effort to balance these differences, providing insight into future price trends in the dairy sector.
Powder Markets Show Promise with Incremental Price Gains
Product
Price (per lb)
Change
Trend
Dry Whey
$0.41½
+1 cent
Up
Grade A Non Fat Dry Milk
$1.16¾
+½ cent
Up
The powder markets exhibited a solid performance this past week, signaling promise in this sector. Dry Whey climbed by a penny to $0.41 1/2 per pound, indicating a steady demand. This rise may suggest market stability amid fluctuating dairy prices.
Grade A Non-Fat Dry Whey also increased by 1/2 cent, reaching $1.16 3/4 per pound. This small but significant uptick reflects the strength of the dairy industry and hints at a balanced supply and demand. These incremental gains not only reinforce market stability but also inspire confidence in the potential growth of the powder markets, which could have broader economic implications for those invested in commodities.
Grain and Feed Markets Reflect Broader Economic and Environmental Instabilities
Commodity
Contract Month
Closing Price
Price Change
Corn
July
$4.46 1/4
Down 2 1/2 cents
Soybeans
July
$12.05
Down 4 3/4 cents
Soybean Meal
July
$364.10/ton
Up $1.10
Wheat
July
$6.78
Down 2 1/2 cents
Rice
July
$17.67
Down 16 cents
Feeder Cattle
August
$256.40
Down $2.67
The grain and feed markets faced a notable shift towards the weekend, marked by varied price movements across critical commodities. Corn slipped slightly, with July futures closing at $4.46 1/4, down 2 1/2 cents. This minor dip mirrors broader market trends where corn battles to sustain momentum amid changing demand-supply dynamics. Soybeans followed suit, with July futures dropping 4 3/4 cents to $12.05 per bushel, reflecting ongoing market volatility and the impact of trade conditions and weather on crop yields.
Despite a modest rise in soybean meal prices, the feed markets remained complex. July prices increased by $1.10, finishing the week at $364.10 per ton. However, prices remained over $25 per ton below earlier weekly highs, underscoring the intricate and volatile nature of the feed markets. These shifts serve as a reminder of the need for caution in the grain and feed sectors, mirroring the broader economic and environmental uncertainties.
The Bottom Line
The week concluded with a notable rise in milk markets, spurred by a robust late-week surge in Class III milk. Gains in July and August highlighted its strength, contrasting a quieter early-year performance. Class IV milk displayed a steadiness, with modest butter price increases.
Significant activity marked the CME spot trade, with butter and cheese showing price movements and powder markets finishing the week with gains. In contrast, grain and feed markets slid into the weekend, impacted by economic and environmental challenges. Corn, soybeans, and soybean meal exhibited varied performances, reflecting the intricate dynamics of agricultural markets.
Key Takeaways:
Class III milk prices experienced an encouraging surge in late-week trading, showing notable gains for July and August contracts.
Earlier months like May and June saw more modest price movements, with minimal increases observed.
Class IV milk prices remained relatively stable, with slight upward adjustments despite varied commodity performance within the dairy market.
The CME spot trade highlighted a 6-cent gain in Butter prices, while Cheddar Blocks and Barrels maintained their previous levels, keeping the block/barrel spread inverted.
Powder markets closed the week on a positive note, with Dry Whey and Grade A Non-Fat Dry Whey inching upward.
Grain and feed markets displayed downward trends, with slight declines in corn and soybeans and a notable drop in soybean meal from earlier highs.
Summary: The milk markets experienced a volatile week, culminating in a late-week surge that significantly impacted Class III and Class IV milk prices. Class III milk experienced a significant improvement in the latter part of the year, with July’s contracts seeing a substantial increase of 43 cents to $20.29, and August mirrored this trend with a 46-cent climb to the same price. In contrast, earlier months such as May and June were more subdued, with May closing at $18.60 and June showing a minimal increase of just 2 cents to $19.38/cwt. Market analysts observed that the late-week buying frenzy brought a refreshing upswing to the milk markets, particularly benefiting Class III prices in the latter months of the year. The dairy market displayed notable shifts, particularly in Class IV milk futures, with the overall trend leaning toward stability with a few upward adjustments compensating for earlier lukewarm phases.
To provide the best experiences, we use technologies like cookies to store and/or access device information. Consenting to these technologies will allow us to process data such as browsing behavior or unique IDs on this site. Not consenting or withdrawing consent, may adversely affect certain features and functions.
Functional
Always active
The technical storage or access is strictly necessary for the legitimate purpose of enabling the use of a specific service explicitly requested by the subscriber or user, or for the sole purpose of carrying out the transmission of a communication over an electronic communications network.
Preferences
The technical storage or access is necessary for the legitimate purpose of storing preferences that are not requested by the subscriber or user.
Statistics
The technical storage or access that is used exclusively for statistical purposes.The technical storage or access that is used exclusively for anonymous statistical purposes. Without a subpoena, voluntary compliance on the part of your Internet Service Provider, or additional records from a third party, information stored or retrieved for this purpose alone cannot usually be used to identify you.
Marketing
The technical storage or access is required to create user profiles to send advertising, or to track the user on a website or across several websites for similar marketing purposes.


 Join the Revolution!
 Join the Revolution!