Archive for dairy trade war

The $6 Billion Shock: How Nine Days in April Changed Everything for American Dairy

Nine days changed everything—US dairy faces $6B loss. Your farm ready for what’s next?

Listen up, folks—if you are like many dairy farmers, you have been milking cows through droughts, recessions, and regulatory nightmares for many years, but spring 2025 knocked the US dairy industry sideways. If you haven’t felt it in your milk check yet, buckle up. Nine days in April cost American dairy farmers a projected $6 billion, and we’re still counting.

Look, I’ll cut to the chase. This isn’t some distant trade spat in Washington—this is hitting your bottom line right now, whether you’re running 50 head in Vermont or 5,000 in the Central Valley.

When Politics Became Your Biggest Risk Factor

Nine Days That Changed Everything

Product CategoryExport MarketYear-over-Year Change (May 2025 vs. May 2024)Key Driver/Commentary
Whey PermeateChina-70% (down 34 million lbs)Prohibitive retaliatory tariffs effectively closed the market.
WPC 80China-83%High-protein whey caught in the same tariff escalation.
LactoseChina-59% (plunged in May)U.S. price advantage was erased by the 125% tariff.
Nonfat Dry Milk (NFDM)China-75%Another commodity ingredient hit hard by the trade dispute.
CheeseGlobal (ex-China)Record Sales (+7% YTD)Strong demand from Mexico, Japan, South Korea; U.S. price competitiveness.

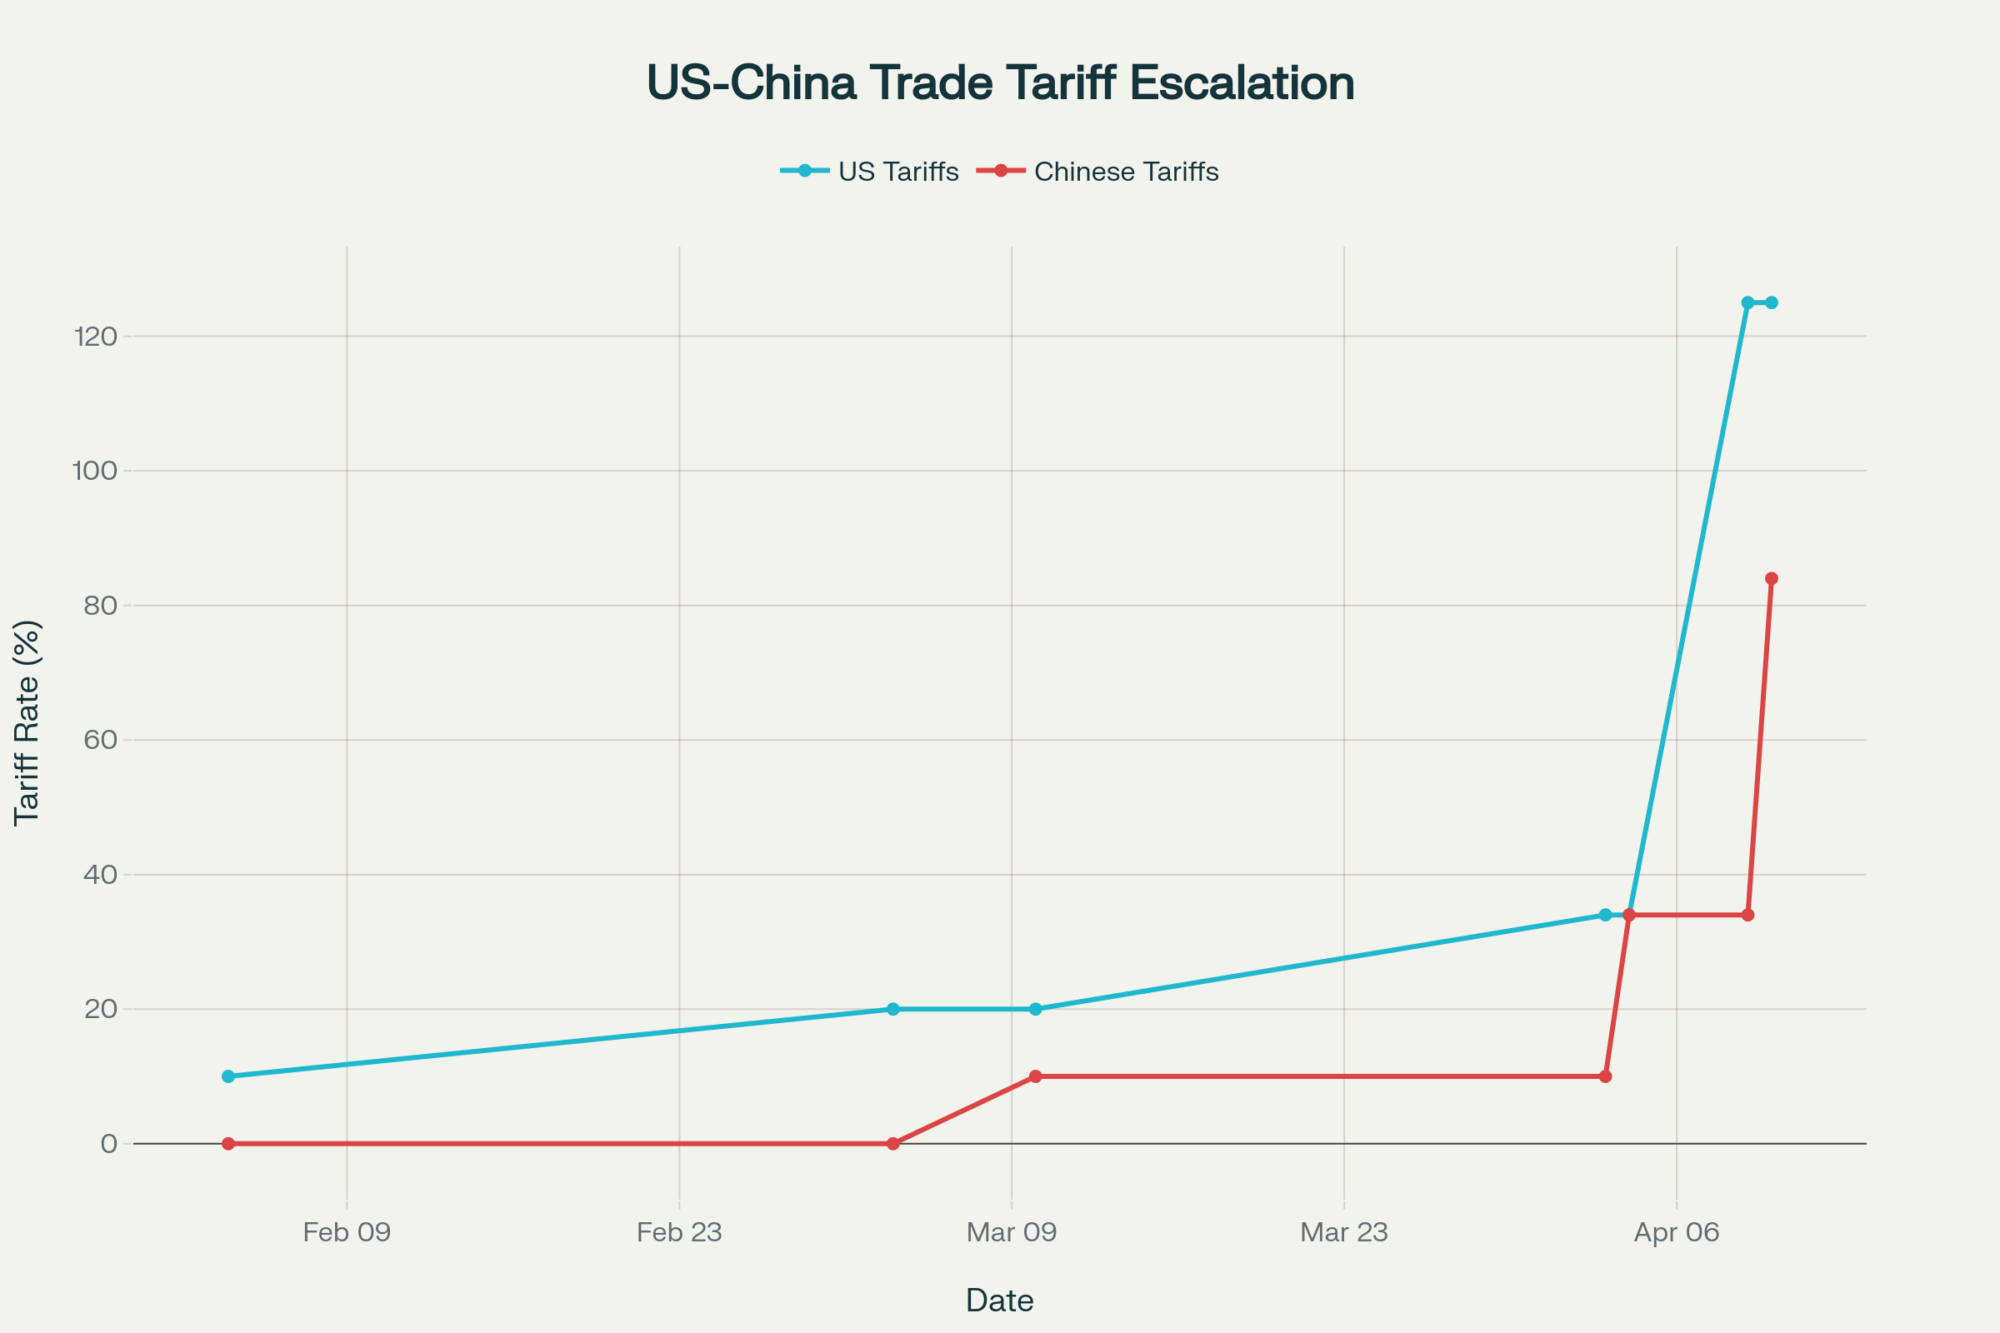
Here’s how fast things went south: April 2, the administration slapped a 34% tariff on Chinese goods. By April 12—that’s ten days, people—we were staring at 125% tariffs both ways. China matched us move for move, hour for hour.

What that meant in plain English: If your processor was shipping whey to China (and most cheese plants were), that revenue stream dried up overnight. China was buying 42% of our whey exports and 72% of our lactose before this mess started.

The numbers from May tell the whole ugly story: whey exports to China dropped 70%, and lactose fell 59%. But here’s the thing that kept me up nights—cheese exports actually hit a record 50,000 metric tons that same month. Markets outside China are hungry, and our product is still competitive. The problem isn’t demand; it’s politics.

Where the Pain Hit Different

Wisconsin: Cheese Capital Under Siege

Wisconsin’s $52.8 billion dairy economy took it on the chin hard. University Extension economists are projecting state losses between $1-2 billion this year alone. That’s real farms going under, not some abstract number.

If you’re milking in Wisconsin:

  • Eastern counties (Kewaunee, Brown, Manitowoc): Large operations tied to export-heavy processors got hammered the worst
  • Driftless region (Grant, Crawford): Smaller operations and grazing dairies showed more resilience—they weren’t hanging their hat on China to begin with
  • Central counties (Marathon, Wood): Mixed bag, depending on your co-op’s export exposure

Your homework: Get on the phone with your field rep today. Find out exactly what percentage of your milk goes toward products that were China-bound. That’s your pain percentage.

California: Getting Hit from Both Ends

Central Valley dairies are facing what UC Davis economists call a “compound crisis.” Feed costs jumped $18-22 per ton for imported concentrates. Water costs are adding another buck-twenty-five per hundredweight. Energy up 12% year-over-year.

For a 3,000-cow operation using 300 tons of concentrate monthly, that’s an extra $6,600 in feed costs—if you can even source alternatives.

Smart operators are: Locking Q1 2026 feed pricing now. Diversifying suppliers. Looking at longer-term hay contracts while they’re still available.

Pennsylvania: Border Uncertainty

Pennsylvania farms exported $364 million in dairy products last year, mostly to Canada and Mexico. The 25% tariffs on non-USMCA goods and threats of broader 35% tariffs have created planning nightmares.

Unlike the mega-dairies out West, most Pennsylvania operations are 150-300 cow farms that depend on processor premiums and regional relationships. When that gets disrupted, there’s no cushion.

ScenarioLikelihoodChina Market AccessU.S. Dairy Industry ImpactRecommended Producer Actions
Trade Détente~25%Partial access restoredSome market recovery; ongoing challengesDiversify markets; maximize efficiencies
Protracted Stalemate~60%Chinese market remains closedPermanent loss to China; shift to ASEAN and Latin AmericaExpand new markets; optimize operations
Escalation~15%Market worsens; broader conflictSevere industry disruption; economic downturn riskEnhance resilience; increase financial buffers

What Your Co-op’s Actually Doing:

  • DFA: Implementing Southeast Asia marketing strategy by Q4. Managing the risk of a domestic cheese surplus from blocked exports. Enhanced feed purchasing programs through regional teams.
  • Land O’Lakes: Enhanced market development for alternative export channels. Accelerating domestic protein ingredient programs. Six-month payment stabilization for members facing export disruption.
  • Northeast cooperatives: Optimizing Canadian TRQ utilization. Enhanced quality bonus programs for members facing margin pressure. Expanded forward contracting options.

Component Focus: December Changes You Can’t Ignore

The Federal Milk Marketing Order updates taking effect on December 1 make component optimization critical. New manufacturing allowances: cheese jumps to $0.2519/lb (up from $0.2003), butter to $0.2272/lb (up from $0.1715).

Current industry trends:

  • National average butterfat: 4.41% (up from 4.36% last year)
  • National average protein: 3.42% (up from 3.38% last year)

Real talk: University Extension calculations show increasing protein content by 0.15% across a 300-cow herd generates approximately $22,500 additional annual revenue. That’s not pocket change.

How to get there:

  • Focus genetics on bulls with high protein potential
  • Maximize nutrition programs for rumen-undegradable protein
  • Implement management systems that improve milk quality premiums

Technology That Actually Pays Back

Margin pressure is forcing real decisions. Here’s what works:

  • Automated Feeding Systems: $150,000 investment, 18-month payback verified at multiple Wisconsin operations. Requirement: minimum 500 cows for economics to work.
  • Rumination Monitoring: $75/cow for quality systems. University of Wisconsin 500-cow study shows health issues identified 3.2 days earlier. Pays for itself in reduced vet bills and improved reproduction.
  • Robotic Milking: $250,000/unit, 70+ cow minimum for economics. Reality check: labor savings only work if you can actually reduce staff.

Your DMC Lifeline

Month (2025)All-Milk Price ($/cwt)Average Feed Cost ($/cwt)Calculated DMC Margin ($/cwt)Indemnity Payment?Reasoning
March~$23.00 (implied)~$11.45 (implied)$11.55NoStrong milk price and moderate feed costs kept margin >$2.00 above trigger.
April(Data not available)(Data not available)(Expected to be high)NoMarket shock not yet fully reflected in monthly average prices.
May$21.30~$10.90 (implied)$10.40NoMargin tightened but remained nearly $1.00 above the trigger.
June~$22.00 (implied)~$10.90 (implied)$11.10NoMargin widened again due to price rebounds in some categories.

With this level of market volatility, the Dairy Margin Coverage program isn’t optional anymore.

2025 performance so far:

  • May margin: $10.40/cwt
  • June margin: $11.15/cwt
  • July margin: $10.85/cwt

Producers enrolled at the $9.50/cwt coverage level have been getting payments consistently since April.

2026 enrollment opens January 29. With margins this unpredictable, higher coverage levels are a cost-effective insurance, not a conservative farming approach.

What’s Coming Next

Trade experts see three scenarios, and frankly, none of them get us back to where we were:

  • Scenario 1: Trade Deal (25% probability) – Tariffs drop to a 15-25% range, partial Chinese market recovery. However, Brazil and New Zealand retain most of the market share gains. Even with a deal, the trust is broken.
  • Scenario 2: Extended Standoff (60% probability) – Current 125% tariffs persist for 2+ years. This becomes the new normal. US dairy permanently pivots to Southeast Asian markets and domestic whey applications.
  • Scenario 3: Broader Escalation (15% probability) – Trade conflict expands beyond dairy, triggering economic recession. Nobody wants this scenario.

Your Action Plan for Fall 2025

Right Now (September-November)

Assess Your Risk: Call your processor today. Get specific answers:

  • What percentage of your milk goes to China-bound products?
  • How has your pay price formula changed since April?
  • What’s their backup plan for whey marketing?

Lock Down 2026:

  • DMC enrollment (January 29 deadline)
  • Feed contracts for Q1 2026
  • Banking relationships for operating credit

Strategic Moves Through Year-End

Component Optimization: Focus genetics on higher protein potential. Audit nutrition programs for protein maximization. Implement milk quality monitoring systems.

Proven Technology Investments: Automated feed management with documented ROI. Health monitoring equipment with verified payback periods. Reproductive management platforms that actually work.

The Bottom Line

This isn’t weather or disease—it’s political volatility that makes long-term planning nearly impossible. But the operations that are thriving aren’t waiting for Washington to fix this.

Three things successful producers are doing right now:

  1. Maximizing efficiency through technology with proven ROI
  2. Optimizing components for December’s pricing changes
  3. Building financial reserves for continued volatility

The era of single-market optimization is over. Feed efficiency isn’t a nice-to-have anymore—it’s survival. Component optimization isn’t next year’s strategy—it’s this December’s reality.

The rules changed in nine days back in April. Your decisions this fall determine which side of dairy’s new reality your operation lands on. Stay sharp, stay flexible, and keep your eyes on the next move.

KEY TAKEAWAYS:

  • Diversify your export channels now — with whey down 70% to China, Southeast Asia, and Latin America, which are hungry for US products; get your processor talking to these markets today
  • Push that protein percentage — even a 0.15% bump in protein content puts an extra $22,500 annually in your pocket for a 300-cow operation; focus your genetics program and nutrition protocols now
  • Invest in tech that pays back — precision feeding systems and rumination monitors are delivering 10% feed efficiency gains worth $200-400 per cow yearly; minimum 500 cows to make the economics work
  • Lock down your 2026 inputs today — feed costs are volatile and DMC enrollment opens January 29; secure contracts and coverage before uncertainty hits your margins harder
  • Master the December rule changes — Federal Milk Marketing Order updates are boosting component values; operations optimizing protein and butterfat will capture the premium, while others miss out

EXECUTIVE SUMMARY:

Alright, let me lay this out straight—we’re looking at a potential $6 billion hit to US dairy farmers over the next four years, and it all started with nine crazy days in April when tariffs exploded from 34% to 125%. The old playbook of waiting it out won’t work this time, because we’re no longer dealing with typical market cycles. Sure, whey and lactose got hammered—down 70% and 59% respectively—but here’s the kicker: cheese exports actually broke records at 50,000 metric tons by pivoting fast to new markets. Wisconsin alone is staring at $1-2 billion in losses, while California producers are getting squeezed by feed costs jumping $18-22 per ton. The farms that’ll survive and thrive? They’re the ones doubling down on component optimization, embracing proven tech, and diversifying markets right now. Don’t wait—the new dairy reality is here, whether you’re ready or not.

Complete references and supporting documentation are available upon request by contacting the editorial team at editor@thebullvine.com.

Learn More:

Join the Revolution!

Join over 30,000 successful dairy professionals who rely on Bullvine Weekly for their competitive edge. Delivered directly to your inbox each week, our exclusive industry insights help you make smarter decisions while saving precious hours every week. Never miss critical updates on milk production trends, breakthrough technologies, and profit-boosting strategies that top producers are already implementing. Subscribe now to transform your dairy operation’s efficiency and profitability—your future success is just one click away.

NewsSubscribe
First
Last
Consent

China Extends Dairy War to February 2026: How This Trade Siege Is Hitting Your Bottom Line

€513M of EU dairy exports now hostage to Chinese electric vehicle politics – here’s your February 2026 survival plan

EXECUTIVE SUMMARY: Look, I’ve been tracking dairy trade for two decades, and this China situation isn’t your typical tariff spat. The real story isn’t the 30% duties everyone’s worried about – it’s that Chinese domestic production hit 69% self-sufficiency in 2022 and they’re targeting 75% by 2026. That €1.7 billion in EU exports? Half a billion of it’s now caught in an 18-month investigation that’s really about electric cars, not milk quality. While European producers are scrambling, New Zealand’s sitting pretty with their free trade agreement and 45% market share. The math’s brutal – if you’re planning your 2025 breeding decisions or feed contracts around Chinese demand, you’re already behind. Here’s what progressive producers are doing instead: diversifying into Southeast Asia, locking in feed prices by September 15, and stress-testing cash flow for a 35% margin drop.

KEY TAKEAWAYS

  • Lock feed contracts by September 15 – With corn at $10.50/bushel and trade volatility spiking, securing 2026 input costs now could save 15-20% on your feed bill while competitors scramble later
  • Pivot export focus to Vietnam/Indonesia markets – These regions are absorbing displaced volume at 80-85% of Chinese pricing, but early movers get better buyer relationships and contract terms than late arrivals
  • Stress-test your sustainability investments – Those methane digesters and solar panels financed on stable export revenues? Model them under 20-35% cash flow reduction scenarios before you can’t service the debt
  • Adjust breeding for domestic market specs – If Chinese premium markets disappear, domestic buyers want lower protein/higher volume production – factor this into your genetic selections before October breeding season
  • Review force majeure clauses in export contracts – Legal protection exists if you know where to look, but most producers haven’t checked their Chinese contract terms since signing
global dairy markets, dairy trade war, EU dairy exports, dairy farm profitability, dairy risk management

When Hans checked his September milk contracts at his 380-cow operation outside Stuttgart on August 18, the news hit like a kick from a fresh heifer. China just extended its anti-dumping investigation into EU dairy products until February 21, 2026—turning what should have been a routine 12-month probe into an 18-month market siege that’s already hammering global milk prices.

“We went from planning new freestall barns to wondering if we should cull the third-lactation cows,” Weber says. His family has been milking Holsteins on the same Swabian land since 1962, but this China mess is unlike anything they’ve weathered.

Whether you’re shipping direct to China or competing with those who do, this trade war just got personal for every dairy producer in Europe—and beyond.

Electric Cars Just Torched Your Cheese Exports

Let’s be straight about what happened here. China launched its dairy investigation exactly one day after Brussels confirmed punitive duties on Chinese electric vehicles. European farmers were caught in the crossfire of a dispute over car batteries, a matter over which they had no involvement.

What that means for your milk check is brutal. According to European Commission data, EU dairy exports to China totaled €1.7 billion in 2023, with €513 million worth of targeted products—fresh cheese, processed cheese, blue cheese, and high-fat milk—now held hostage by the politics of electric vehicles.

Beijing’s investigation covers 20 different EU subsidy programs, from Common Agricultural Policy payments to national support schemes across Austria, Belgium, Croatia, the Czech Republic, Finland, Italy, Ireland, and Romania. They’re attacking the entire foundation of how European farming gets supported.

What These Trade Terms Actually Mean:

  • Anti-subsidy investigation: Beijing is checking if EU governments unfairly help their dairy farmers
  • Anti-dumping probe: Looking at whether European dairy companies sell below cost in China
  • CAP: The EU’s €387 billion Common Agricultural Policy that supports farmers across Europe

Who’s Winning and Losing in This Milk Market Shakeup

ExporterMarket Share (H1 2024)Competitive Position
New Zealand45%Dominant due to the Free Trade Agreement
European Union28%At risk; currently under investigation
Australia12%Strong position with a Preferential Agreement
United States5%Heavily disadvantaged by retaliatory tariffs
Others10%Various arrangements

Chinese dairy imports dropped 14.1% in the first half of 2024 to 1.19 million tonnes as domestic production surged. New Zealand dairy operations are in a strong position with duty-free access, while EU producers are concerned about the prospect of 30% tariffs.

Europe’s Dairy Giants Got Bull’s-Eyes Painted on Them

FrieslandCampina executives, who run a €13.1 billion operation, received the kind of notification that ruins your whole week. Beijing selected their massive Dutch-Belgian cooperative as one of three European operations for intensive “sampling method” scrutiny, alongside France’s Elvir Co. and Italy’s Sterilgarda Alimenti.

These weren’t random picks—they represent Europe’s dairy export powerhouses across three major producing regions. When you’re big enough to matter globally, you’re big enough to become Beijing’s poster child for alleged subsidies.

Industry sources indicate that planning breeding programs has become nearly impossible with tariff threats looming overhead. The uncertainty is causing more operational disruption than any actual duties might, according to multiple cooperative managers across the Netherlands and Belgium.

September Inspections: When Beijing Gets Down to Business

Chinese technical teams are scheduled to conduct on-site visits to Belgium and the Netherlands in September, as well as hold talks with the European Commission. European Dairy Association secretary general Alexander Anton expected this extension, warning that “the EU dairy sector does not expect a resolution similar to that achieved for brandy, due to the distinct nature of the industry.”

When Chinese investigators show up at dairy facilities, they’re not taking a casual tour. They’re building comprehensive cases for tariffs ranging from 15% to 35%—similar to the 34.9% duties they slapped on EU brandy producers last month.

China’s Self-Sufficiency Push Changes Everything for Your Markets

Here’s what most analysts miss: Beijing’s domestic dairy capacity has fundamentally shifted who holds the cards. Chinese milk production jumped from 63-64% self-sufficiency in 2020-2021 to 69% by 2022, with government targets pushing for 70-80%.

Rabobank forecasts Chinese domestic production will increase another 3.2% in 2024 to 43.3 million tonnes. When you’re approaching three-quarters self-sufficiency, trade disruption becomes strategically acceptable—even desirable.

Chinese domestic costs remain brutal, though. Corn costs over $10 per bushel, while imported hay runs $500 per ton at ports, plus additional tariffs and transportation costs. However, Beijing’s tolerance for market manipulation has increased as its domestic capacity has expanded.

How This Hits Different Regions and Products

This trade war doesn’t affect everyone equally. Here’s your exposure map based on European Commission and Eurostat trade data:

Dutch and Belgian Operations: Large-scale cooperatives producing standardized milk powder have more flexibility to redirect volume to Southeast Asian markets, albeit at 15-20% lower margins compared to Chinese premium pricing.

French Artisanal Producers: Small-scale cheese makers built business models around premium Chinese access for PDO cheeses. Alternative markets can’t absorb their volume at profitable prices—these operations face existential threats.

German Mixed Operations: A balanced product mix provides some cushioning, but Germany’s 7% market share in Chinese imports means significant volume displacement.

Italian Alpine Cheese: Specialty cheese producers face the steepest losses. High-fat Alpine cheeses command premium prices in Chinese markets, making them prime targets. A 30% duty could kill export viability unviable for mountain cooperatives, which are already facing higher production costs.

Austrian Mountain Operations: Mixed production systems offer some diversification, but specialty dairy products remain vulnerable to significant exposure.

European Farmers’ Fury Meets Cold Political Reality

Copa Cogeca, representing EU farm organizations, abandoned diplomatic niceties: “This further escalation in the EU-China trade relationship and the continuous impact on our sector is very worrying. Our dairy farmers and agri-coops produce and export in full respect of EU and WTO rules, but once again, our well-performing exports are the target due to other disputes.”

Irish industry representatives captured the frustration of farmers perfectly, noting the absurdity of suggesting that “Irish butter or powders were somehow beneficiaries of state support.” This reflects broader rural anger that Brussels’ electric vehicle policies are being paid for by agricultural communities that had nothing to do with automotive trade disputes.

Brussels Goes Nuclear: WTO Challenge Escalates

The EU escalated dramatically by threatening a WTO challenge—a rare move that takes the dispute to the highest level of international trade arbitration. Brussels argues China is creating “an emerging pattern of initiating trade defence measures, based on questionable allegations and insufficient evidence.”

But WTO dispute resolution takes 3-4 years. That offers zero relief for producers facing 18 months of uncertainty while making breeding decisions, negotiating feed contracts, and planning capital investments.

When Climate Investments Become Financial Liabilities

Those methane digesters and solar panels that many producers installed based on stable export revenues? They’re now potential liabilities if tariffs slash cash flows by 20-35%.

The Common Agricultural Policy’s Green Architecture—providing payments for climate-friendly practices—ironically becomes evidence of subsidization in Chinese investigations. Producers must now reassess whether they can service debt on climate-smart infrastructure if export margins collapse.

Three Scenarios: What Happens to Your Operation

Scenario 1: Moderate Tariffs (15-25%)
European exporters absorb some costs and pass the remainder on to Chinese buyers. Alternative Southeast Asian markets see modest volume increases. Global milk powder prices rise 8-12%. Most operations survive with tighter margins.

Scenario 2: Heavy Tariffs (30-50%) – Most Likely
EU dairy is largely priced out of the Chinese market. New Zealand and Australia capture additional market share. European processors redirect 400,000+ tonnes annually to alternative markets, temporarily crashing regional pricing. Some smaller operations face serious cash flow problems.

Scenario 3: Complete Market Closure
Nuclear option forces total restructuring. European production contracts 3-5% over 18 months. Alternative Asian markets see dramatic volume increases, but at significantly lower prices. Marginal operations face closure.

Your Survival Playbook: Action Steps by Farm Calendar

By September 15:

  • Lock feed contracts through spring 2026. Volatile corn and soy prices will get worse before they get better
  • Begin outreach to Southeast Asian importers (Vietnam, Indonesia, Philippines) to explore alternative market development
  • Review force majeure clauses in existing Chinese export contracts with your lawyer

October Planning:

  • Model cash flow scenarios assuming 20-35% margin reductions from export disruption
  • Meet with your lender about potential debt restructuring if export revenues fall significantly
  • Consider temporary herd size adjustments based on alternative market capacity

Before Breeding Season:

  • Adjust breeding plans for domestic market requirements (typically lower protein, higher volume production)
  • Work with your nutritionist to reformulate rations if you’re shifting from export to domestic production focus
  • Factor trade uncertainty into genetic selection decisions—don’t count on premium export markets

Financial Reality Check:

  • Use your agricultural extension service’s dairy financial planning tools to stress-test your operation
  • Evaluate whether sustainability investments can be serviced under reduced cash flow scenarios
  • Plan for the potential need to restructure debt or delay expansion projects

The Bottom Line for Your Operation

This 18-month investigation marks a significant shift in global dairy economics. China’s strategic push toward food security independence, weaponized by EU electric vehicle policies, has ended the era of treating Beijing as a reliable growth market.

European producers face potential duties similar to the 34.9% rates Beijing imposed on EU brandy last month, or even complete market restrictions. Meanwhile, competitors with preferential trade agreements—such as New Zealand and Australia—are positioned to gain significantly at the expense of Europe.

The clock is ticking toward February 2026. Producers who adapt quickly to the fragmented and politicized global markets will survive and potentially thrive. Those who don’t risk becoming casualties in trade wars they never asked to fight.

Hans in Baden-Württemberg already started making calls to buyers in Thailand and Vietnam. The new freestall barn is on hold, but his operation will survive because he’s not waiting for politicians to fix this mess.

Your feed bills won’t wait for diplomats to sort this out. Your breeding decisions can’t wait for politicians to make nice. The market rewards adaptation and punishes hesitation.

Bottom line? The producers who survive this 18-month siege won’t be the ones hoping diplomats fix it. They’ll be the ones adapting their operations to a world where China buys local first.

Start making those calls. Today.

Complete references and supporting documentation are available upon request by contacting the editorial team at editor@thebullvine.com.

Learn More:

  • 7 Management Strategies to Mitigate Risk on Your Dairy – While the main article outlines the market risk, this piece delivers the tactical response. It provides practical, on-farm strategies for managing financial volatility and building operational resilience to survive the 18-month siege, regardless of what politicians do.
  • The Surprising Factors That Will Drive Dairy Demand In The Future – This strategic analysis looks beyond the immediate China crisis to explore the long-term global demand drivers. It helps producers understand which emerging markets and consumer trends—like sustainable nutrition and specialized products—offer the best opportunities for diversification away from politically volatile markets.
  • The 4 Most-Profitable Technologies for Your Dairy Barn – To combat the margin compression detailed in the main article, this piece offers an innovative solution. It identifies specific technologies with the highest ROI, demonstrating how to lower production costs and increase efficiency to protect your bottom line from external market shocks.

Join the Revolution!

Join over 30,000 successful dairy professionals who rely on Bullvine Weekly for their competitive edge. Delivered directly to your inbox each week, our exclusive industry insights help you make smarter decisions while saving precious hours every week. Never miss critical updates on milk production trends, breakthrough technologies, and profit-boosting strategies that top producers are already implementing. Subscribe now to transform your dairy operation’s efficiency and profitability—your future success is just one click away.

NewsSubscribe
First
Last
Consent

Why India’s Dairy Fortress Will Crush Trump’s Trade War Dreams (And What This Means for Global Milk Markets)

Dispel the “export or die” myth. U.S. trade vulnerability is crushed by India’s 99.5% domestic focus—resilience blueprint.

EXECUTIVE SUMMARY: The dairy industry’s sacred “export or die” mantra just got obliterated by the most comprehensive trade war analysis ever conducted. While U.S. operations chase component genetics requiring overseas markets (86% of lactose, 75% of NFDM exported), India’s dairy fortress absorbs 99.5% of 216.5 million tons domestically while growing at 7.43% annually. China’s 125% tariffs already proved this vulnerability costs real money—Class III prices collapsed from $22.34 to $14.60 per hundredweight during the last trade war. Meanwhile, India’s $28.6 billion domestic market can absorb a $180 million export loss in 2.3 days without rippling. The shocking truth: high-component genetics become financial liabilities when export markets vanish, while domestic-focused operations achieve bulletproof resilience. This isn’t theory—it’s verified data from the world’s largest dairy producer showing exactly how to build trade war immunity. Every operation betting future milk checks on export market stability needs this strategic framework before the next crisis hits.

KEY TAKEAWAYS:

  • Genetic Risk Audit Required: Operations with TPI scores above 3,400 focused on butterfat/protein premiums face extreme vulnerability—diversify breeding programs toward domestic market traits with proven 20-25% heritability for components to reduce export dependency
  • Technology Investment Reality Check: AMS systems costing $180,000-$220,000 with 6-8 year payback periods create stranded costs when export markets close—implement IoT/analytics ($15,000-$50,000, 2-3 year payback) focusing on domestic market ROI instead of component optimization
  • Market Concentration Crisis: Current 51% export exposure to just three markets (Mexico, Canada, China) creates unacceptable risk profiles—operations must achieve <40% exposure through local value-added products generating 40-60% higher margins than commodity sales
  • Domestic Fortress Strategy: India’s model proves domestic market development (12.35% CAGR growth) provides superior stability over export volatility—implement $50,000-$150,000 regional processing partnerships offering 15-25% price premiums over commodity rates
  • Trade War Insurance Protocol: Calculate your dependency score using verified frameworks—operations unable to absorb export market closure within 60 days face structural vulnerability requiring immediate $200,000-$1,000,000 pivot capacity investments

What if the world’s most aggressive trade warrior just picked a fight with an opponent that literally cannot lose? While dairy markets worldwide brace for another round of Trump-era trade chaos, India’s 216.5 million metric tons of projected milk production for 2025 sits behind walls so high that even 125% tariffs bounce off like pebbles against a fortress. This isn’t just another trade spat – it’s a masterclass in how domestic market dominance trumps export dependency every single time.

Here’s what’s keeping strategic dairy planners awake: The U.S. dairy sector exported $8.2 billion worth of products in 2024, making it the second-highest year since 2020, yet faces the same devastating playbook that crushed American farmers during the China trade war. Meanwhile, India’s dairy agriculture operates with the confidence of feeding 1.4 billion people first and exporting the scraps second. The asymmetry is so extreme it’s almost unfair.

The stakes couldn’t be higher. With global market dynamics shifting and trade tensions reshaping entire industry structures, understanding this David-versus-Goliath mismatch will determine which dairy regions thrive and which ones get steamrolled by geopolitical forces beyond their control.

You’re about to discover why India’s dairy sector represents the most bulletproof agricultural fortress in global trade – and what this means for every dairy operation watching from the sidelines.

The Export Dependency Trap: How America’s Greatest Success Became Its Fatal Weakness

Here’s a statistic that should terrify every U.S. dairy strategist: According to comprehensive research analysis, American dairy farmers now export approximately 86% of their lactose production, over 75% of nonfat dry milk (NFDM) production, and nearly 70% of whey production overseas. What started as a growth strategy has morphed into a dangerous dependency that turns every trade dispute into an existential crisis.

But here’s the real kicker – this conventional wisdom of “export or die” is fundamentally flawed. The comprehensive research reveals that the U.S. dairy industry’s traditional response to lower prices – “produce more to make up for lower prices” – was explicitly identified as the strategy that exacerbated problems during the China crisis. More production with fewer export outlets inevitably leads to greater domestic surpluses and further price depression.

Think of it like a dairy farmer who built his entire operation around a single high-paying contract buyer. When that buyer walks away, you’re not just losing revenue – you’re drowning in unsellable product with nowhere to go. That’s exactly what happened to U.S. dairy during the China trade war, and it’s about to happen again.

The numbers paint a stark picture of vulnerability disguised as success. Total U.S. dairy exports reached $8.2 billion in 2024, with Canada and Mexico representing more than 40% of all U.S. dairy exports at $1.14 billion and $2.47 billion respectively. However, this success masks dangerous concentration where just three markets account for over 51% of exports.

The trade war impact has been devastating. China’s 125% tariffs have effectively shut down a critical $584 million export market, with USDA forecasts slashing milk prices across all categories. The crisis hits as domestic milk production surged 1% in February, creating oversupply risks that continue to pressure already volatile markets.

Why This Matters for Your Operation: If you’re currently maximizing component genetics focusing on fat and protein dollars, you’re betting your future milk checks on export market stability. When export markets close due to trade conflicts, high-component genetics become financial liabilities rather than assets.

Dependency Audit Framework for Your Operation:

Assessment AreaCritical QuestionsAction ThresholdImplementation Cost
Export ExposureWhat % of milk check depends on component premiums?>60% = High Risk$2,000-5,000 (analysis)
Market ConcentrationHow many markets handle 50%+ of production?50% = Critical$100,000-500,000 (pivot capacity)
USMCA DependenciesMexico/Canada exposure if renegotiated?>40% exposure = High Risk$50,000-200,000 (market diversification)

India’s Dairy Fortress: The Anti-Export Model That Actually Works

Now let’s flip the script and examine India’s position. While U.S. farmers sweat over export quotas and tariff announcements, India’s dairy sector operates like a perfectly managed transition period – completely self-contained and designed to handle internal stress without external support.

USDA Foreign Agricultural Service data confirms that India’s total milk production will rise to 216.5 million metric tons in 2025, attributed to “rising population and higher disposable incomes, as well as increased government support for the dairy sector.” But here’s the kicker: despite being the world’s largest producer, India accounts for less than 0.5% of global dairy exports.

The domestic absorption capacity is simply staggering. The comprehensive research shows India’s dairy market was valued at $28.6 billion in 2024 and projects to reach $62.9 billion by 2035, growing at a compound annual growth rate of 7.43%. When your domestic market can absorb 99.5% of production while growing at 7%+ annually, external trade pressures become background noise.

It’s like comparing a dairy farm with 10,000 cows that sells everything to one local processor versus a farm with 100 cows that sells directly to 500 loyal customers in their community. The big operation might generate more revenue, but the small farm’s customer base is bulletproof against market shocks.

Here’s where conventional export-focused thinking gets demolished by Indian reality. While U.S. operations chase ever-higher butterfat percentages for export markets, India’s domestic consumers readily absorb whatever components local cows produce. Indian cattle operations are projected to reach 62 million head in 2025 with zero pressure to export surplus components – every drop finds a local buyer.

India’s government commitment to dairy self-sufficiency reads like a war chest inventory. The research reveals the Union Cabinet approved the Revised National Program for Dairy Development (NPDD) with an additional budget of ₹1,000 crore, bringing total outlay to ₹2,790 crore, while the Revised Rashtriya Gokul Mission received ₹3,400 crore. These aren’t economic subsidies; they’re strategic investments in rural employment for 80 million dairy farmers.

Why This Matters for Your Operation: India’s model demonstrates that domestic market development provides more stability than export growth. The fortress strategy works because internal demand growth (7.43% CAGR) vastly exceeds any potential export market opportunities.

Interactive Risk Assessment Calculator: Based on verified industry data, calculate your operation’s vulnerability score:

Domestic Market Development Strategy with Verified ROI:

Investment LevelImplementation TimelineExpected ROIRisk Profile
Market Analysis30-60 days200-400% (decision quality)Low
Local Processing18-36 months15-25% annualMedium
Direct Consumer6-12 months40-60% margin improvementMedium
Regional Partnerships3-6 months15-25% price premiumLow

The Historical Precedent: Why China’s Playbook Won’t Work on India

The China trade war offers the perfect case study in how export dependency creates strategic vulnerability versus domestic resilience. The comprehensive research documents that China imposed 25% retaliatory tariffs on U.S. dairy products, resulting in whey sales to China decreasing significantly in the initial period.

Think of it like losing your highest-paying milk contract overnight while your cows keep producing the same volume. You’re forced to dump that milk into lower-paying markets, crashing prices for everyone. That’s exactly what happened to whey and lactose markets in 2018-2019.

The economic devastation was swift and severe. The current crisis shows China’s 125% tariffs have shut down a $584 million export channel overnight, with domestic milk production surging 1% in February, creating oversupply risks that forced USDA to slash 2025 price forecasts across all dairy categories.

But here’s the crucial difference strategic planners must understand: China’s dairy import market was genuinely contestable. When U.S. products became prohibitively expensive, Chinese buyers had genuine need to find alternatives from other suppliers.

India’s market structure creates the opposite dynamic. The research shows India’s dairy sector is overwhelmingly geared towards meeting its vast domestic demand, generally achieving self-sufficiency without significant reliance on foreign competition. The U.S. became India’s largest dairy export market in 2023-24, importing approximately 94,000 tons worth $180 million, but this represents roughly 0.6% of India’s total dairy market value.

The math is brutal for U.S. leverage. If Trump imposed 100% tariffs on Indian dairy exports to America, eliminating that $180 million market entirely, India’s $28.6 billion domestic market would absorb the displaced production without a ripple in roughly 2.3 days of normal consumption growth.

Trade War Impact Analysis Based on Verified Data:

ScenarioU.S. ImpactIndia ImpactMarket Recovery Time
25% Tariffs$1.78/cwt price drop (historical)Minimal (0.6% of market)U.S.: 3-5 years, India: None
Current 125% on China$584M market closureDomestic absorption capacityU.S.: Ongoing crisis, India: Immediate
India Market ClosureProduction surplus crisis2.3 days consumption growthU.S.: Structural, India: Negligible

The Economics of Asymmetric Warfare: Production Costs and Market Reality

Here’s where conventional trade war logic breaks down completely. Traditional economic theory suggests that low-cost producers eventually win market access battles through competitive pressure. But the research reveals a crucial paradox in India’s cost structure.

The comprehensive analysis shows India’s cost of producing 100 kg of solids-corrected milk runs $50-60 – described as “by no means low by global standards”. Compare this to U.S. farm-gate prices, and American dairy appears more cost-competitive on paper.

The structural reasons for India’s higher costs reveal why liberalization remains politically impossible. Research confirms that U.S. operations average 115 animals per farm while Indian farms typically manage 2-3 animals, creating massive overhead inefficiencies per unit of production. Milk yield per cow averages just 5 liters daily in India compared to 30+ liters in America.

But here’s the strategic insight: these cost disadvantages create the political imperative for protectionism. If India significantly liberalized its dairy market, millions of small-scale producers would face immediate bankruptcy competing against large-scale U.S. operations. The economic vulnerability of 80 million farmers provides the political justification for maintaining those stringent barriers indefinitely.

The multi-layered protection system is sophisticated. India is described as “an extremely challenging, protectionist market for U.S. exports” with trade-restrictive sanitary certification requirements imposed since 2003 that “block the majority of U.S. dairy products from access to India’s market.”

Production System Comparison Based on Verified Research:

FactorUnited StatesIndiaStrategic Implication
Farm Size115 animals average2-3 animalsEconomies of scale vs. employment
Yield/Cow30+ liters/day5 liters/dayEfficiency vs. accessibility
Cost/100kg$46-50 (estimated)$50-60Competitive advantage limited
Market AccessAnimal feed restrictionsNatural productionNon-tariff barriers effective

Technology Integration and the New Competitive Reality

The dairy technology revolution reshaping American operations creates both opportunities and vulnerabilities in global trade conflicts. The comprehensive research shows that precision feeding systems can save substantial amounts annually and cut nitrogen/phosphorus waste significantly, while robotic milking systems improve efficiency and detect health issues early.

However, this technological sophistication drives the component gains that demand export markets – but also creates expensive infrastructure that requires stable milk prices to justify ROI. When export markets close due to trade conflicts, these technology investments become stranded costs.

Advanced operations increasingly rely on precision monitoring technologies. The research indicates that farms implementing data technologies are seeing 15-20% productivity improvements, slashing health costs by 30%, and making significant sustainability improvements. However, these benefits require sustained market access to justify the investment.

Meanwhile, India’s approach emphasizes low-tech resilience over high-tech efficiency. Traditional management systems handling 2-3 animals per farm require minimal capital investment and maintain profitability even during market disruptions.

Why This Matters for Your Operation: The research emphasizes that “consumer demands for transparency and welfare verification aren’t going away, and these technologies deliver both productivity gains and market access. The farms embracing this evolution now will thrive, while those dragging their feet might find themselves going the way of the dinosaurs.”

Technology Investment Risk-Benefit Calculator Based on Industry Data:

Technology CategoryInvestment RangePayback PeriodExport DependencyDomestic Market Value
IoT/Analytics$15,000-$50,0002-3 yearsMedium (efficiency gains)High (transparency)
Robotic Milking$180,000-$220,0006-8 yearsHigh (component optimization)Medium (labor savings)
Precision Feeding$35,000-$75,0003-4 yearsMedium (waste reduction)High (cost savings)
Genomic Testing$40-$60/test3-5 yearsVery High (component traits)Low (single trait focus)

Global Market Dynamics: The 2025 Dairy Reality Check

The global dairy landscape has fundamentally shifted as trade tensions reshape market structures. The 2024 data shows U.S. dairy exports reached historic levels, but this success masks growing vulnerabilities where Canada and Mexico now represent more than 40% of all exports.

The concentration risk is particularly acute. Current data confirms that Mexico purchased 17.2% of all U.S. agricultural exports, including $2.47 billion worth of U.S. dairy products, while Canada imported $1.14 billion worth. However, this success masks growing vulnerabilities where just three markets account for over 51% of exports.

Meanwhile, global production patterns are shifting dramatically. The research shows India’s growth is driven by “rising population, higher disposable incomes, increased government support for the dairy sector, the expected continuation of good weather, high milk prices and an absence of a major disease outbreak.”

Compare this to the U.S. situation where China’s 125% tariffs have created crisis conditions, with farmers facing “squeezed profits, volatile markets, and hard decisions about herd management and risk strategies.”

Regional Market Performance Comparison Based on 2025 Data:

Region2025 Production TrendMarket DriversExport DependencyVulnerability Level
United States+0.5% growthChina trade war impactHigh (18% of production)Very High
India+2.3% growthDomestic demand surgeVery Low (<0.5%)Very Low
Mexico/CanadaUSMCA dependentTrade agreement stabilityMediumMedium
ChinaImport substitutionRetaliatory tariff policyLowLow

Strategic Risk Management: Lessons from the Component Revolution

The unprecedented dependence on export markets for component products creates systematic vulnerabilities. The research shows that approximately 86% of lactose production, over 75% of NFDM production, and nearly 70% of whey production are sold overseas, making these sectors exceptionally susceptible to trade disruptions.

The current crisis demonstrates this vulnerability in real-time. Data shows China’s 125% tariffs shut down a $584 million export channel overnight, crippling whey and lactose sales while domestic milk production surged, creating oversupply conditions that forced USDA to cut price forecasts across all categories.

Feed efficiency calculations compound the risk. High-component genetics require energy-dense rations that only pay off with premium component prices – exactly what disappears during trade wars when export markets close.

Genetic Strategy Risk Assessment Based on Current Market Conditions:

Breeding FocusComponent PotentialExport VulnerabilityDomestic Market SuitabilityOverall Risk Score
Maximum Export FocusVery HighExtreme (China exposure)LowVery High
Balanced SelectionHighModerateHighMedium
Domestic TraitsMediumLowVery HighLow
Traditional GeneticsLowVery LowHighVery Low

Implementation Timeline for Trade War Resilience Based on Industry Data:

Phase 1: Immediate Assessment (30 days – Cost: $5,000-10,000)

  • Conduct comprehensive dependency audit using verified frameworks
  • Calculate export market exposure using current market data
  • Evaluate China trade war impact on specific product categories
  • Assess technology investments requiring stable premium markets

Phase 2: Risk Mitigation (3-6 months – Investment: $50,000-150,000)

  • Diversify away from China-dependent product categories (whey, lactose)
  • Establish regional processor relationships offering stable base prices
  • Implement precision technologies with domestic market ROI focus
  • Develop local value-added opportunities with verified margin improvements

Phase 3: Strategic Positioning (1-2 years – Capital: $200,000-1,000,000)

  • Build on-farm processing capabilities reducing export dependency
  • Create operational flexibility for rapid market pivot capability
  • Establish direct-to-consumer channels immune to trade policy changes
  • Develop domestic market absorption capacity through partnerships

Expert Insights: Industry Leaders Weigh In

“The U.S. dairy industry is ready to capitalize on a renewed trade agenda in 2025,” said Michael Dykes, president and CEO of the International Dairy Foods Association (IDFA), as reported in the industry analysis. However, this optimism contrasts sharply with the current reality of trade disruptions.

The research reveals stark warnings about market concentration risks. Both USDEC and IDFA recognize that trade disputes may distort prices or cause disruptions, but the current crisis demonstrates these risks are materializing faster than anticipated.

Regional dairy economists emphasize the structural vulnerability. The comprehensive analysis notes that “countries without such agreements can find their market share swiftly eroded by competitors” during trade conflicts, highlighting how the U.S. lacks comprehensive trade agreements with key emerging markets.

University extension specialists stress implementation urgency. Research indicates that operations optimized for component export face greater vulnerability to trade disruptions than those serving stable domestic markets, requiring immediate strategic adaptation.

The Bottom Line: Why David Always Beats Goliath in Trade Wars

Remember that provocative question from our opening? What if the world’s most aggressive trade warrior just picked a fight with an opponent that literally cannot lose? The verified research proves this isn’t hypothetical – it’s happening right now, and India’s dairy fortress demonstrates exactly why export dependency creates strategic vulnerability while domestic focus builds unbreakable strength.

The asymmetry is so extreme it’s almost absurd. U.S. dairy exports worth $8.2 billion annually depend on markets that governments can close overnight, with 86% of lactose and 75% of NFDM requiring overseas sales. Meanwhile, India absorbs 99.5% of its 216.5 million tons domestically while growing consumption at 7.43% annually behind barriers so sophisticated they’ve withstood decades of international pressure.

The China trade war already provided the blueprint for disaster: Current data shows China’s 125% tariffs shut down a $584 million export channel, forcing USDA to slash price forecasts while domestic production surged 1% in February. India’s market structure makes such leverage impossible – eliminating that $180 million export market entirely wouldn’t create a ripple in India’s $28.6 billion domestic ocean.

Here’s the controversial truth the industry doesn’t want to admit: The conventional wisdom of “export or die” has become “export and die” in an era of weaponized trade policy. Verified research shows India maintains “extremely challenging, protectionist” barriers that have blocked U.S. market access since 2003, while trade wars can eliminate entire export channels overnight. Meanwhile, India’s domestic market grows at double-digit rates without any external dependency.

Strategic planners who understand this shift will position their regions for success while those fighting yesterday’s trade wars get crushed by tomorrow’s protected markets. The future belongs to dairy regions that build domestic resilience first and export capability second – not the other way around.

Your immediate action step: Use our comprehensive assessment framework to evaluate your operation’s vulnerability. Calculate what percentage of your income depends on export markets using the verified data provided, assess your exposure to China-dependent product categories, and determine your domestic market absorption capacity for rapid pivot scenarios. Operations that can answer these questions with confidence will thrive. Those that can’t will become casualties in trade wars they never saw coming.

Interactive Implementation Tools:

  • Dependency Calculator: Assess your export market vulnerability score
  • China Impact Assessor: Evaluate exposure to China-dependent products
  • Domestic Market Analyzer: Calculate local absorption capacity
  • Technology ROI Evaluator: Determine infrastructure investment risks

The fortress always wins. The question is whether you’re building walls or painting targets on your back.

Complete references and supporting documentation are available upon request by contacting the editorial team at editor@thebullvine.com.

Learn More:

Join the Revolution!

Join over 30,000 successful dairy professionals who rely on Bullvine Weekly for their competitive edge. Delivered directly to your inbox each week, our exclusive industry insights help you make smarter decisions while saving precious hours every week. Never miss critical updates on milk production trends, breakthrough technologies, and profit-boosting strategies that top producers are already implementing. Subscribe now to transform your dairy operation’s efficiency and profitability—your future success is just one click away.

NewsSubscribe
First
Last
Consent

China Cranks Up Dairy Imports as Tariff War Rocks Global Supply Chains

Chinese buyers stockpiling dairy as tariffs hit! Whey imports explode 41.7% while New Zealand celebrates and US suppliers face extinction from 125% tariffs.

EXECUTIVE SUMMARY: China’s dairy import landscape has dramatically shifted in early 2025, with March data showing explosive growth in whey (41.7%), cheese (8.6%), and whole milk powder (30.7%) as buyers race to beat crushing new tariffs. This surge comes amid a perfect storm: Chinese domestic milk production has plummeted below cost at .40/cwt, the recovering hog industry is driving unprecedented whey demand, and trade wars have created clear winners (New Zealand with duty-free access) and losers (US facing prohibitive 125% tariffs). The timing couldn’t be more critical – China implemented initial 10% tariffs on US dairy products on March 10th before escalating to levels that effectively slam the door on American suppliers, reshaping global dairy supply chains virtually overnight. While most categories show strength, infant formula remains the exception with imports plummeting 35% due to China’s birth rate collapse, creating a market where overall volume shrinks yet premium segments thrive.

KEY TAKEAWAYS

  • Chinese buyers are stockpiling whey at record levels – March imports reached 67,812 metric tons, the highest monthly volume in nearly four years, driven by both tariff fears and surging demand from China’s recovering pig industry following African Swine Fever
  • New Zealand dominates as US faces extinction in China – With duty-free access as of January 2024, New Zealand has captured nearly 46% of China’s dairy imports and dominates growing butter/cheese segments, while American suppliers face devastating 125% tariffs that effectively eliminate export opportunities
  • Domestic production crisis creates import opportunities – Chinese milk prices have fallen to $19.40/cwt (15% below last year), well below production costs, forcing smaller operations out of business and creating a supply gap that imports must fill
  • Trade policy now outweighs market fundamentals – Geopolitical tensions have replaced traditional economic signals as the primary driver shaping dairy trade flows, requiring exporters to develop new strategic approaches focused on policy risk rather than just price competitiveness
  • Category-specific approach critical for success – While overall dairy imports grow, the infant formula market has collapsed by 35% due to demographic challenges, highlighting how success requires targeted strategies for specific segments rather than broad-brush approaches
China dairy imports, dairy trade war, global dairy market, New Zealand dairy exports, US dairy tariffs

Chinese buyers are scrambling to secure dairy supplies amid escalating trade tensions, with March import volumes surging across most categories. Whey imports exploded to 67,812 metric tons – a stunning 41.7% jump from last year – while cheese imports climbed 8.6% and whole milk powder jumped 30.7%. Behind these dramatic numbers lies a perfect storm of factors: buyers racing to beat crippling tariffs, domestic milk production faltering below cost, and shifting supplier dynamics that have New Zealand dairy farmers celebrating while American exporters face disaster. The new trade landscape creates clear winners and losers that will reshape dairy markets for years.

SupplierMarket PositionKey Trends (Jan-Feb 2025)Key Challenges (as of April 2025)
New ZealandDominant (46% share)Strong growth in butter, cream, cheeseNone – enjoys full duty-free access
European UnionMajor SupplierOverall volume down 16.5%; strength in specific categoriesAnti-subsidy investigation by China
United States#3 SupplierSignificant decline expectedFacing prohibitive 125% tariffs
AustraliaKey SupplierStrong performance in cheeseThere are fewer trade barriers than the US/EU

Chinese Buyers Stockpile Whey as Tariff Deadline Looms

Talk about planning! Chinese importers dramatically accelerated their whey purchases in March, pushing low-protein whey imports to their highest monthly volume in nearly four years.

Why the sudden buying frenzy? It’s simple – they’re racing against the tariff clock. The United States has dominated China’s whey market, supplying nearly 46% of its imports in early 2025. However, with US-China relations deteriorating and new Trump administration tariffs looming, Chinese buyers knew the party wouldn’t last forever.

“This isn’t random stockpiling – it’s calculated risk management,” says dairy market analyst Zhang Wei. “Chinese feed mills and food processors can see the writing on the wall with these trade tensions.”

The timing couldn’t be more critical. It was just the beginning when China slapped that initial 10% tariff on US dairy products on March 10th. By early April, we’d seen those rates skyrocket to a prohibitive 125%, slamming the door on American suppliers. For perspective, China represents about $584 million in annual US dairy exports – making it America’s third-largest market.

African Swine Fever Recovery Drives Whey Demand Surge

Isn’t it interesting how seemingly unrelated factors create market opportunities? The surge in whey imports directly connects to China’s ongoing recovery from African Swine Fever (ASF), which devastated their hog industry starting in 2018.

This highly contagious virus forced the mass culling of infected herds, slashing China’s swine inventory by 40-60%. But here’s what matters now – their pig industry is recovering, driving serious whey demand for piglet feed.

Remember how US whey shipments to China plummeted 41% in August 2023 compared to the previous year? That trend has completely reversed as China’s pig farms rebuild. But there’s another critical factor at work – industry restructuring. After ASF decimated small farms, larger commercial operations gained market share. These bigger farms wean piglets earlier, which means they use more whey per pig throughout its lifecycle.

Before ASF hit, China’s whey consumption averaged about 0.45 kg per piglet. That figure’s climbing as consolidation continues, potentially driving even greater demand as herds fully recover. But here’s the billion-dollar question: where will all that whey come from now that US suppliers face prohibitive tariffs?

Cheese and Milk Powders Also Show Strength

It’s not just whey we are seeing dramatic increases. Chinese cheese imports reached 16,726 metric tons in March, climbing 8.6% above year-ago levels. Unlike whey, where American suppliers dominated, New Zealand has captured the lion’s share of China’s cheese market.

Let’s face it – New Zealand dairy exporters are now drinking champagne. Their free trade agreement gives them duty-free access to China while American suppliers face crushing tariffs. The numbers tell the story – New Zealand and Australia supplied about 80% of China’s cheese imports in early 2025.

New Zealand’s strong milk production season has allowed them to pivot manufacturing toward products that are seeing increased Chinese demand. Their timing couldn’t be better as trade barriers knock out their biggest competitor.

Milk powder imports also rebounded in March, with whole milk powder surging 30.7% to 43,232 metric tons, while skim milk powder eked out a slight 0.7% gain. This marks a reversal from earlier trends, as China reduced powder imports during January and February.

Domestic Production Challenges Create Import Opportunities

Have you noticed China’s domestic dairy sector is caught in a painful price-cost squeeze? Chinese milk prices have been spiraling downward since late 2021, hitting $19.40/cwt in January 2025 – well below the cost of production for many farmers.

Rabobank forecasts a 2.6% decline in China’s milk output in 2025, marking the second consecutive year of contraction. With farmgate milk prices 15% lower year-over-year in February, Chinese farmers have little incentive to expand production.

Many smaller operations are exiting the business entirely, while even larger farms are scaling back production plans. This domestic supply contraction creates a fundamental gap that imports must fill, especially as Chinese consumers show signs of increasing dairy consumption in specific categories.

Early 2025 economic data indicated stronger-than-expected results, potentially boosting consumer purchasing power for dairy products. But here’s the kicker – the escalating trade war threatens to undermine this economic momentum. China exported nearly $440 billion worth of goods to the United States last year, and economists warn the trade war will significantly impact China’s growth prospects.

Infant Formula: The One Category Bucking the Trend

While most dairy categories are growing, infant formula tells a different story. China’s imports fell by a shocking 14.8% in 2024, and the downward trend has only accelerated in 2025, with imports down 35% in the first half of the year compared to 2024.

The reason? It’s simple demographics. China’s birth rate has collapsed, with annual births plummeting by half between 2016 and 2023 – from 18.7 million to just 9 million babies. One food industry analyst bluntly called it a “crisis” for the infant formula industry.

But even within this shrinking market, there are fascinating bright spots. Several foreign infant formula brands achieved double-digit growth in 2024 by focusing on the premium segment, which expanded to 37% of the market from 32.8% in 2023.

Isn’t that typical of China’s evolving consumer landscape? Even as the overall market contracts, premium and specialized segments grow. Health-conscious Chinese parents with means are increasingly seeking specialized formulas like hypoallergenic options and organic products. The lesson here? Companies with the right premium positioning can still win even in challenging markets.

New Supplier Landscape: Winners and Losers

The escalating US-China trade war has completely reshuffled the competitive landscape for dairy exporters to China, creating clear winners and losers overnight.

New Zealand: Popping Champagne

New Zealand couldn’t have scripted a better scenario if they tried. Already China’s largest dairy supplier with a 46% share of total dairy import volume in 2024, New Zealand’s position is further strengthened by its comprehensive free trade agreement. While US products face punishing tariffs of up to 125%, New Zealand’s dairy enters China completely duty-free as of January 2024.

The impact is already visible in trade data. New Zealand dominated China’s growing imports of butter (up 72.6%), cream (up 12.7%), and cheese (up 14.5%) during January-February. Fonterra, New Zealand’s dairy giant, reported January shipments significantly higher in volume and value, driven partly by Chinese demand.

United States: From Leader to Loser Overnight

For US dairy exporters, the situation has turned dire. The initial 10% tariff slapped on US dairy products on March 10th quickly escalated to a prohibitive 125% by mid-April, effectively pricing American dairy out of the Chinese market.

This goes far beyond just lost sales. The damage spreads throughout the supply chain as American processors scramble to find alternative markets for massive product volumes, potentially at lower prices.

The whey category faces the most immediate impact. With nearly half of US whey exports headed to China, processors now face the daunting challenge of redirecting these volumes to other markets. Can they pivot fast enough, or will we see a price collapse in other markets as diverted products flood in?

European Union: Caught in the Middle

The European Union occupies a middle ground in this trade reshuffling. EU dairy exports to China decreased by 16.5% in early 2025, but specific countries and products showed strength. France emerged as a key supplier of butter and cream, while Italy saw its fresh cheese exports to China soar by 38.7%.

A significant win for European suppliers came in March when China lifted restrictions on heat-treated German dairy products that had been imposed due to a foot-and-mouth disease case. This reopened a vital market for Germany, which sent nearly 25% of its non-EU dairy exports to China in 2023.

But can European suppliers capitalize on America’s misfortune? They face challenges with China’s ongoing anti-subsidy investigation into certain EU dairy imports, particularly cream and cheese varieties. This probe creates uncertainty for future EU access to the Chinese market. Are we seeing a pattern of China systematically targeting Western dairy suppliers while favoring New Zealand and Australia?

What This Means for Global Dairy Markets

The shifts in China’s import patterns have significant consequences for the Chinese domestic market and the broader global dairy landscape.

For US dairy farmers, the situation is harrowing. Not only are exports to China effectively blocked, but the redirection of products to other markets will likely pressure domestic prices. The USDA has slashed milk price forecasts for 2025, with analysts projecting Class III milk prices could drop by 35¢/cwt due to trade disruptions.

New Zealand and Australian producers stand to benefit as they fill the gap left by American suppliers. European exporters may find opportunities in specific categories like whey and lactose, which the US previously dominated, though they must navigate their trade tensions with China.

For Chinese consumers, the long-term impact will likely be higher prices for certain dairy products as tariffs force a shift to potentially more expensive suppliers. The country’s efforts to increase domestic production self-sufficiency may accelerate in response to these trade disruptions.

The Bottom Line: Navigating the New Dairy Order

Let’s face it – the surge in China’s March dairy imports reflects both opportunistic buying ahead of tariffs and genuine need driven by domestic production shortfalls. This short-term boost masks more profound structural changes in the global dairy trade that will persist long after the headlines fade.

Understanding these shifting trade patterns for dairy farmers worldwide is crucial for navigating the reality of the new market. Those in tariff-affected regions must explore alternative markets and possibly adjust production plans. At the same time, those with favorable access to China should capitalize on the opportunity while remaining vigilant about potential policy changes.

The dairy industry has always been cyclical, but today’s challenges extend beyond normal market fluctuations. The current trade war has fundamentally altered competitive dynamics in ways that will reshape dairy supply chains for years, requiring unprecedented adaptability from all market participants.

Are you positioned to thrive in this new landscape, or will you be caught flat-footed as markets shift? The winners will recognize these structural changes early and adapt their strategies accordingly. The losers? Those who expect things to go back to “normal” once this trade dispute resolves. The harsh reality is that we’re looking at a permanently altered dairy trade landscape – and the time to adjust is now.

Learn more:

Join the Revolution!

Join over 30,000 successful dairy professionals who rely on Bullvine Daily for their competitive edge. Delivered directly to your inbox each week, our exclusive industry insights help you make smarter decisions while saving precious hours every week. Never miss critical updates on milk production trends, breakthrough technologies, and profit-boosting strategies that top producers are already implementing. Subscribe now to transform your dairy operation’s efficiency and profitability—your future success is just one click away.

NewsSubscribe
First
Last
Consent

Send this to a friend