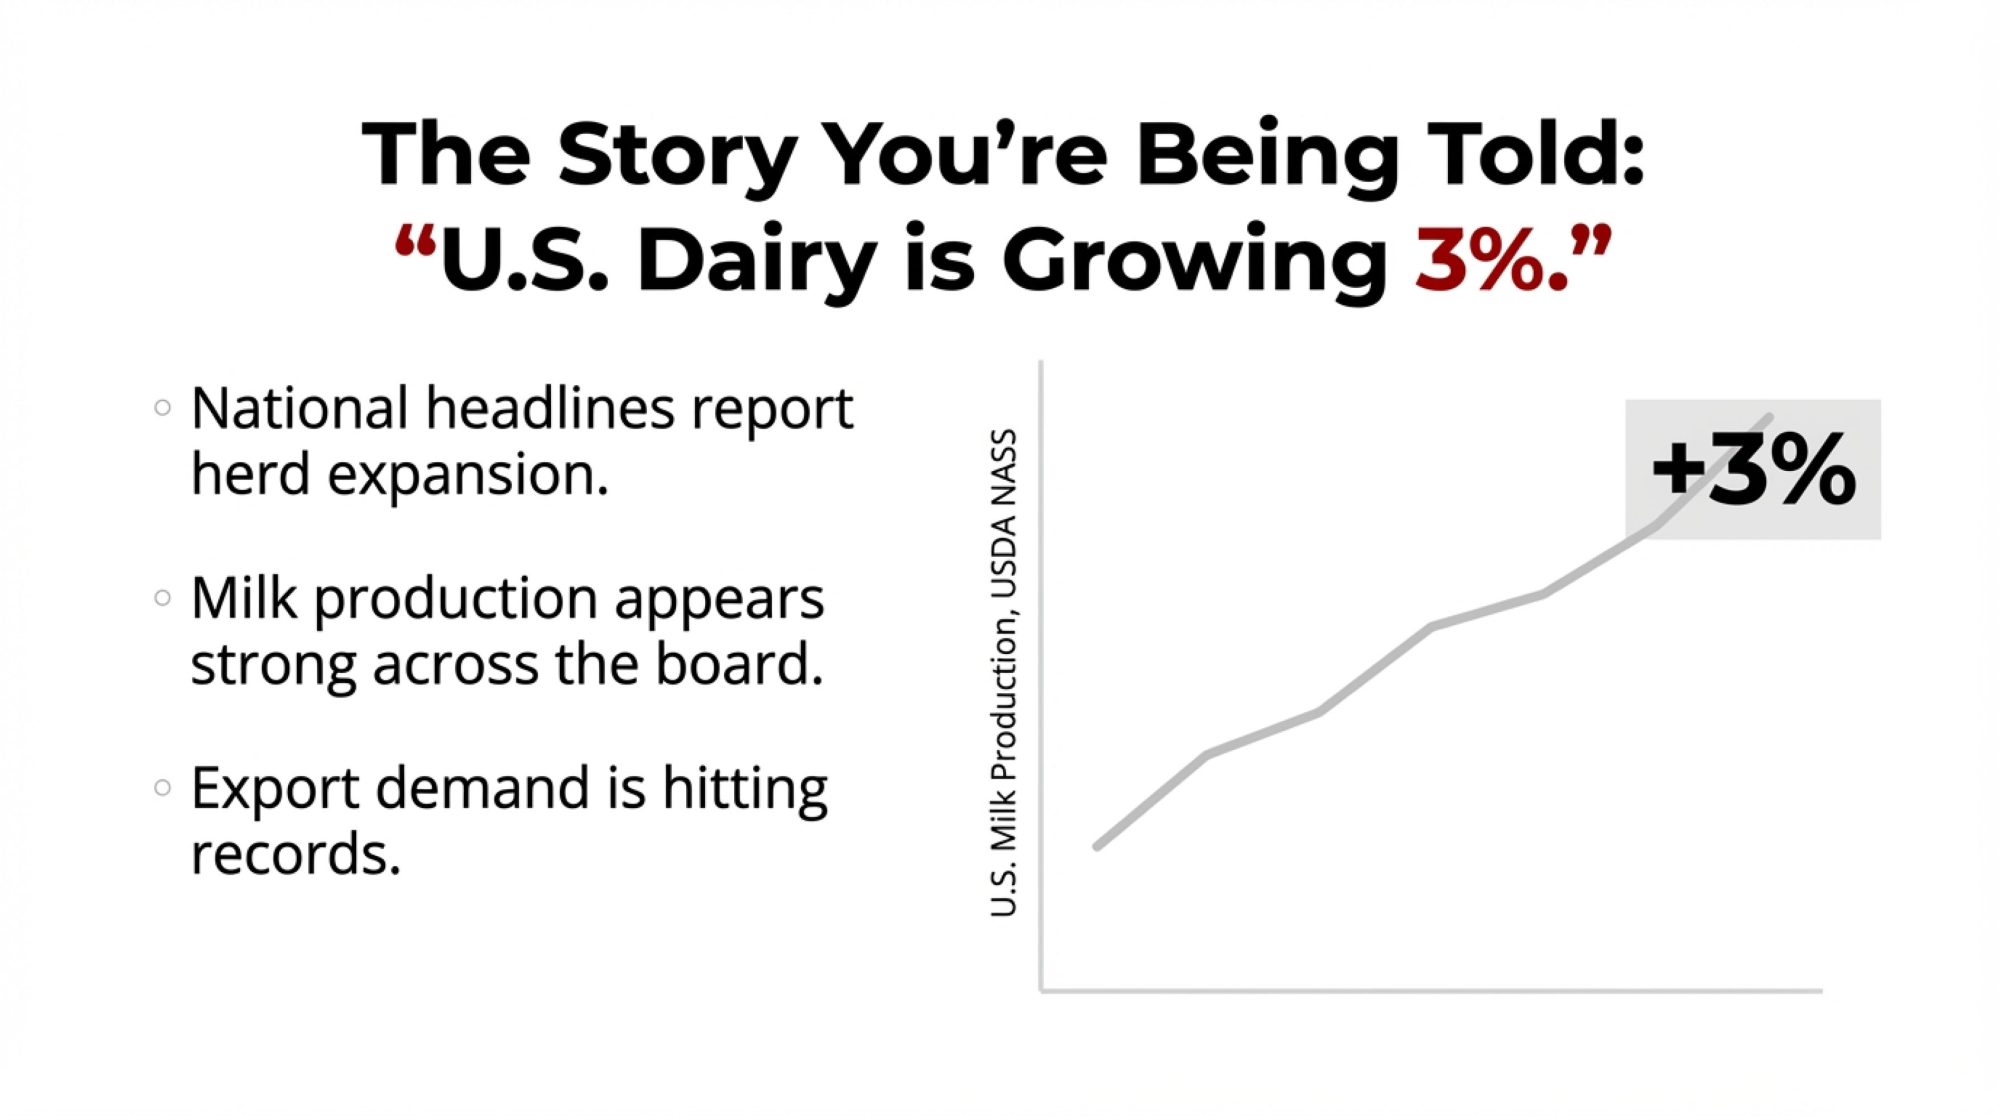
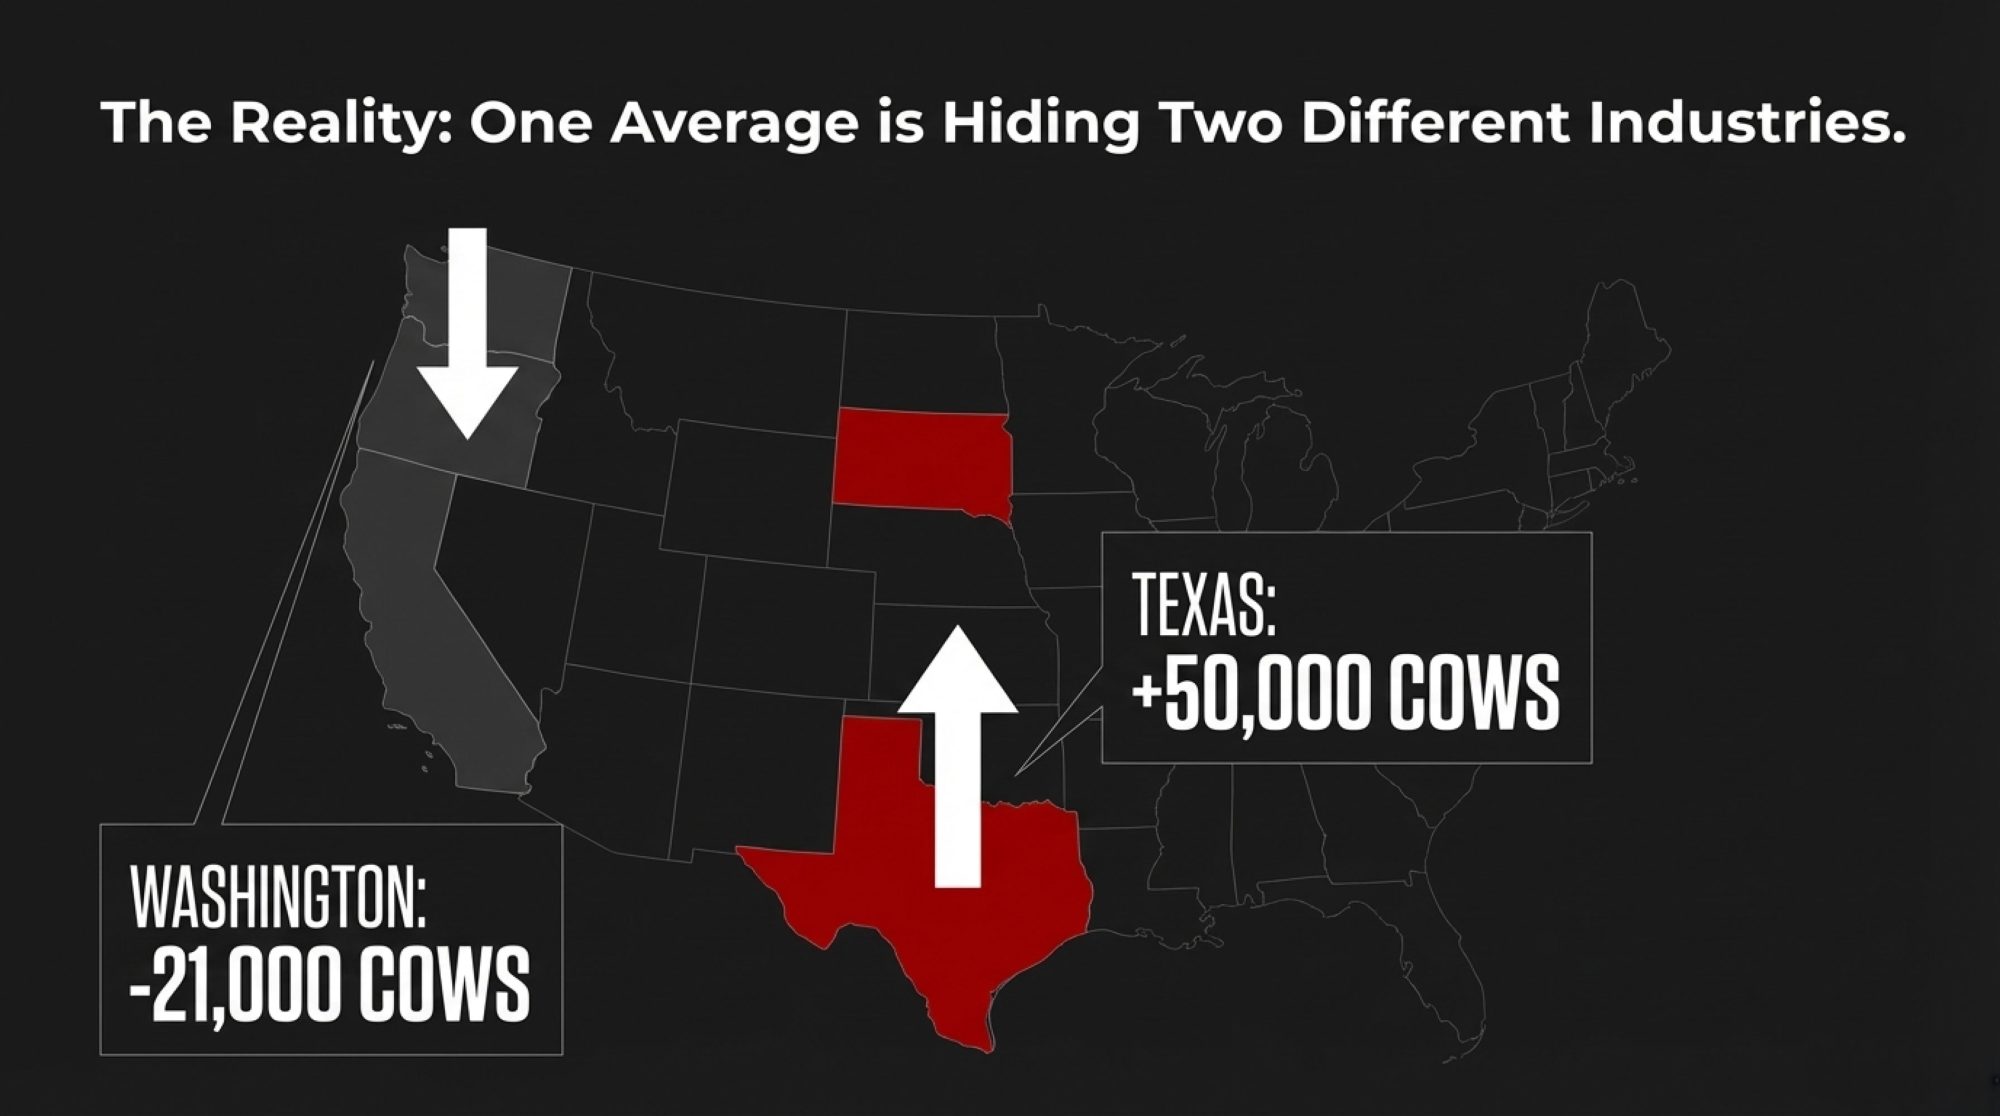
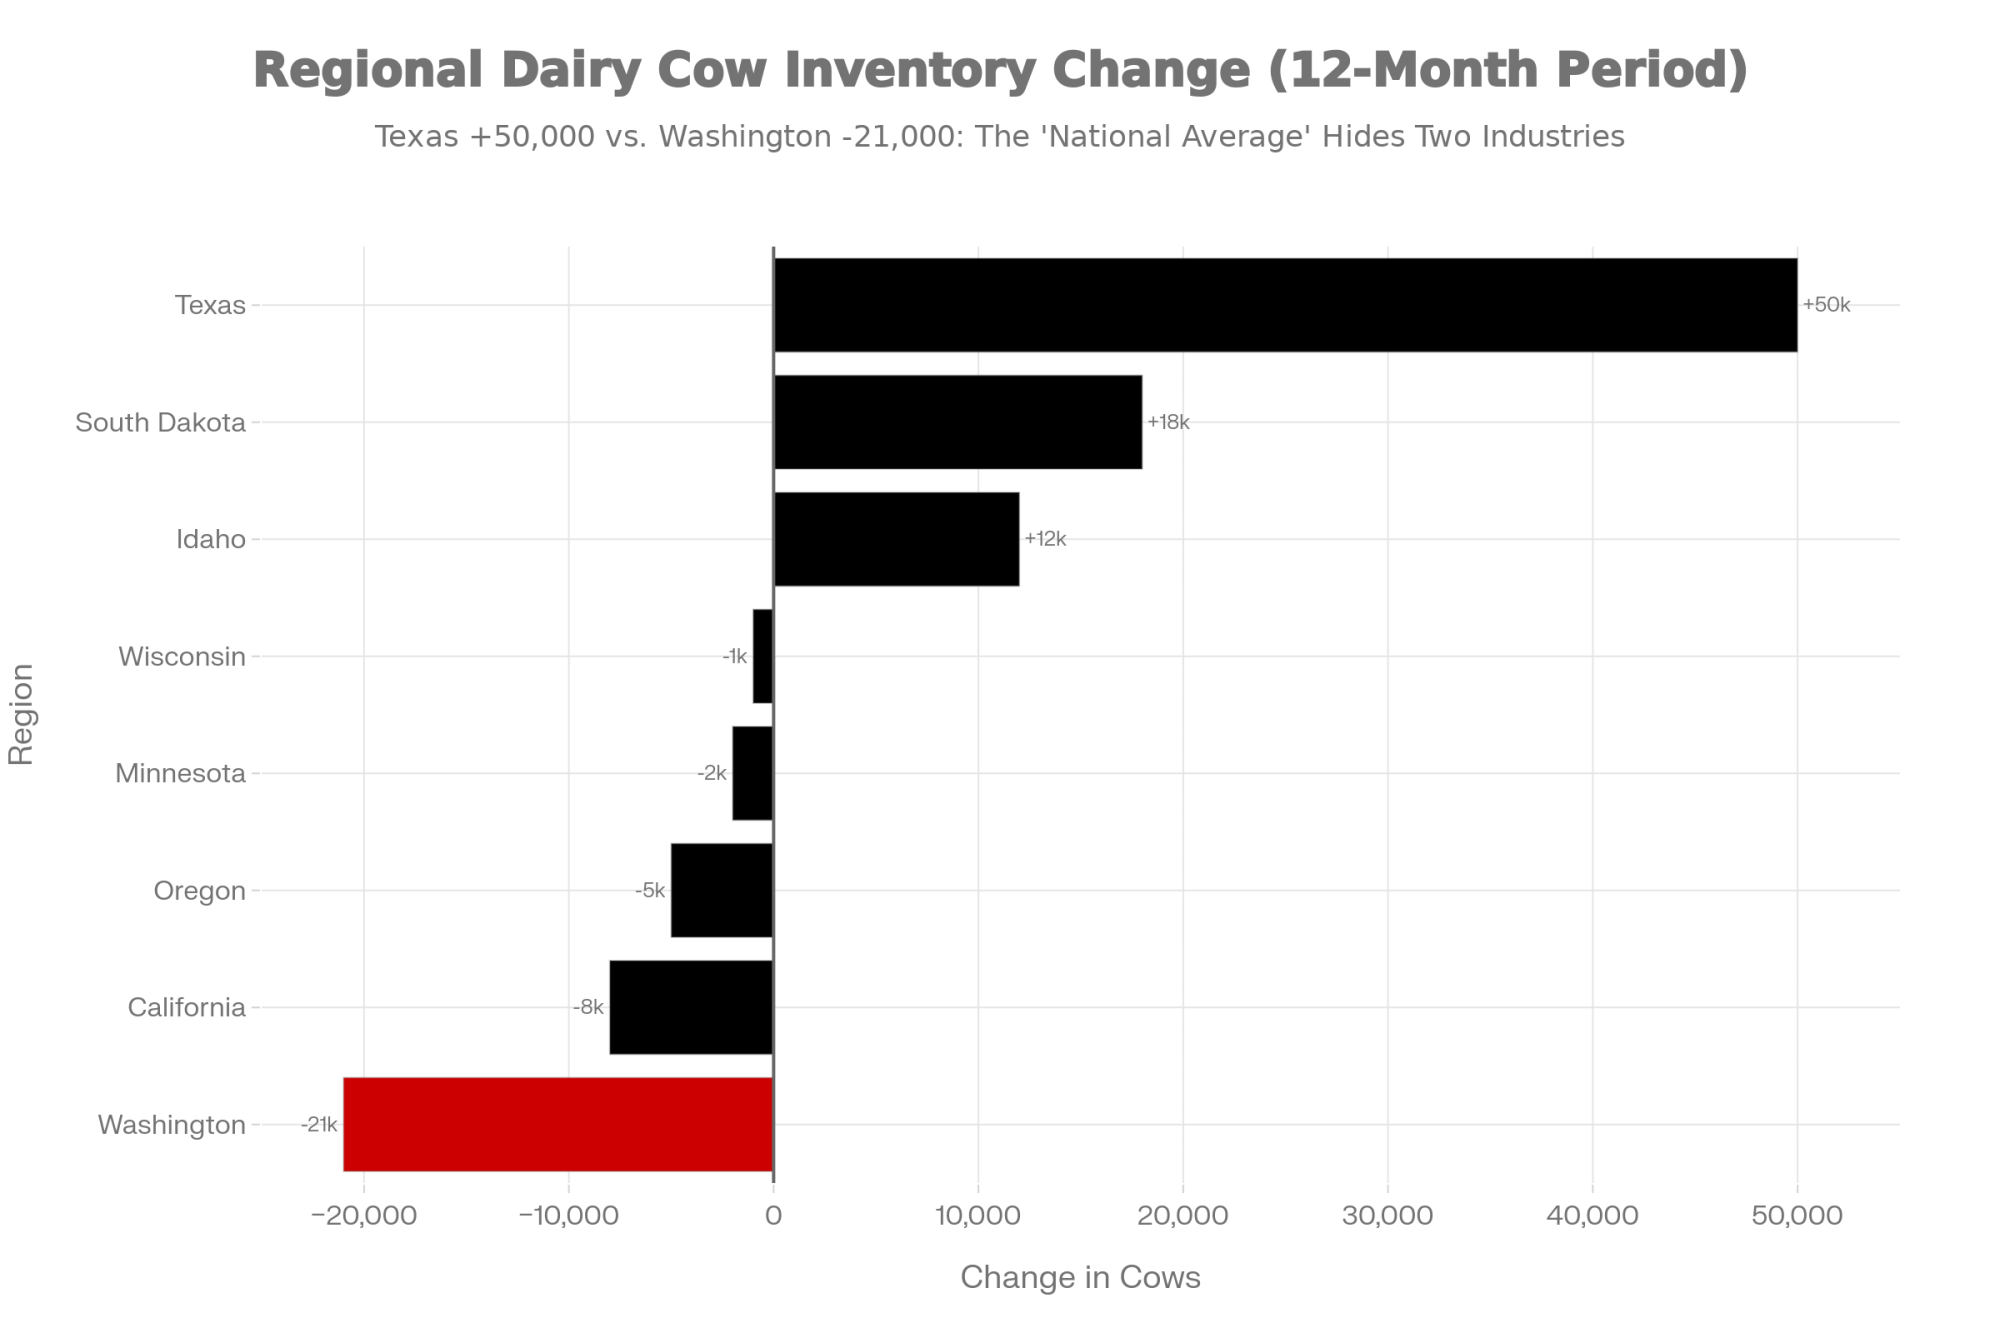
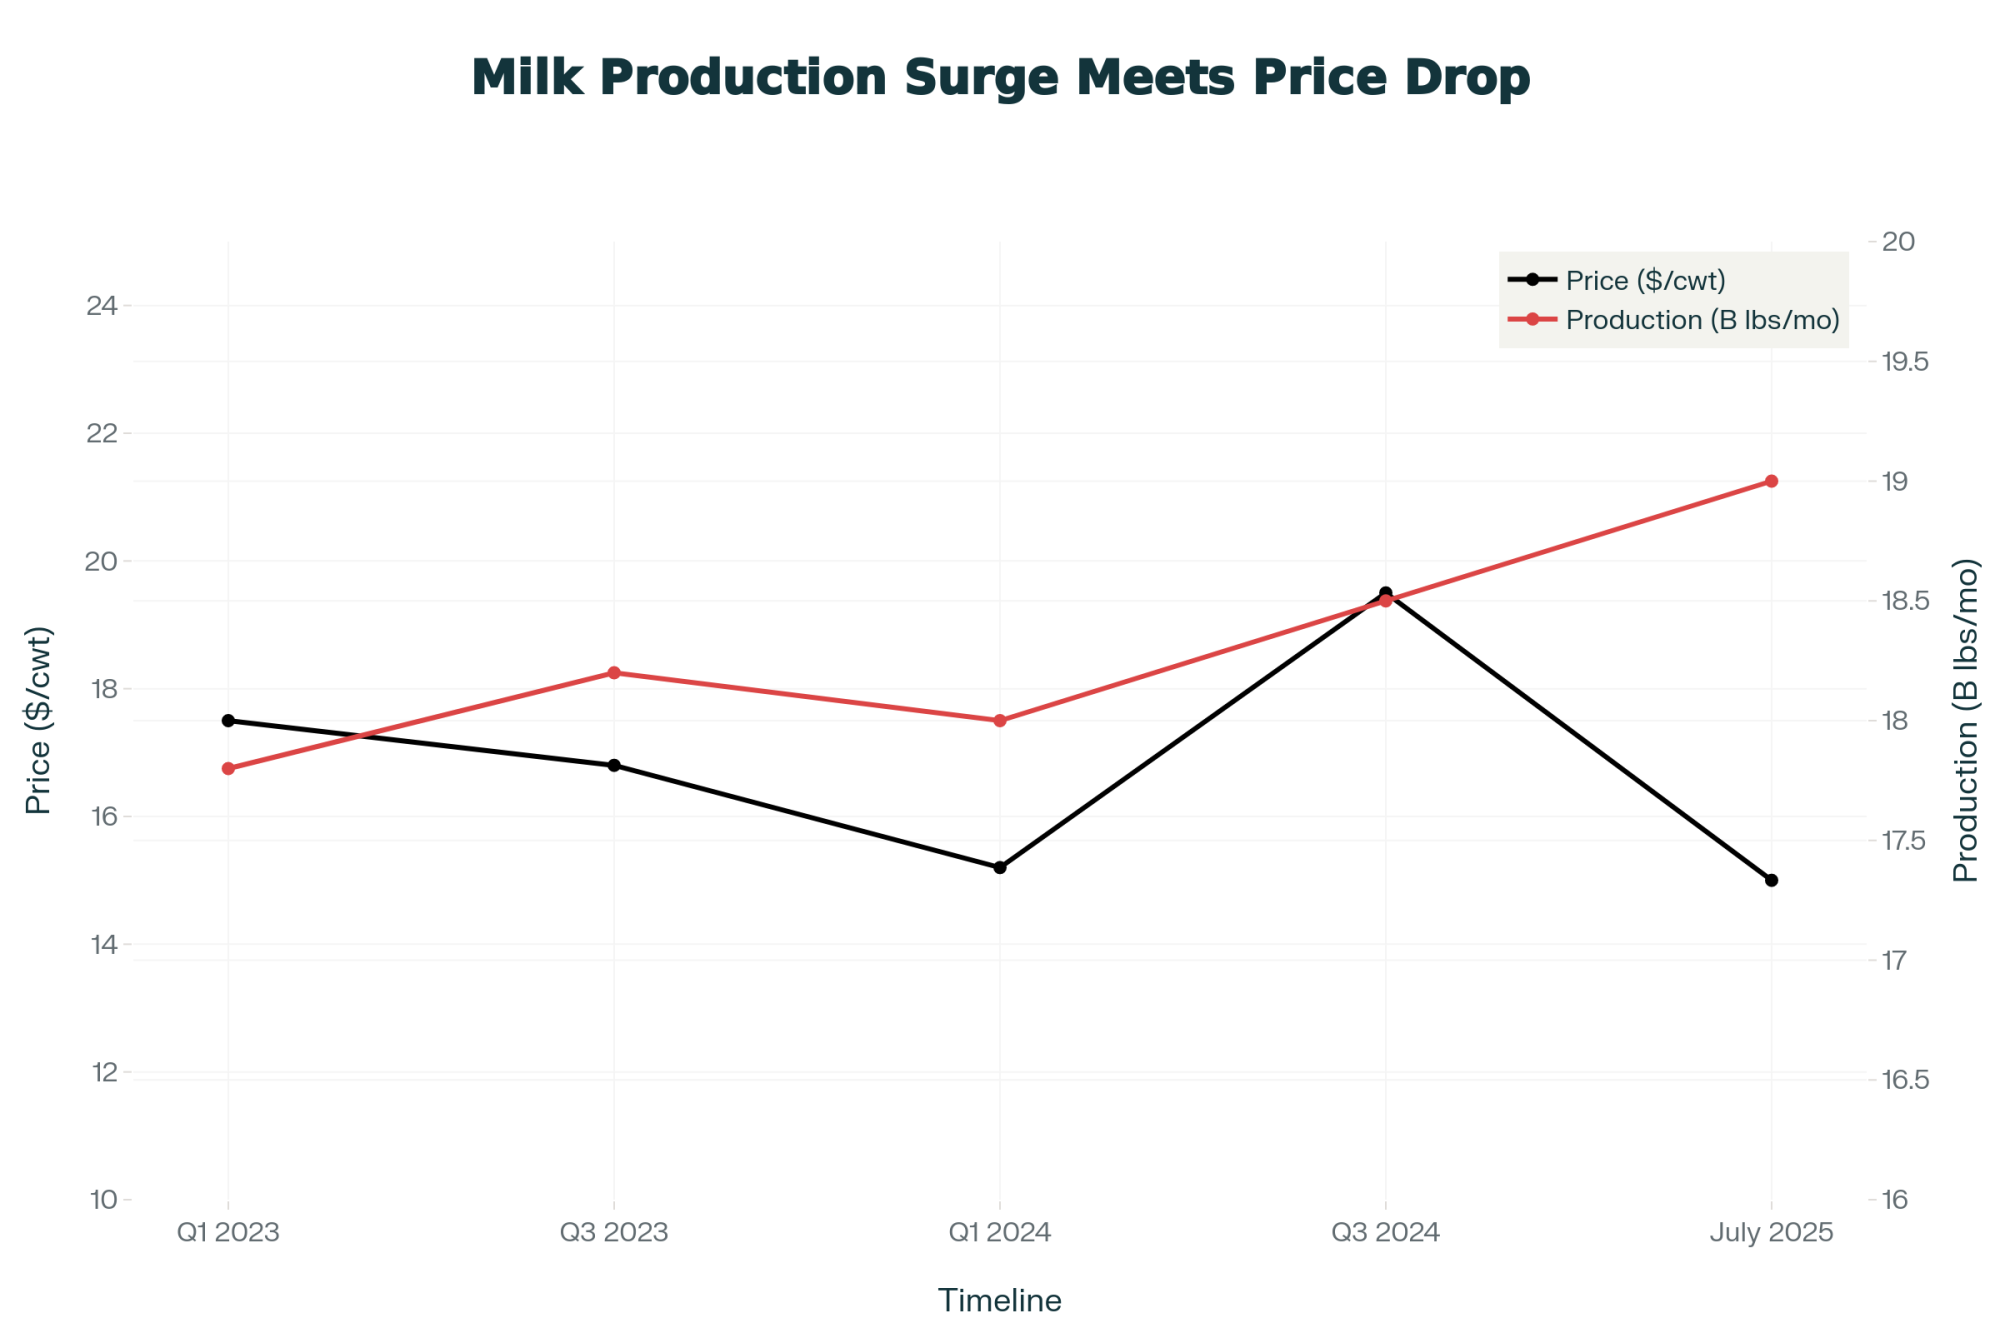
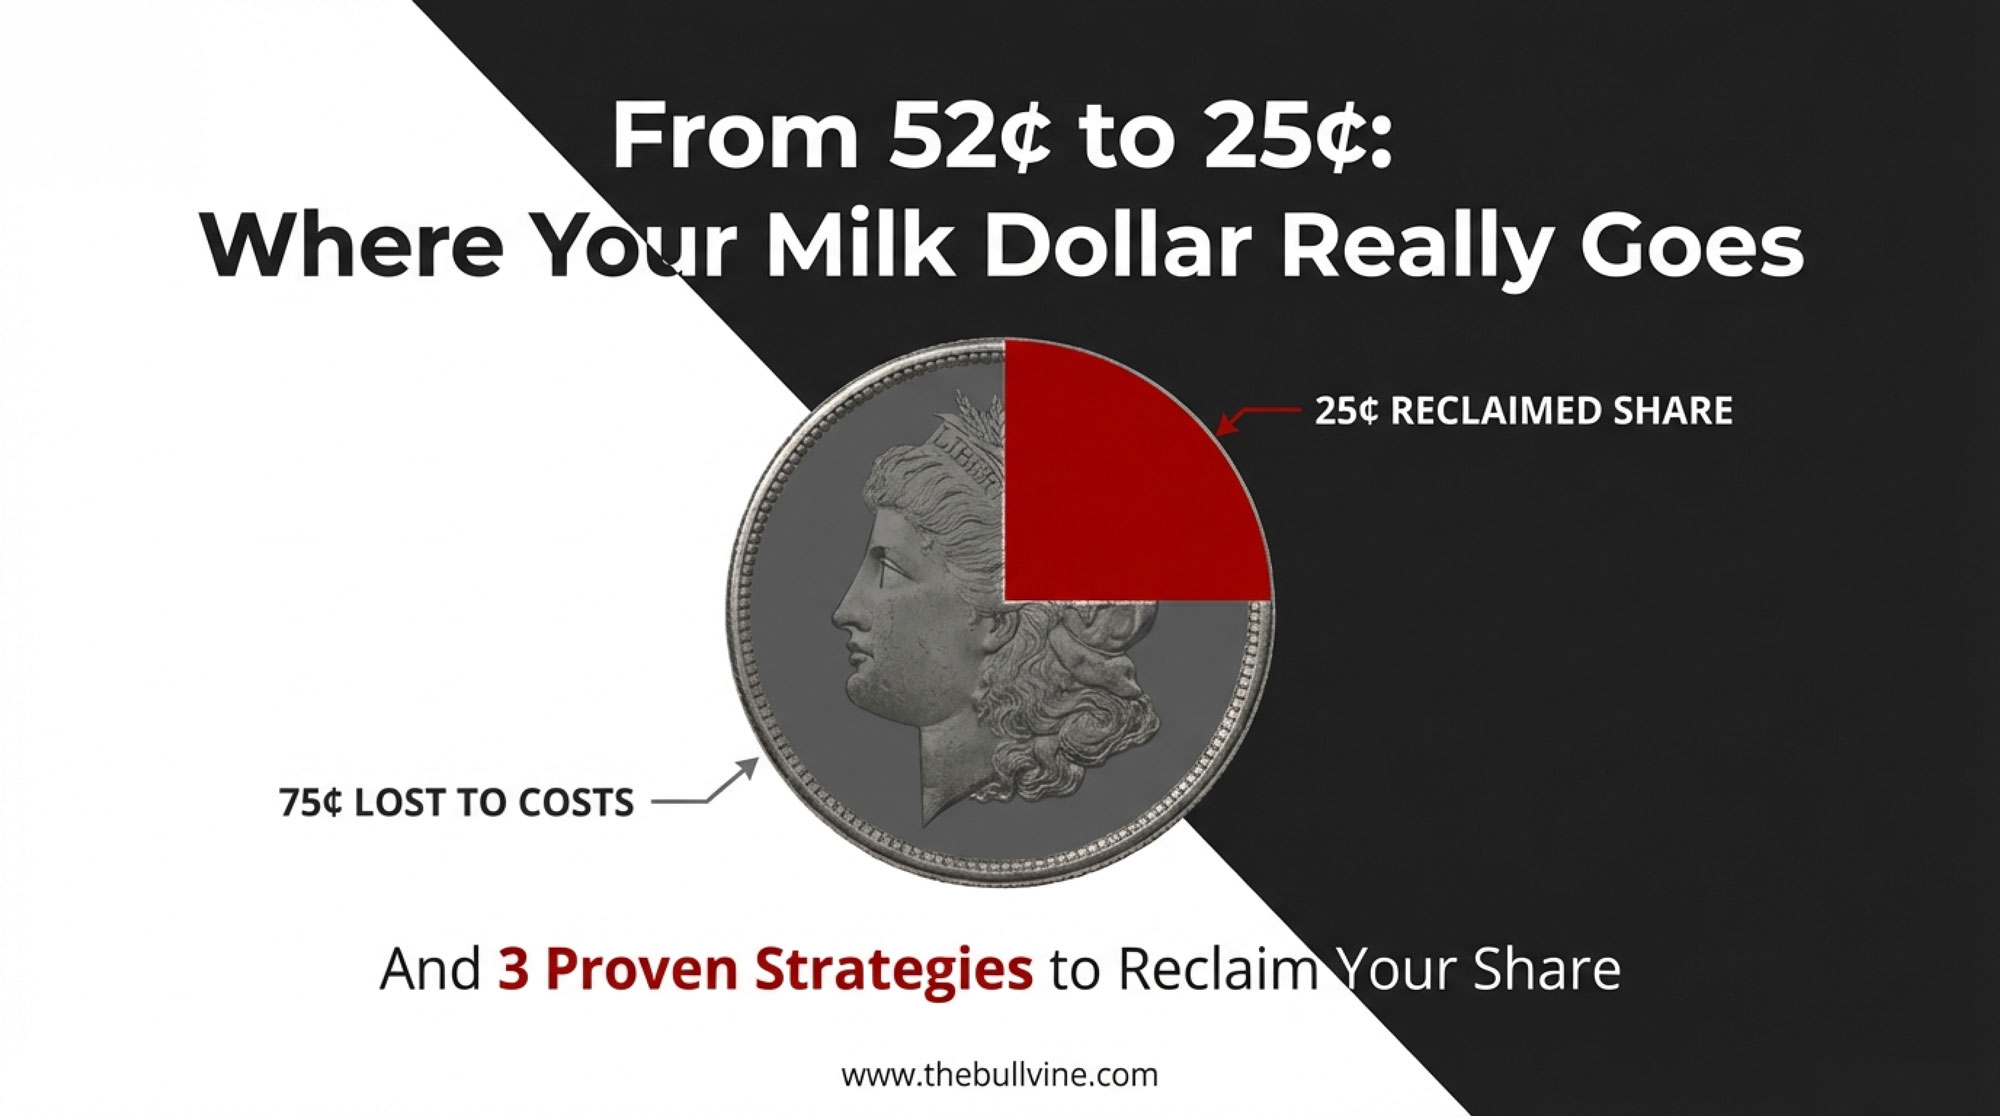
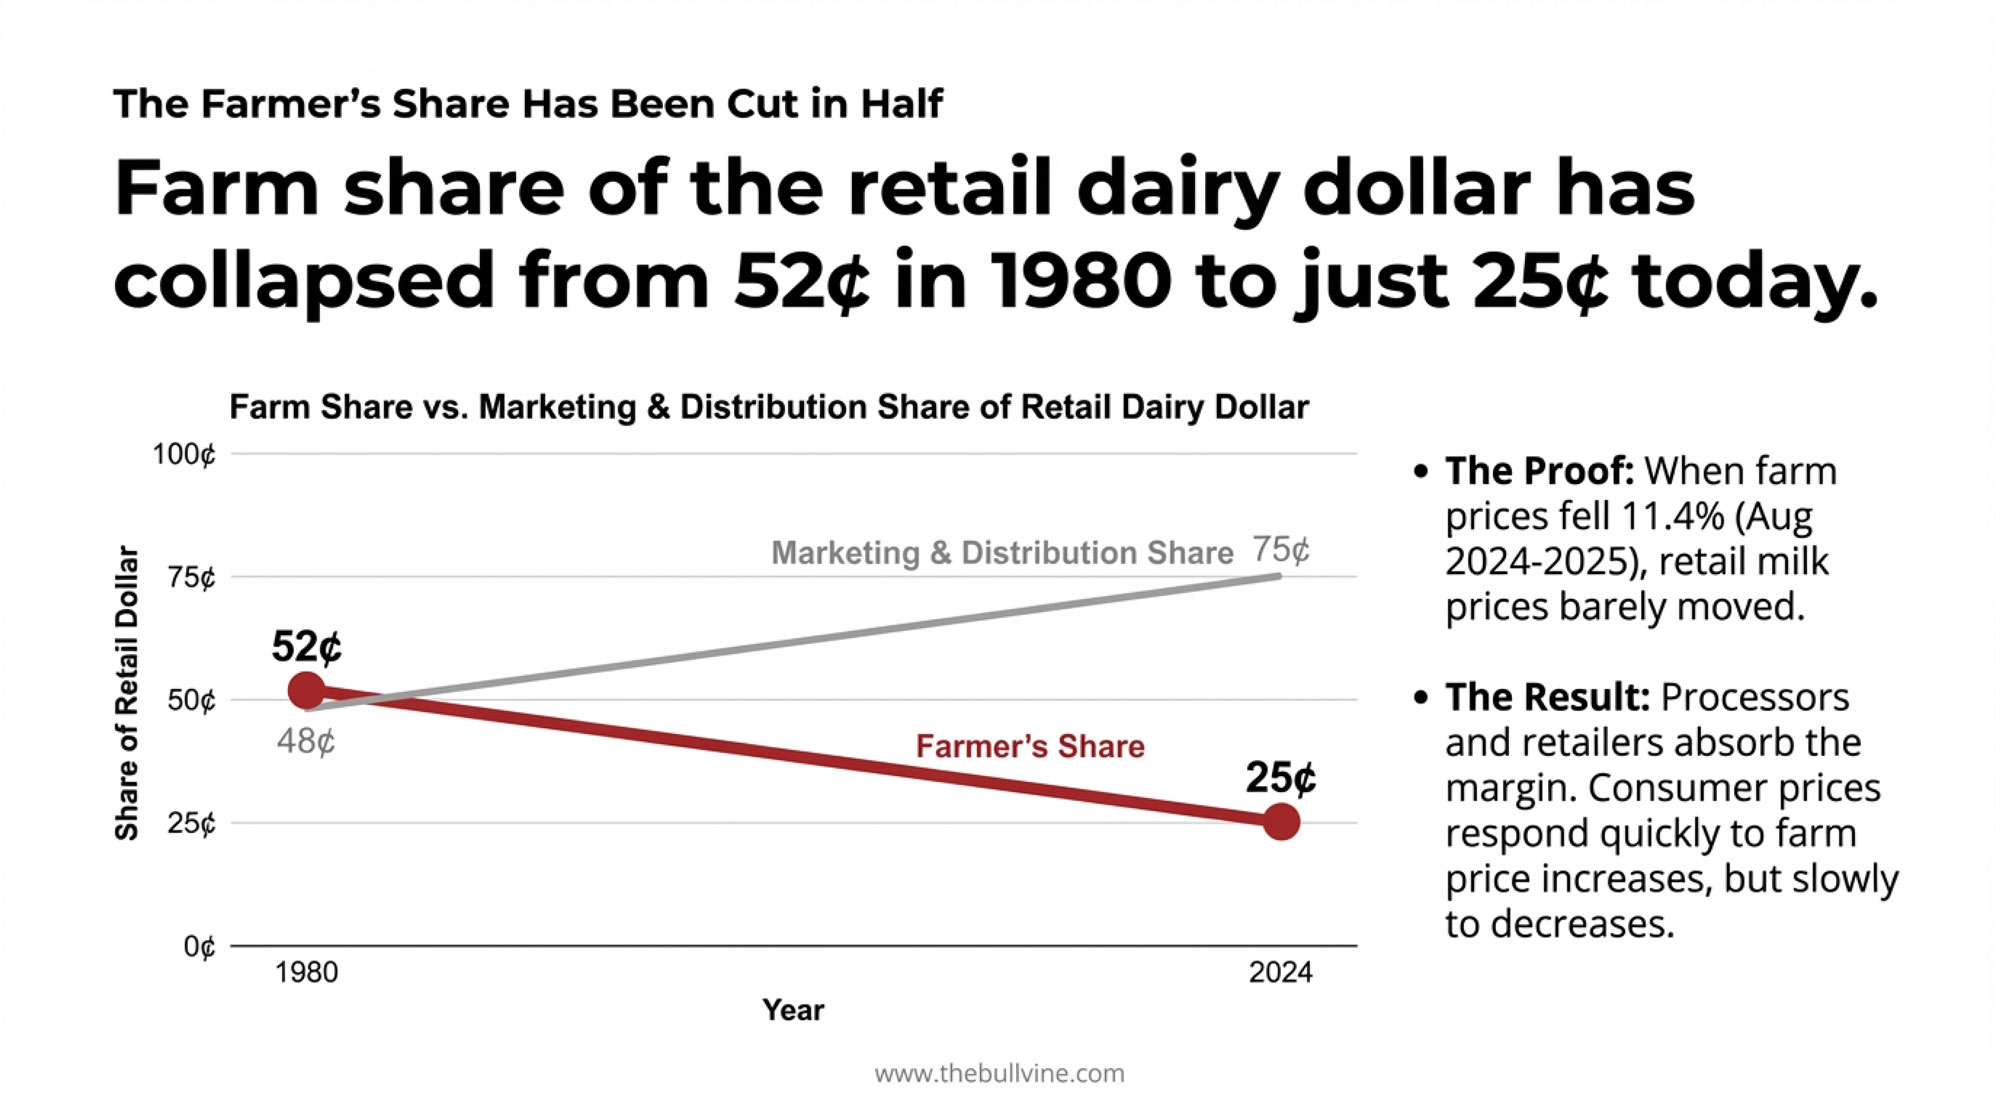
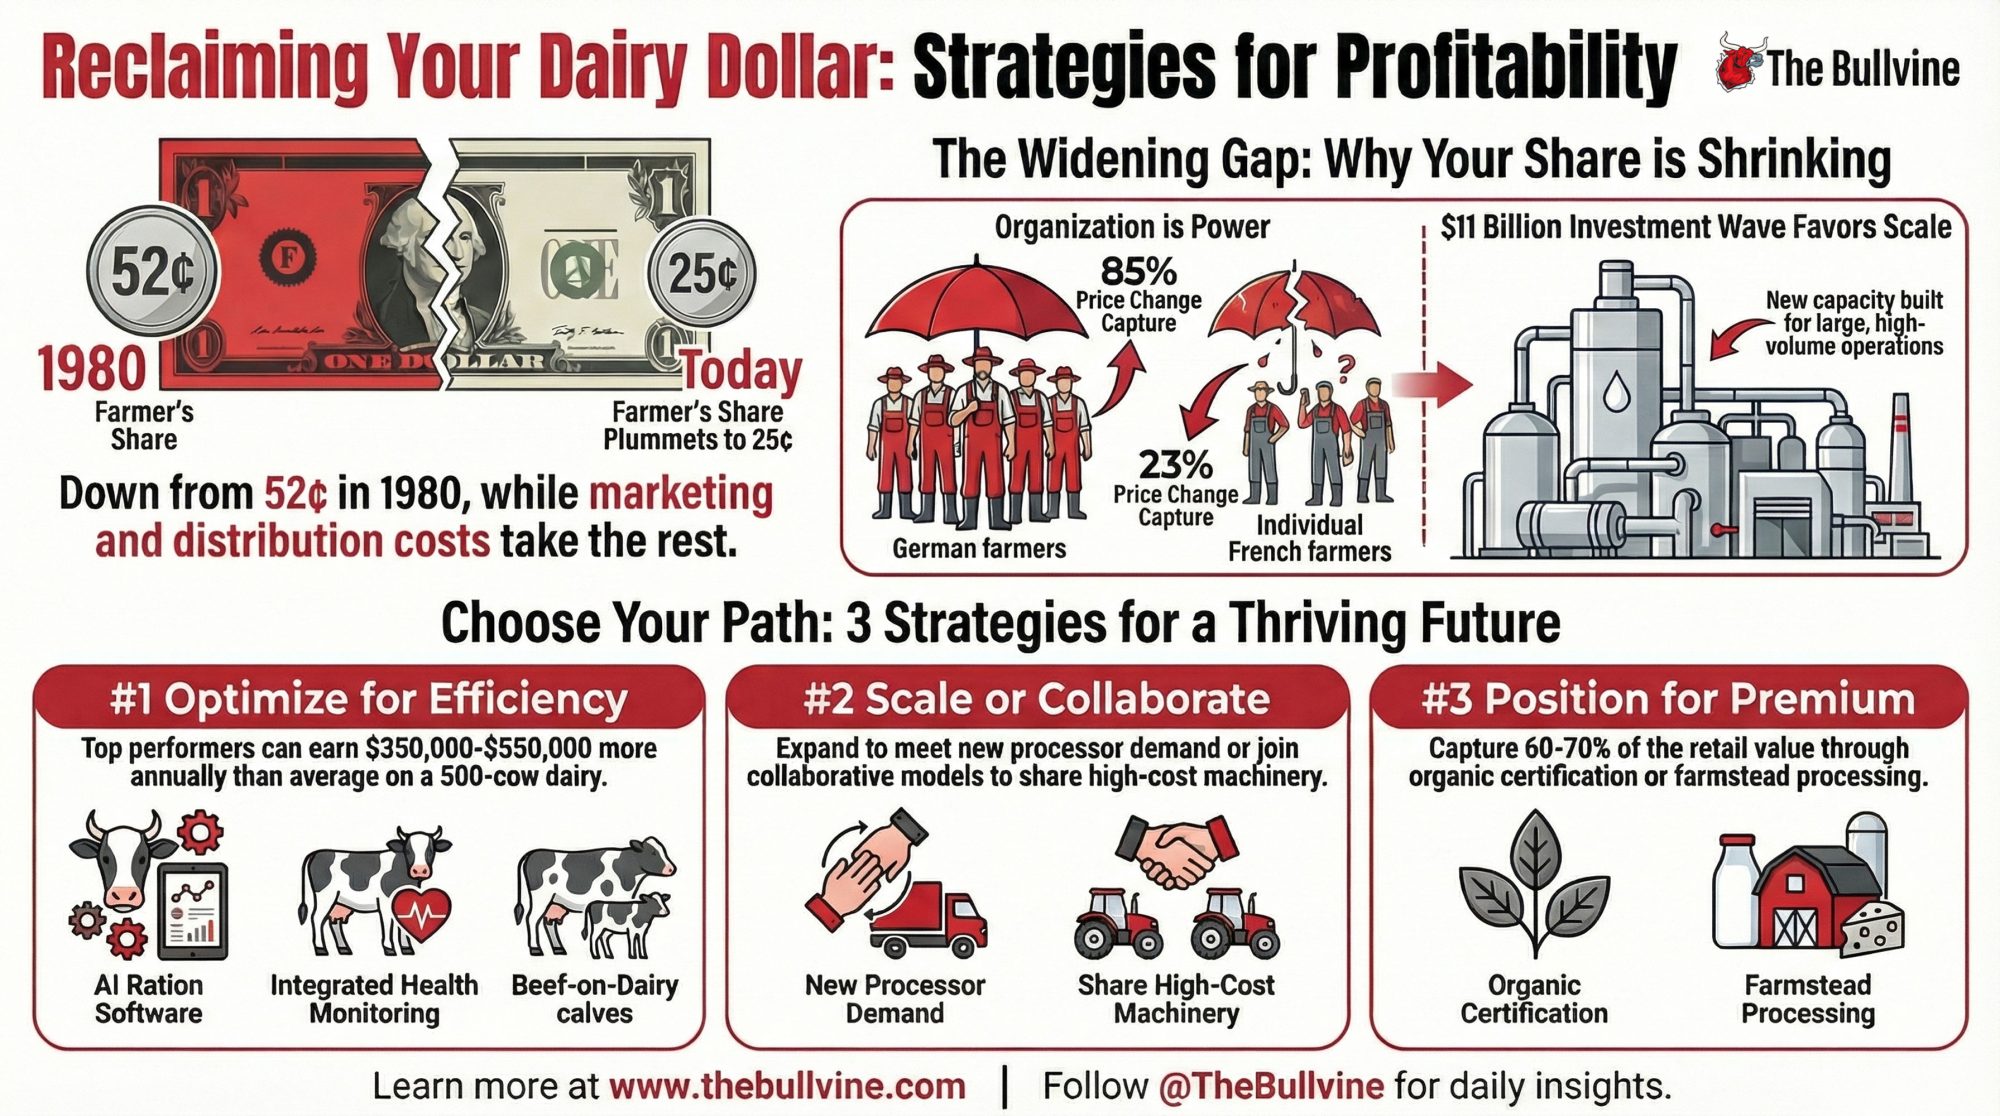
1980: Farmers got 52¢ of every dairy dollar. 2024: Just 25¢. Farm prices dropped 11% last year. Retail prices? Barely moved.
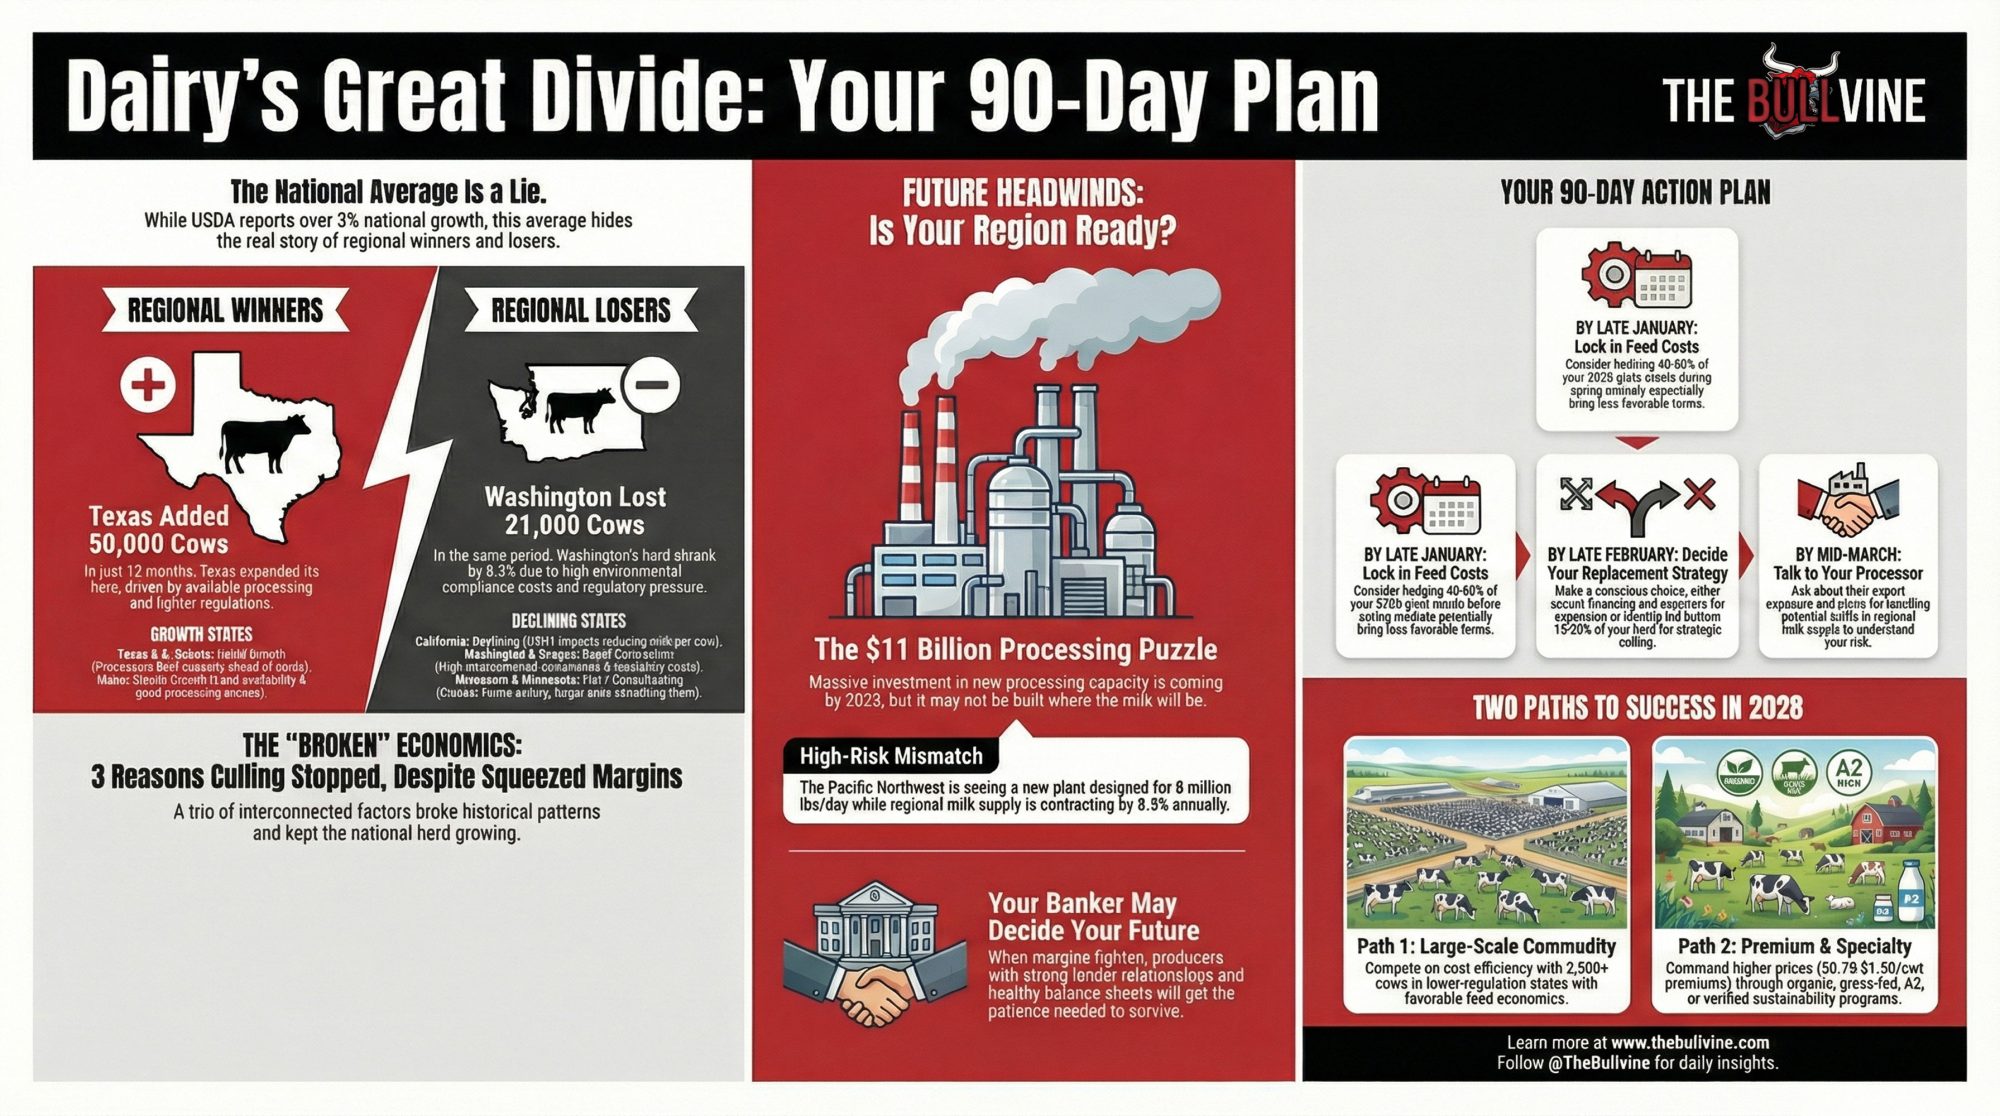
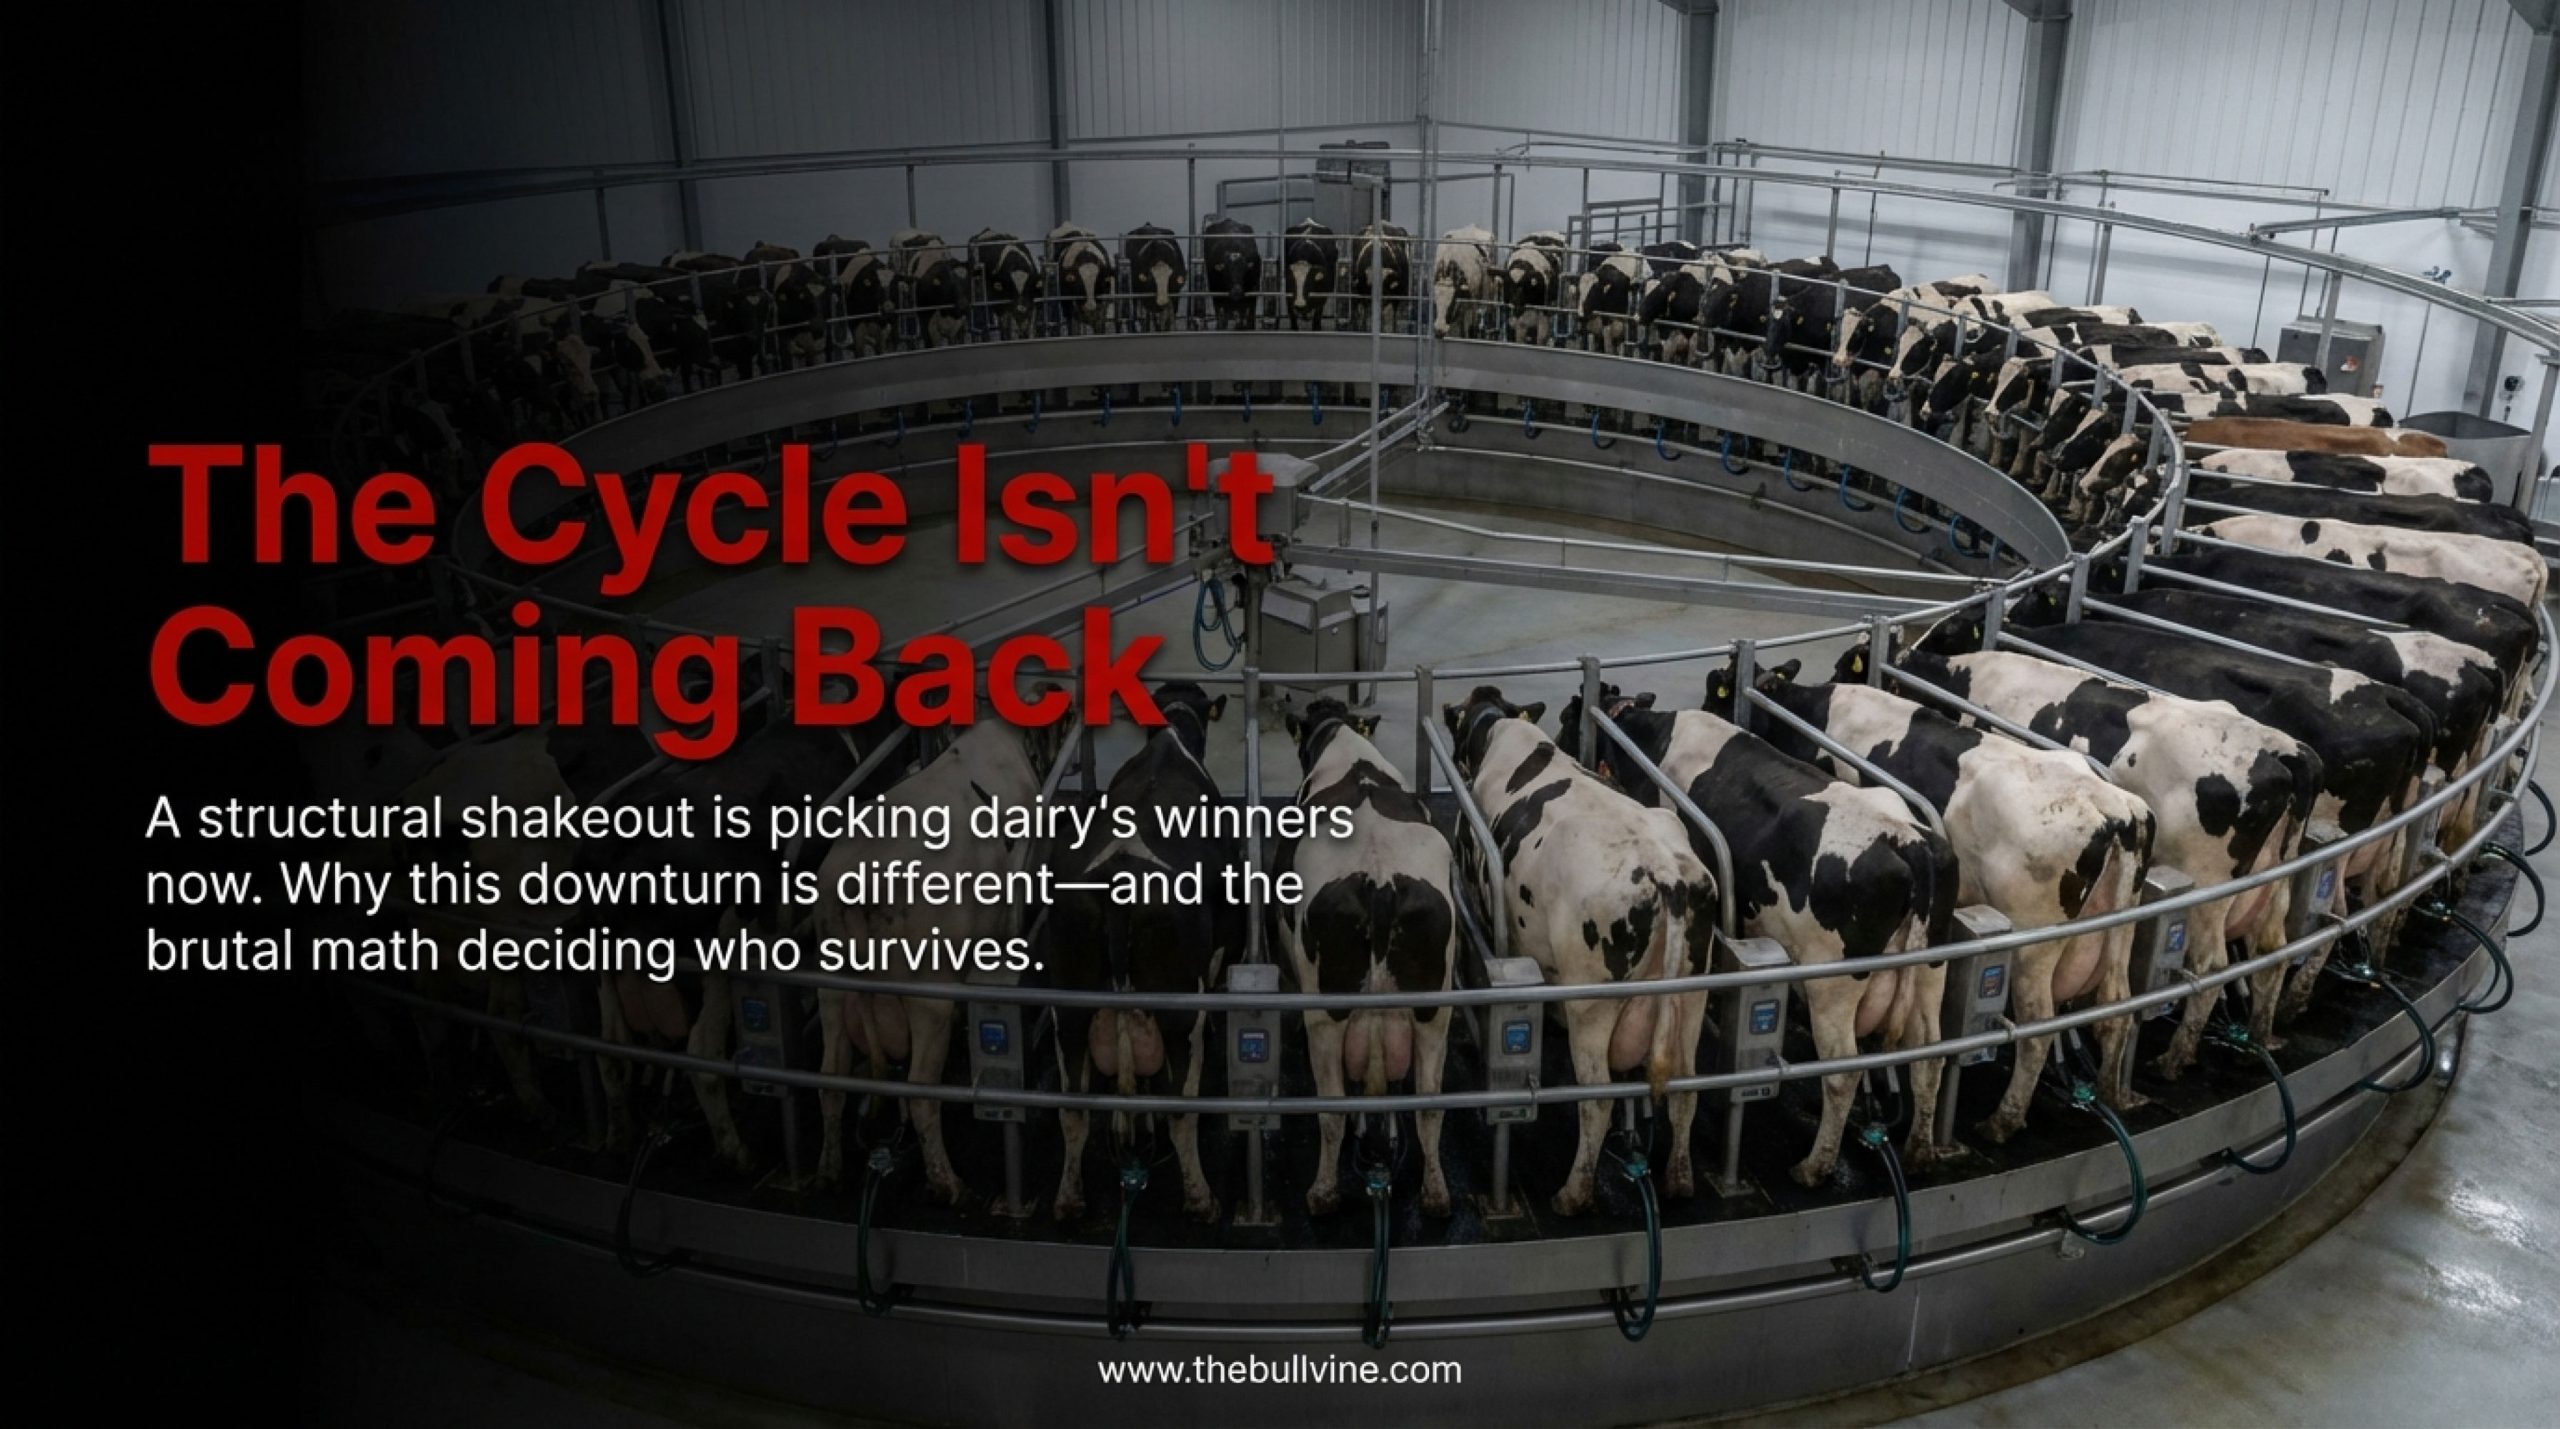
EXECUTIVE SUMMARY: A Wisconsin farmer did the math: he gets $1.07 for the milk in a gallon, selling for $4.89. That $3.82 gap isn’t new—but it’s widening. Farm share of the retail dairy dollar has dropped from 52 cents in 1980 to just 25 cents today, and when farm prices fell 11% last year, retail prices barely moved. So where does the money actually go? European research offers a surprising answer: farmer organization may matter more than processor consolidation. German farmers, working through strong cooperative structures, capture 80-85% of price transmission; French farmers negotiating individually capture just 23%. For mid-size U.S. operations, three strategic paths emerge—efficiency optimization (where top performers capture $350,000-$550,000 more annually than average), strategic scaling or collaboration, and premium market positioning. With $11 billion in new processing investment flowing toward facilities that favor large-scale supply, the time to choose your path is now.
I spoke with Mark recently, a dairy farmer who has been milking cows in central Wisconsin for 31 years. Last Tuesday, he stopped at the Kwik Trip in Marshfield after dropping a load at the cooperative and watched a young mother put a gallon of whole milk in her cart. The price tag read $4.89.
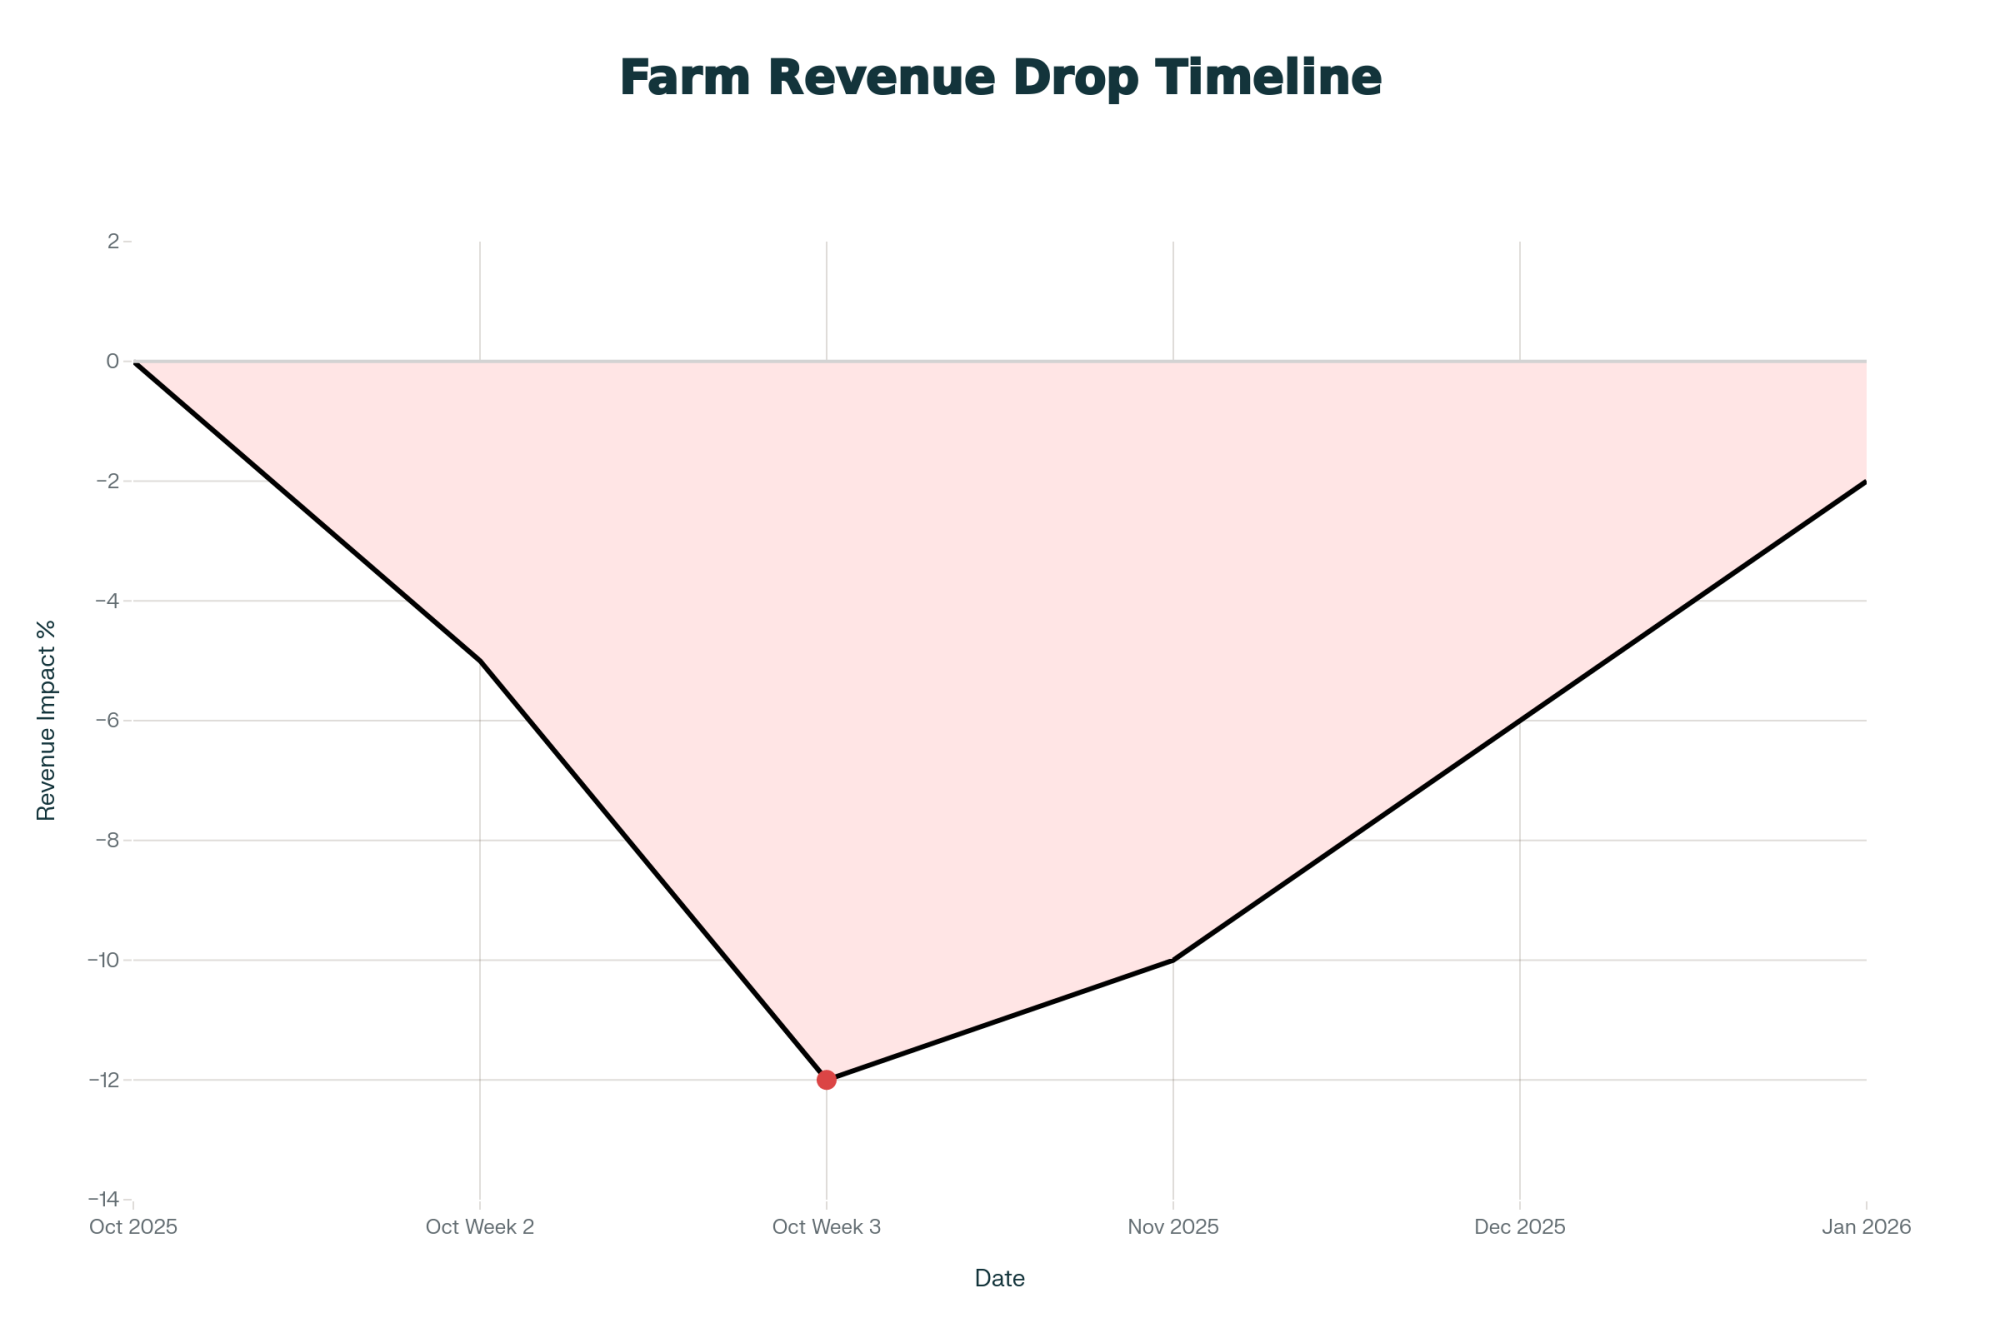
His milk check that morning showed $20.90 per hundredweight—down from $23.60 just twelve months earlier. USDA’s National Agricultural Statistics Service released those August 2025 numbers in September, and you know how it is… standing in that convenience store aisle, Mark did what every dairy farmer eventually does: the math.
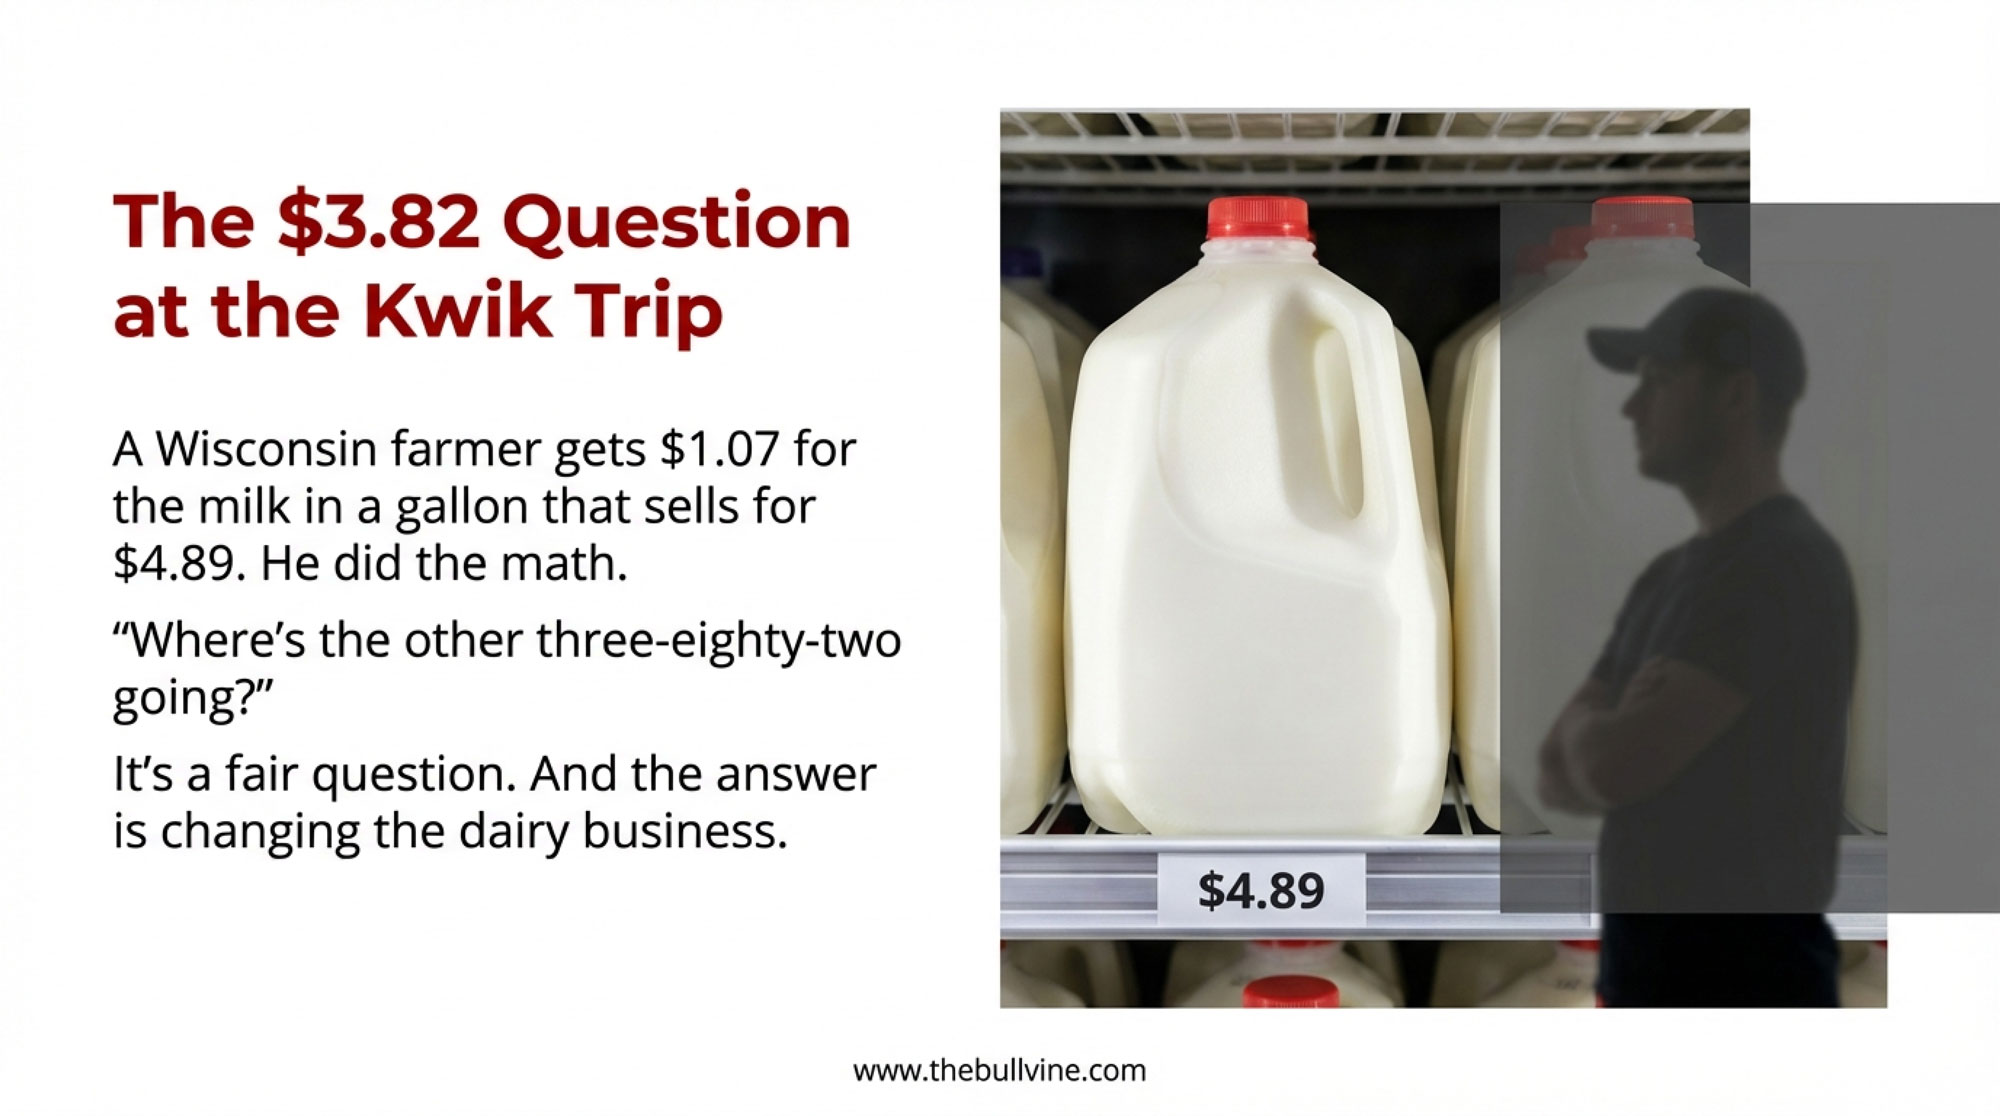
“I’m getting roughly a dollar-seven for the milk in that gallon,” he told me over coffee later that week. “She’s paying four-eighty-nine. Where’s the other three-eighty-two going?”
It’s a fair question. And thanks to some useful academic research coming out of Canada and Europe, we’re getting clearer answers—ones that have honestly changed how I think about dairy market dynamics.
The Dairy Dollar Has Shifted Over Time
Here’s what the historical data shows. And it’s worth understanding these numbers in context, because they tell us something important about structural changes in our industry.
THE DAIRY DOLLAR: WHAT WE KNOW
For every $1.00 consumers spend on dairy products today:
| Segment | 2024 Share | Change Since 1980 |
| Farm | $0.25 | ↓ from $0.52 |
| Marketing & Distribution | $0.75 | ↑ |
The marketing share includes processing, retail margins, transportation, and packaging. USDA ERS tracks farm share but doesn’t publish detailed breakdowns of marketing components—which is itself part of the transparency challenge we’ll get to later.
Source: USDA Economic Research Service, Price Spreads from Farm to Consumer, 2024
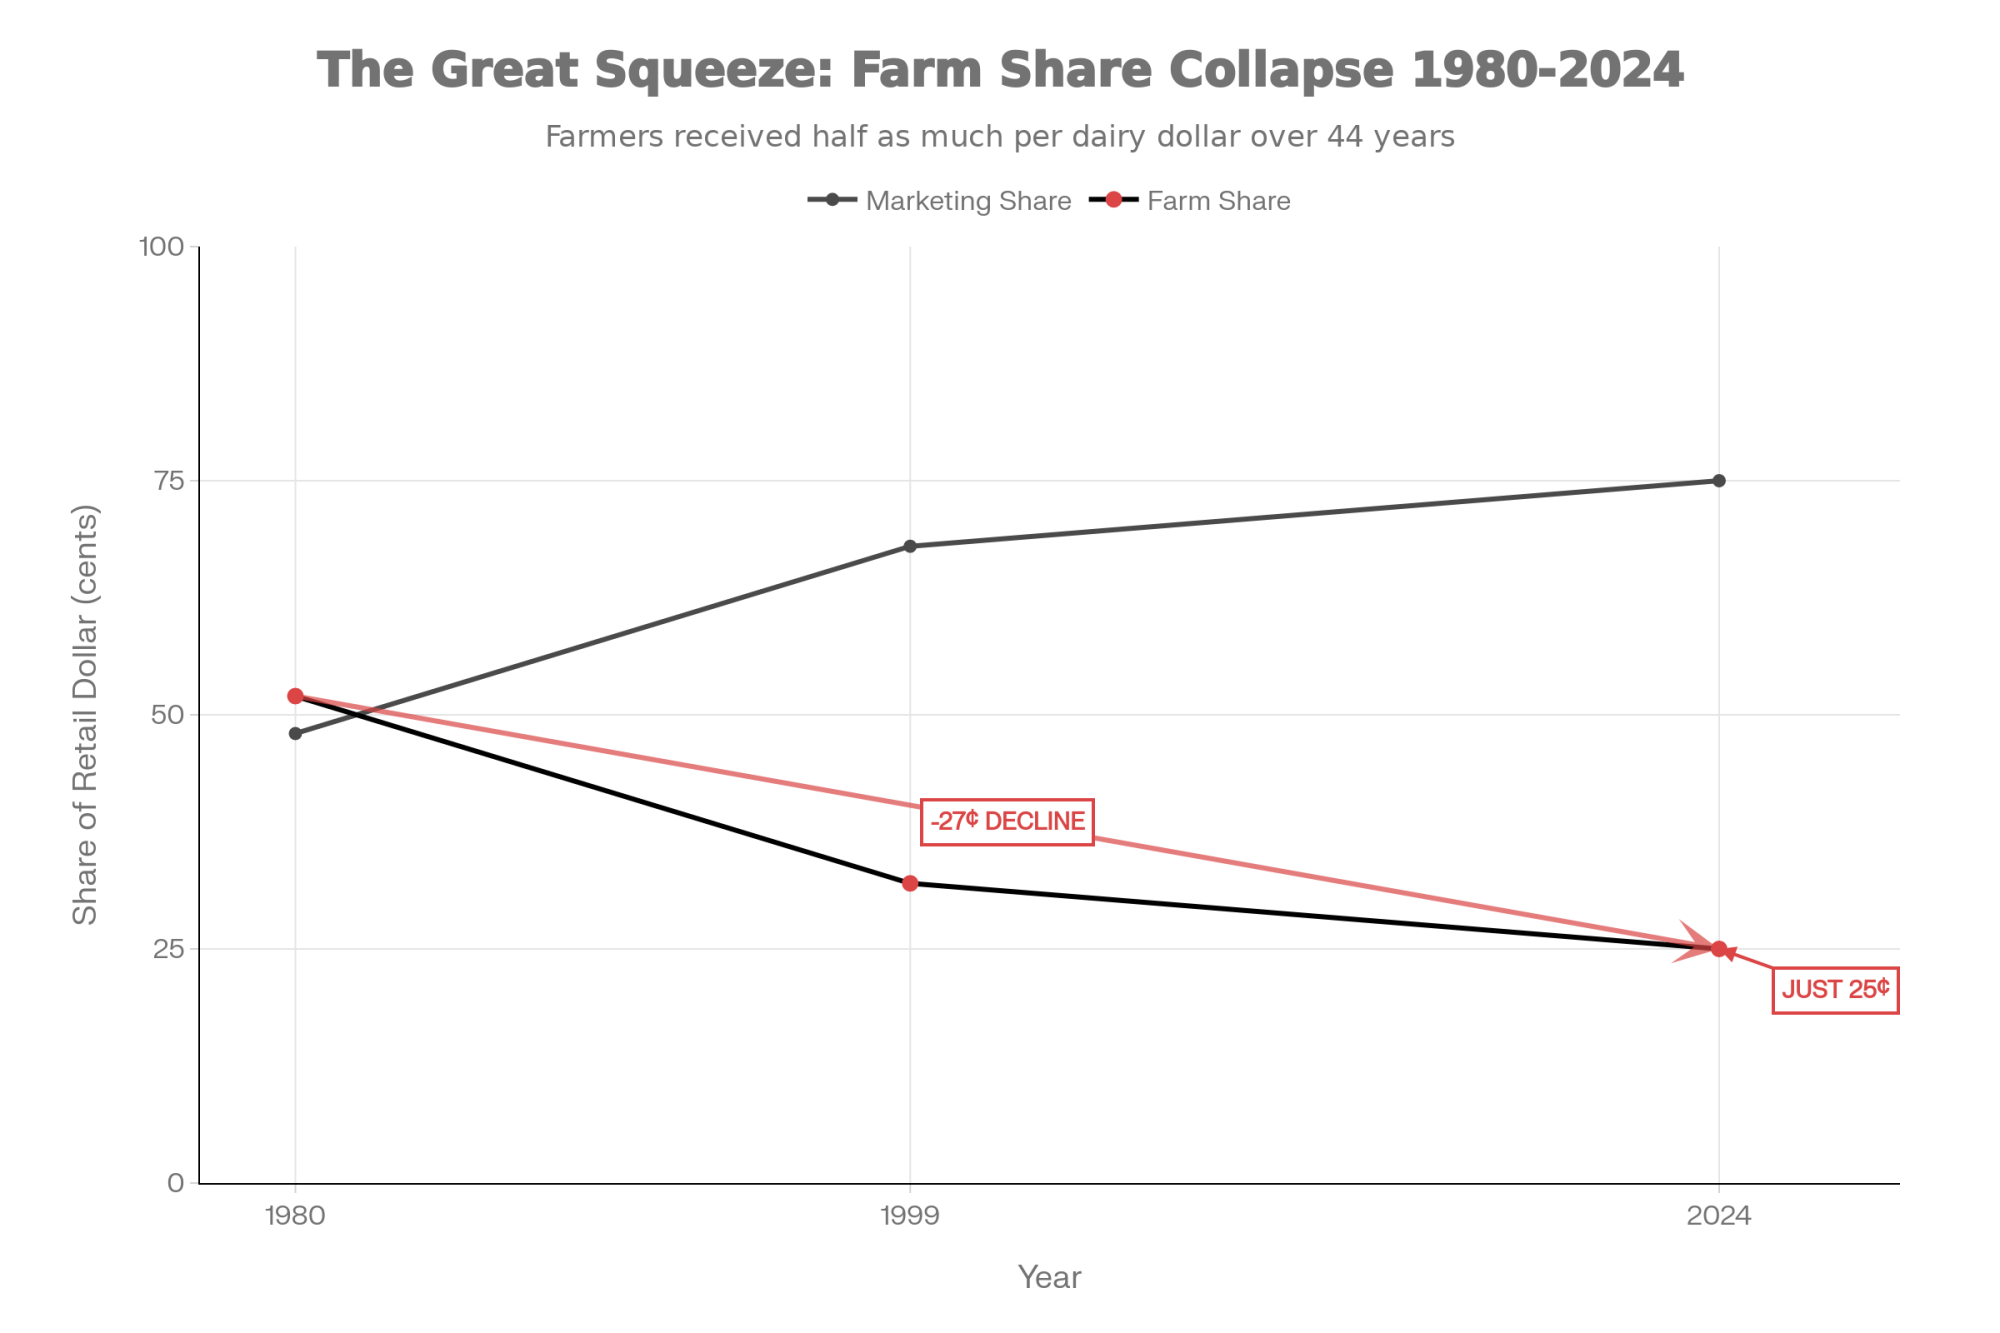
Back in 1980, dairy farmers captured approximately 52 cents of every retail dollar spent on milk. By 1999, that share had dropped to 32 cents. USDA’s Economic Research Service has tracked this through its Food Dollar Series for decades, and the most recent numbers from its 2024 Price Spreads data put the farm share of the retail dairy product basket at roughly 25 cents on the dollar.
Now, some of that shift reflects legitimate changes in the supply chain—more sophisticated processing, extended cold chains, greater product diversity, and increased food safety requirements. These things cost money, and that cost shows up somewhere.
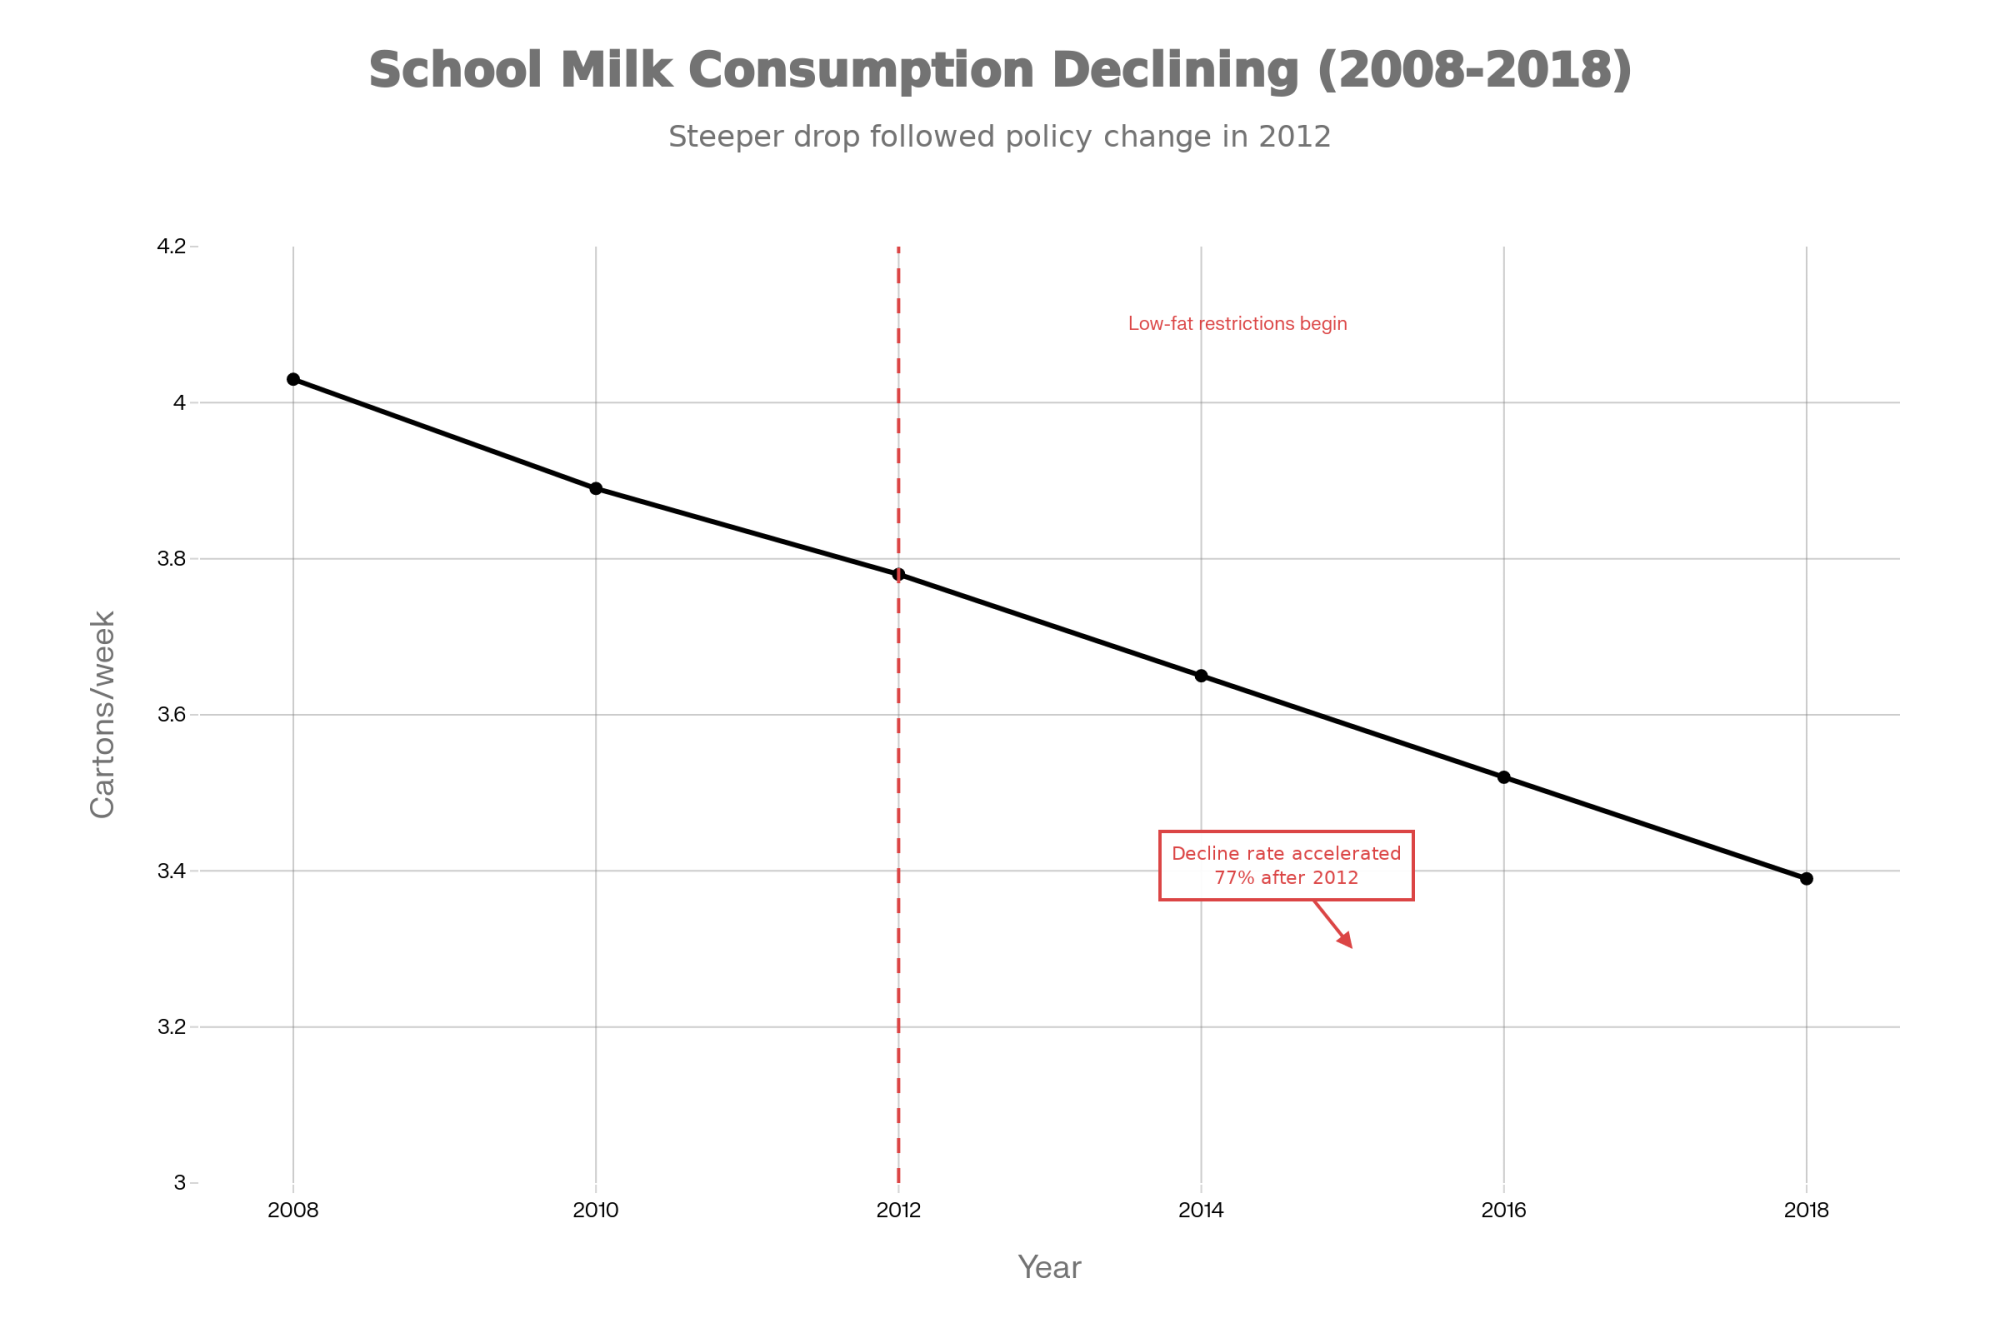
But here’s what caught my attention: when farm prices dropped 11.4% between August 2024 and August 2025, retail prices barely moved. Bureau of Labor Statistics data shows that the average gallon of conventional whole milk ranged from $3.99 to $4.32 during that period.
The margin had to go somewhere. Understanding where—and why—matters for how we think about pricing dynamics going forward.
What Academic Research Reveals About Price Transmission
This brings us to some research that deserves more attention in our industry. It’s the kind of work that helps explain howprice changes actually move through the supply chain—or don’t.
A study published in the Journal of Food Research by economists at the University of Guelph examined price transmission through Canadian agricultural supply chains. They compared supply-managed commodities like dairy with market-driven commodities like pork, and their findings raise some interesting questions for us.
What the Guelph researchers found:
- In supply-managed dairy systems, price changes were transmitted relatively symmetrically—when farm prices rose, retail prices followed at roughly the same rate as when farm prices fell
- In competitive pork markets, the pattern looked different: retail prices responded quickly when farm prices increased, but declined much more slowly when farm prices dropped
- The researchers attributed this asymmetry directly to processor and retailer concentration
As they put it: “Because of processor and retailer concentration, consumer prices respond more quickly to upward than downward movements of farm prices.”
Why does this matter for U.S. dairy? Because our system shares some characteristics with that competitive model they studied. When input costs rise, those increases tend to move through the chain relatively quickly. When costs fall… well, the benefits don’t always flow back to producers at the same pace. Many of us have seen this play out firsthand.
The European Evidence
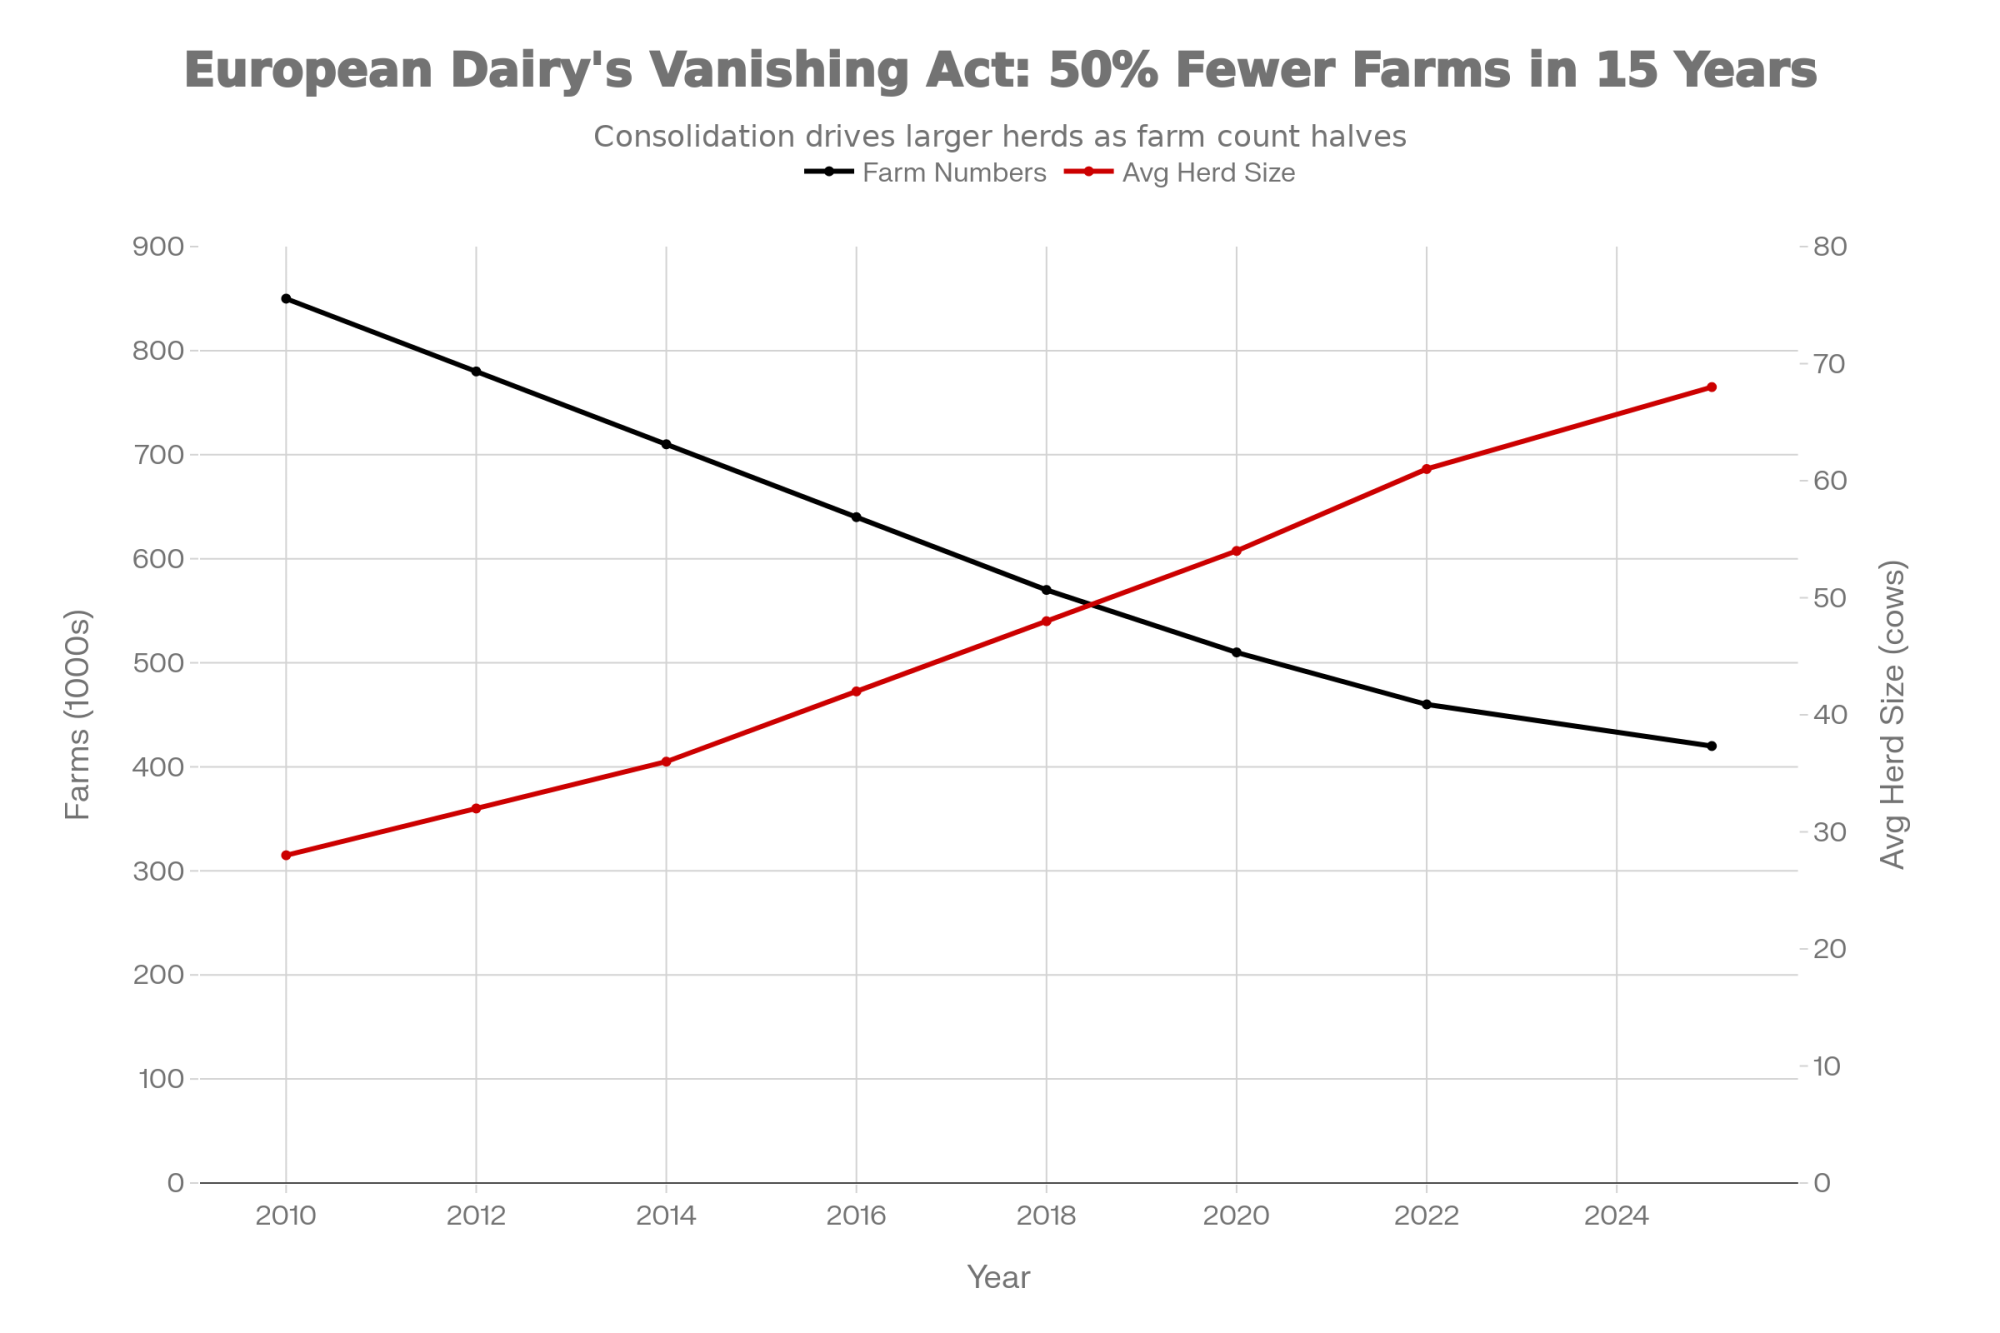
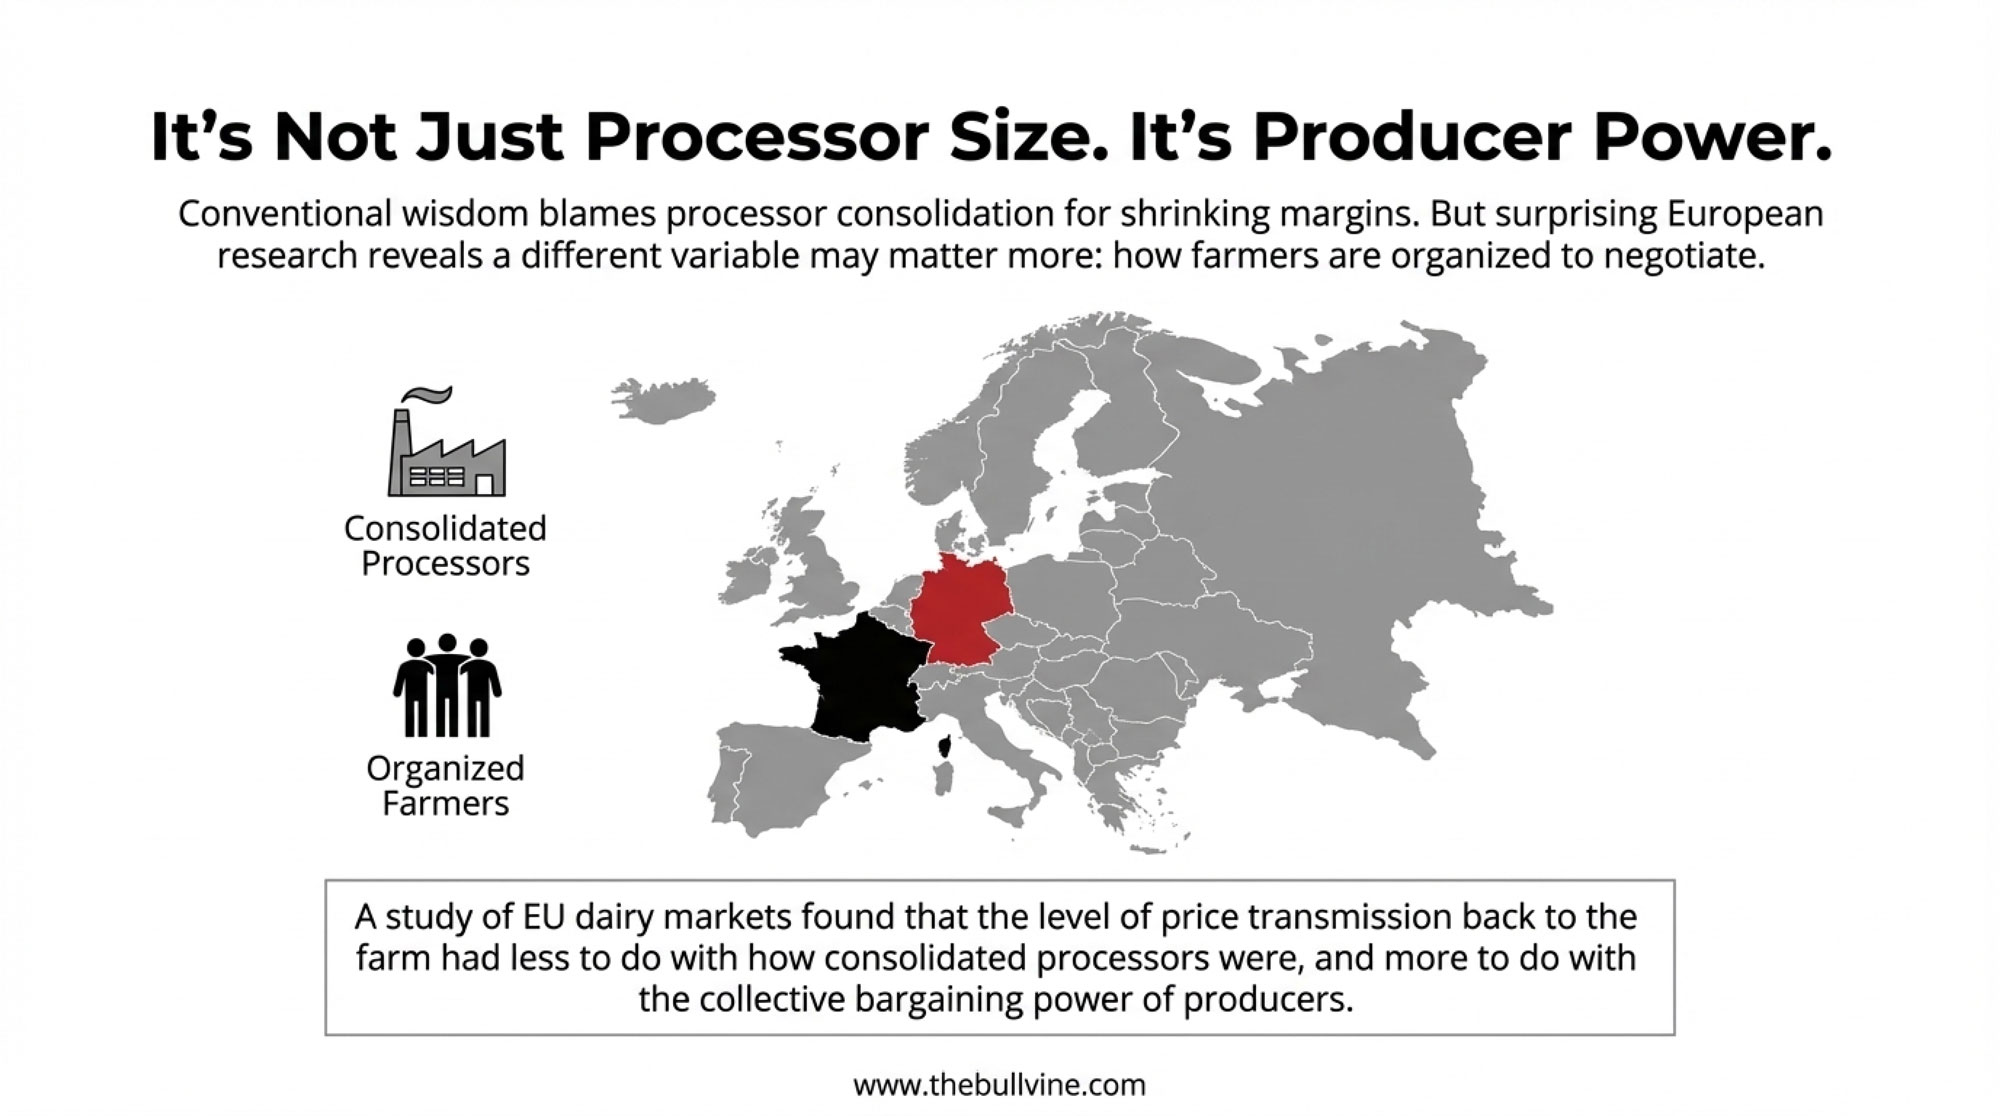
European research adds another dimension that I found genuinely surprising. A 2020 study from the EU’s VALUMICS project examined dairy value chains across Germany, France, and the United Kingdom, and what they found challenges some conventional thinking.
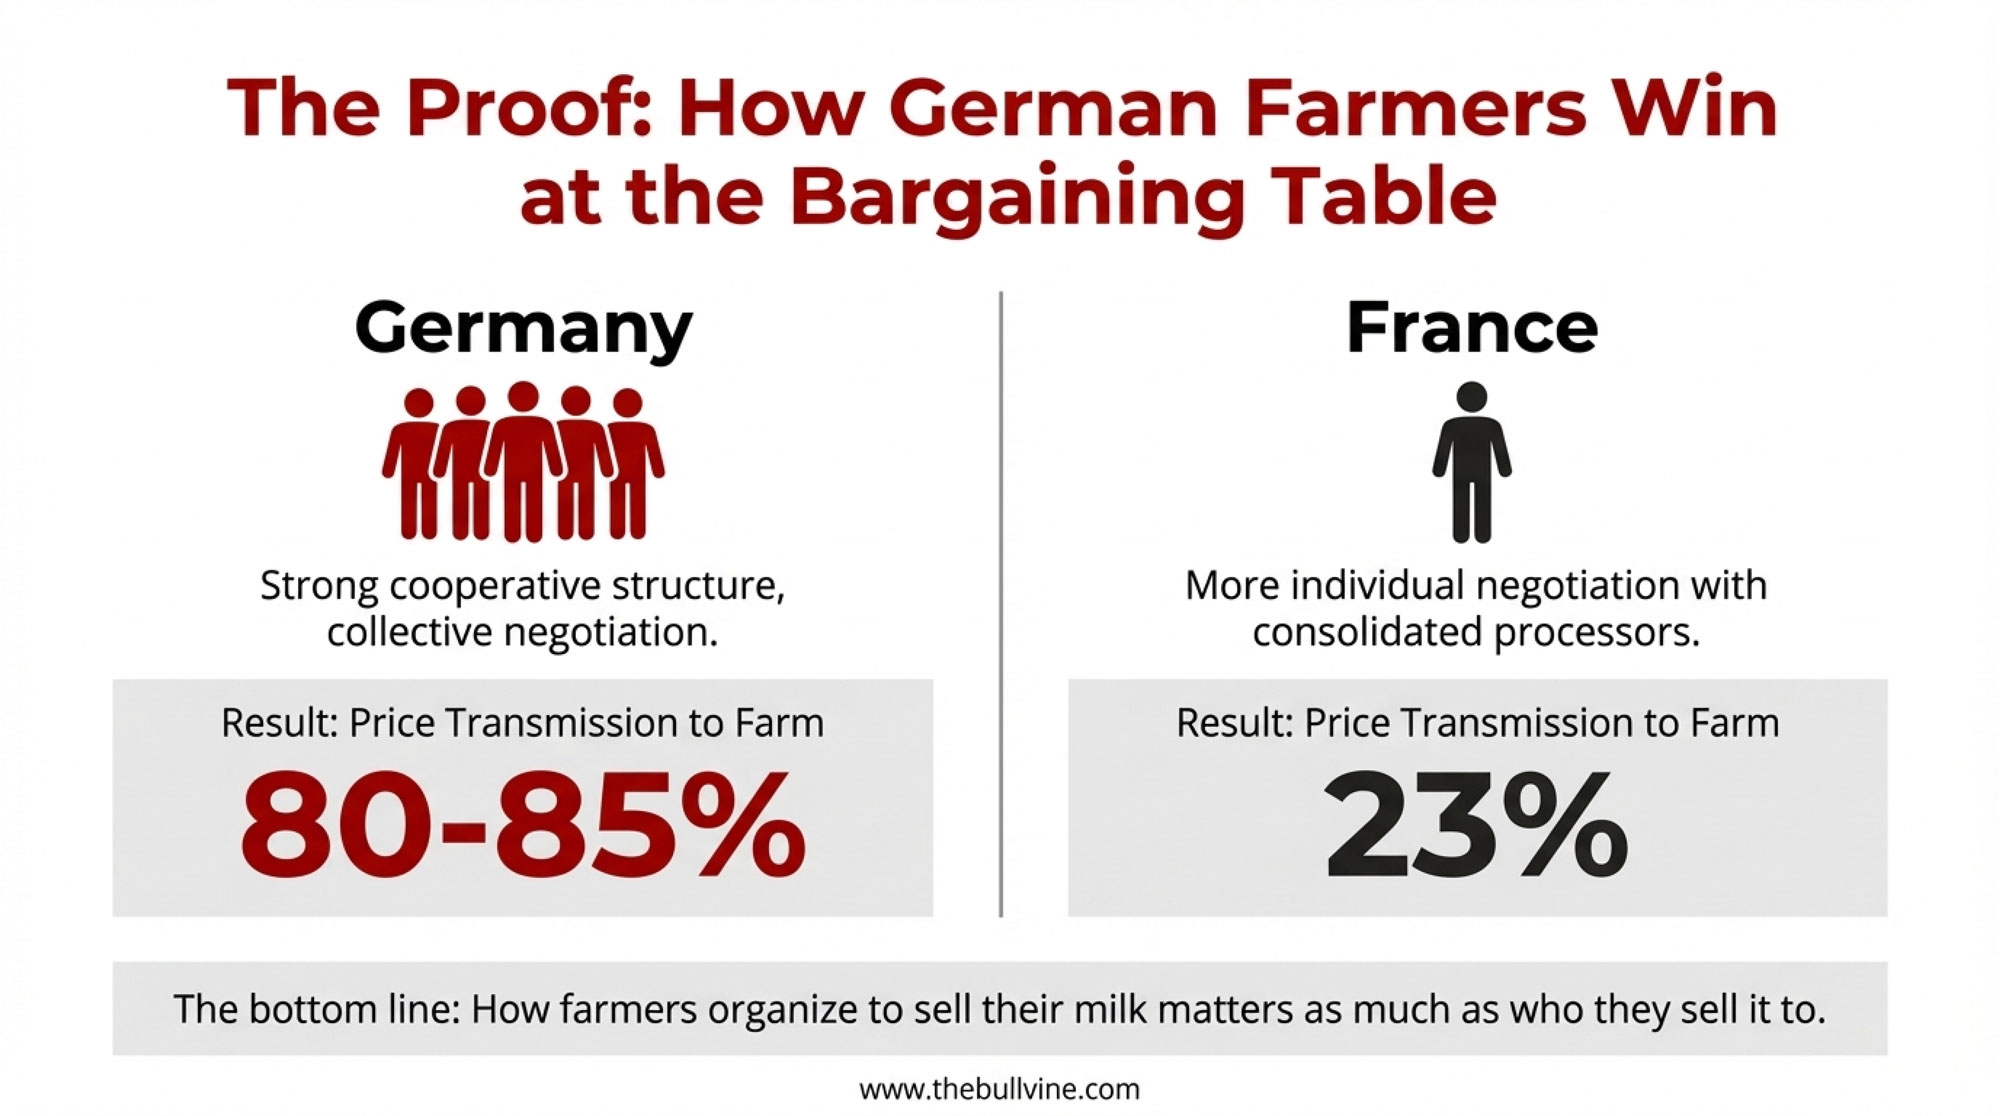
The key findings:
- Germany and the UK showed 80-85% price transmission—meaning most price changes at the farm level eventually reached retail
- France showed only 23% transmission—most farm-level price changes got absorbed somewhere in the middle of the chain
- Here’s what’s interesting: the difference wasn’t primarily about processor consolidation
- The key variable was the farmer organization—how collectively producers could negotiate
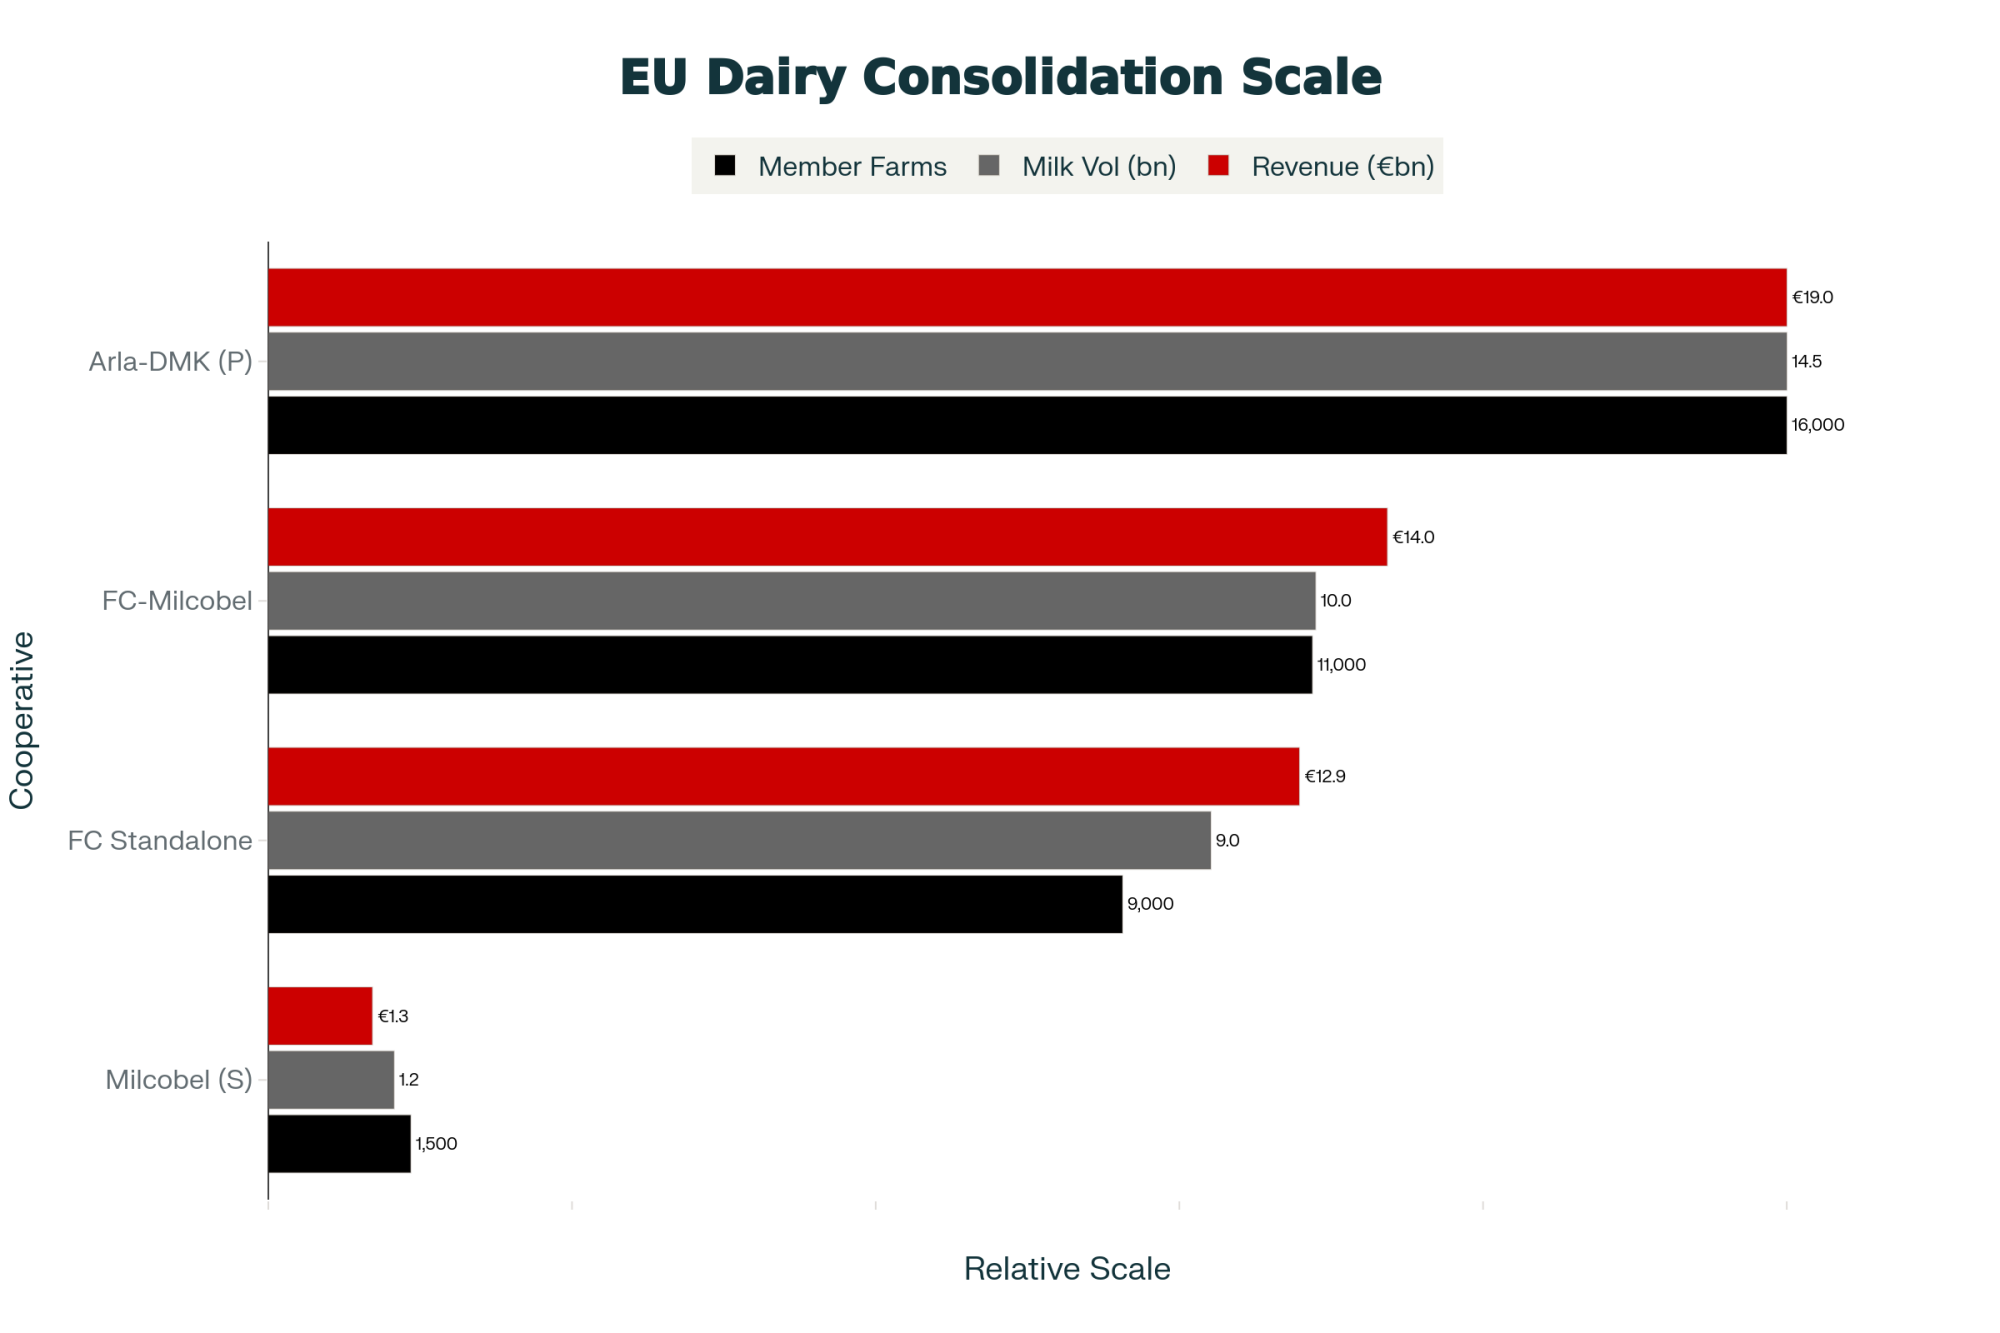
So Germany has relatively fragmented processing—many mid-sized processors and cooperatives competing for milk. France has more consolidated processing, with Lactalis and Sodiaal controlling over 20% of the national milk collection.
| Country | Price Transmission % | Farmer Organization | Processor Structure |
| Germany | 80-85% | Strong cooperative structures with collective negotiating leverage | Fragmented: many mid-sized processors competing |
| United Kingdom | 80-85% | Strong cooperative frameworks backed by legal structures | Mixed competitive environment |
| France | 23% | Individual farmer negotiation with limited collective leverage | Consolidated: Lactalis & Sodiaal control 20%+ of national milk |
Conventional thinking might suggest German farmers would face more pressure in that competitive processor environment. But the data showed the opposite. Germany achieved 80-85% symmetric price transmission. France achieved 23%.
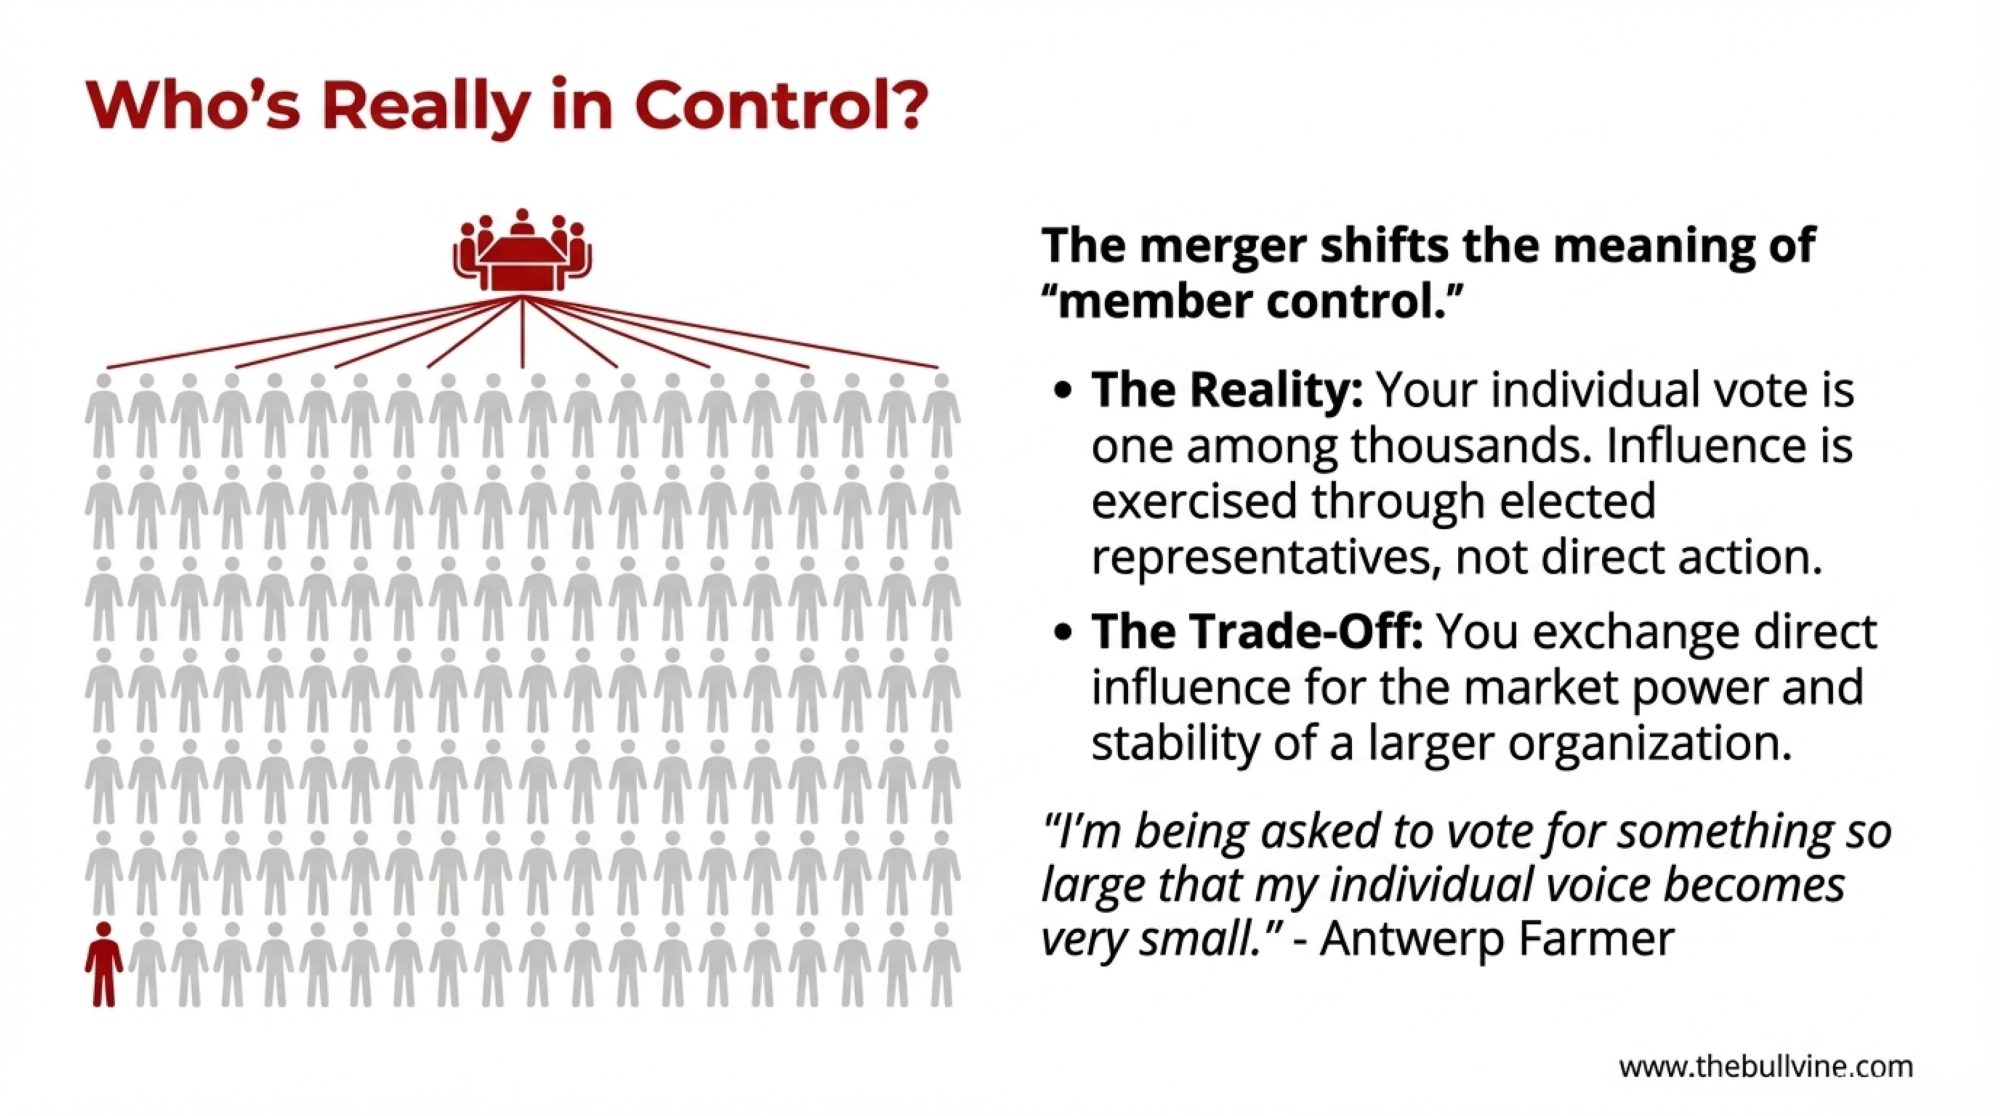
The researchers pointed to the farmer organization as the critical variable. Germany’s cooperative structure provides producers with collective negotiating leverage backed by legal frameworks. French farmers negotiate more individually with those consolidated processors.
I want to be careful not to overstate this—European dairy markets differ from ours in important ways, and correlation doesn’t establish causation. But the findings suggest that how farmers organize may matter as much as how processors consolidate. That’s worth thinking about.
Dr. Andrew Novakovic, who has studied dairy markets at Cornell University for decades, has made similar observations about collective bargaining mechanisms. Information alone doesn’t necessarily translate into better prices—farmers need ways to act on that information collectively.
What might that look like practically? Active participation in cooperative governance, engagement with FMMO hearing processes, and support for producer organizations that advocate on pricing issues. None of these offer quick fixes, but they represent the mechanisms through which farmers can influence market outcomes beyond their individual operations.
Regional Pricing Variation
One aspect of U.S. dairy pricing that merits discussion—and you probably already know this if you’ve ever compared notes with producers in other regions—is the variation in what farmers actually receive.
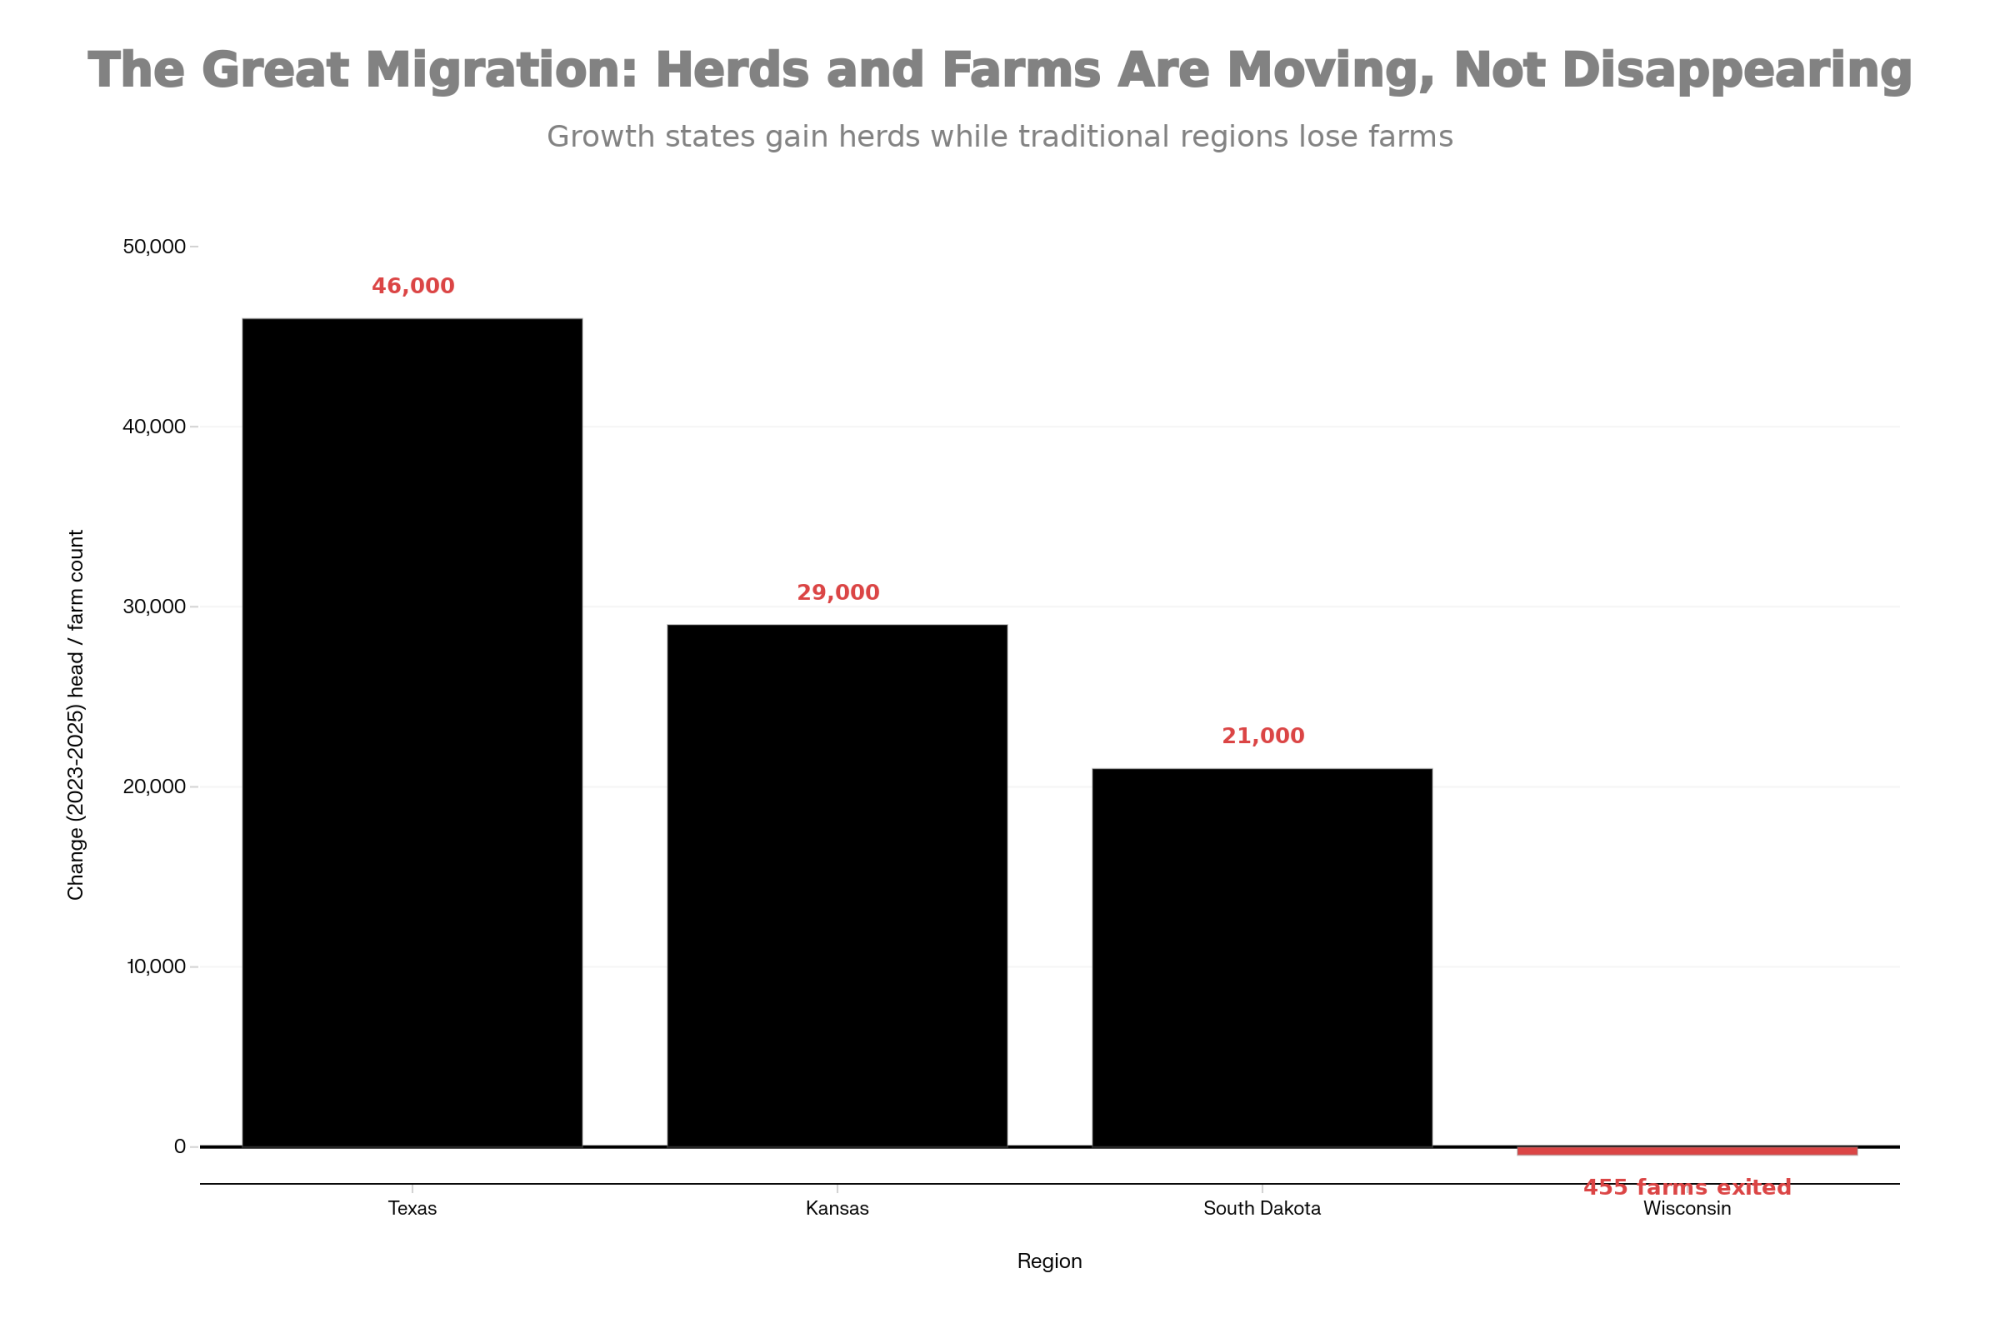
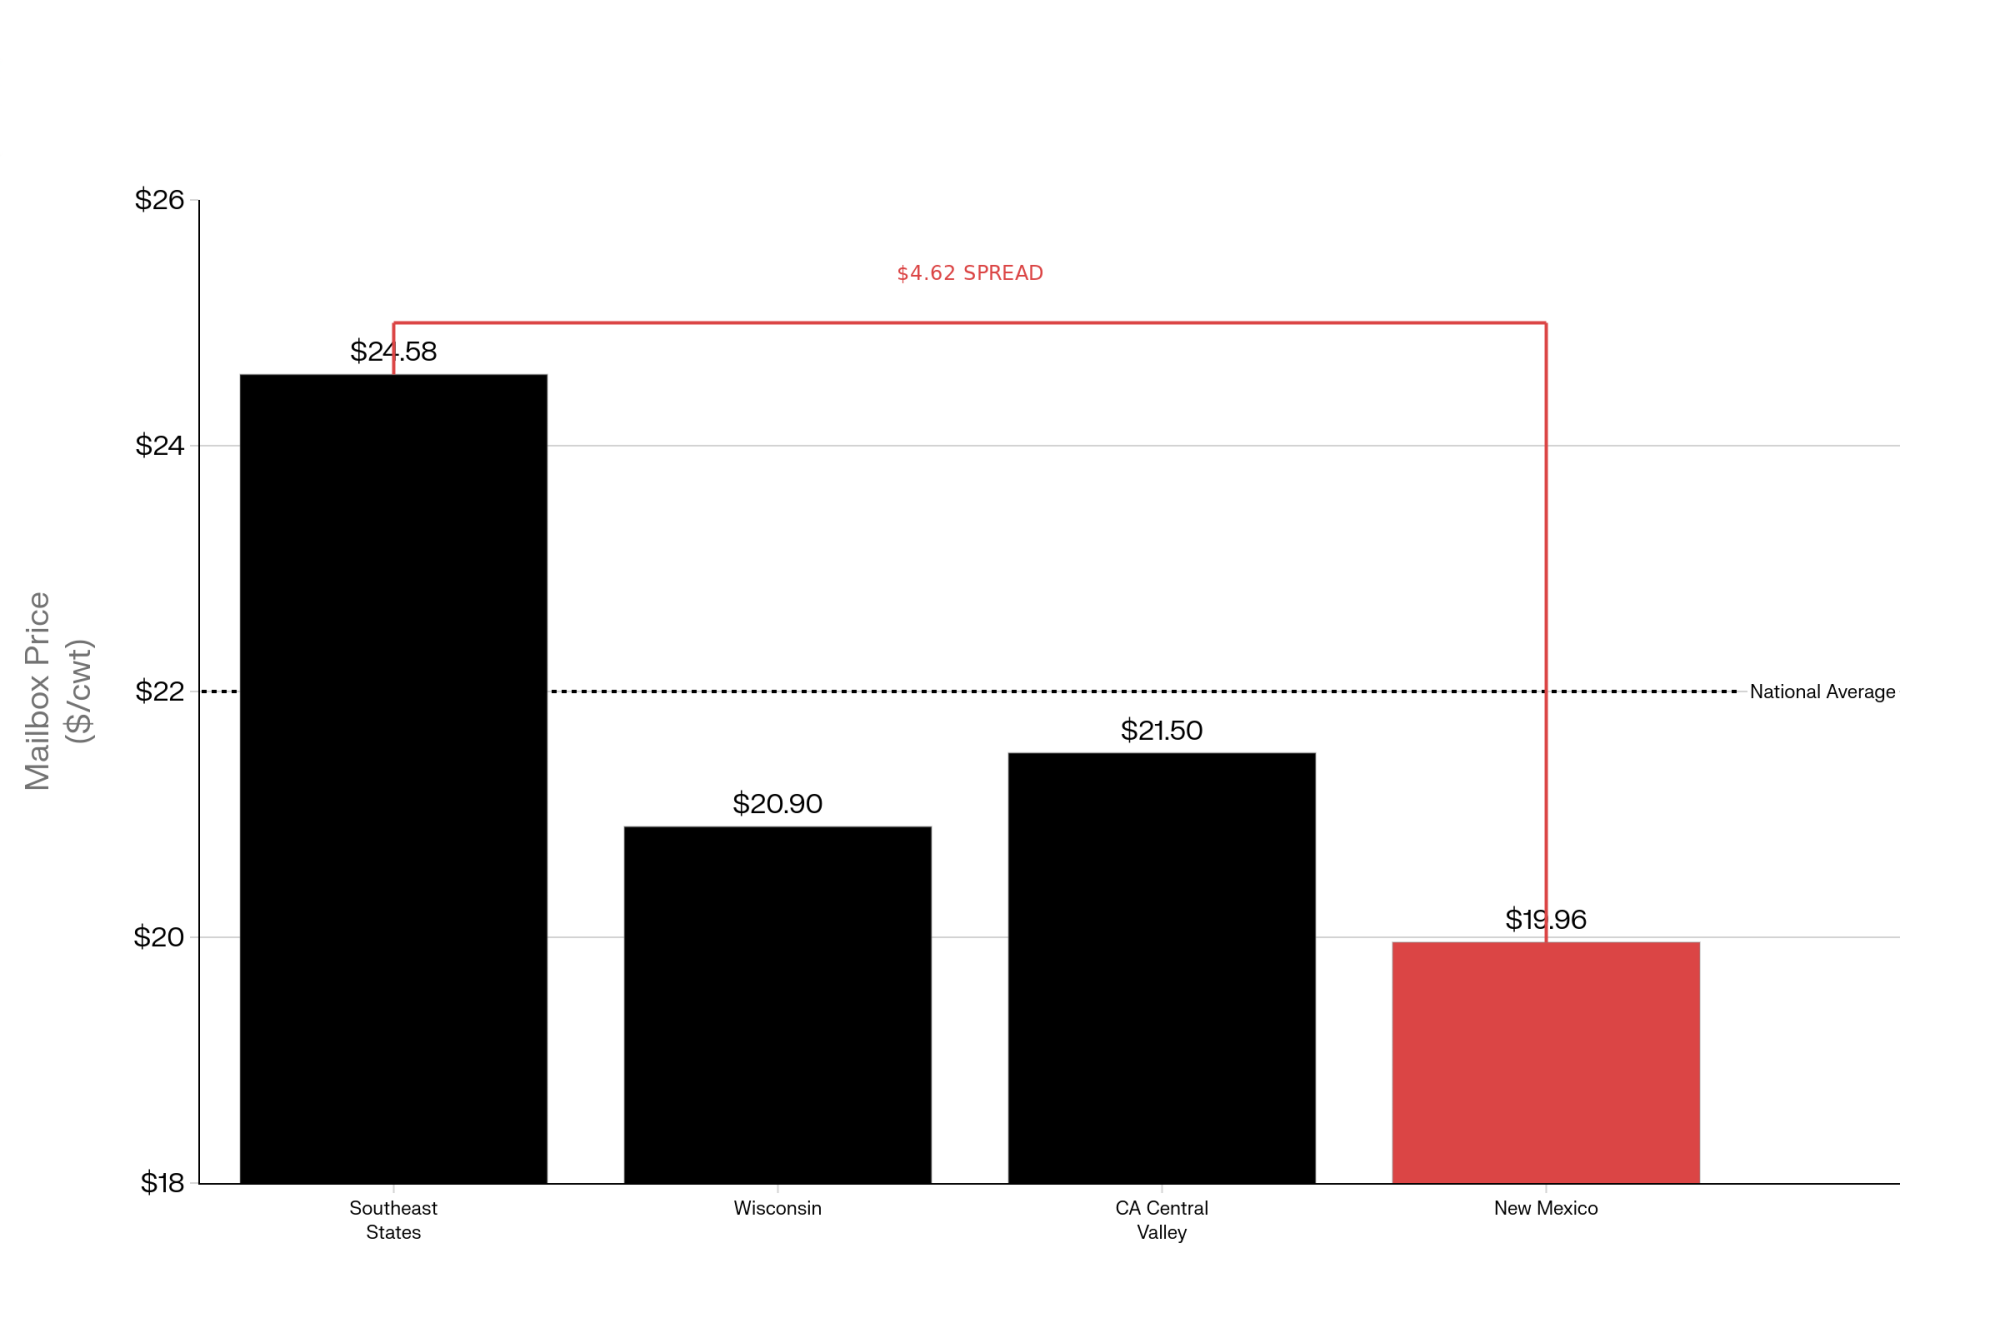
USDA Agricultural Marketing Service mailbox price data shows meaningful spreads between regions. The 2024 annual averages had Southeast states around $24.58 per hundredweight, while New Mexico averaged $19.96. That’s nearly a five-dollar difference for essentially the same product.
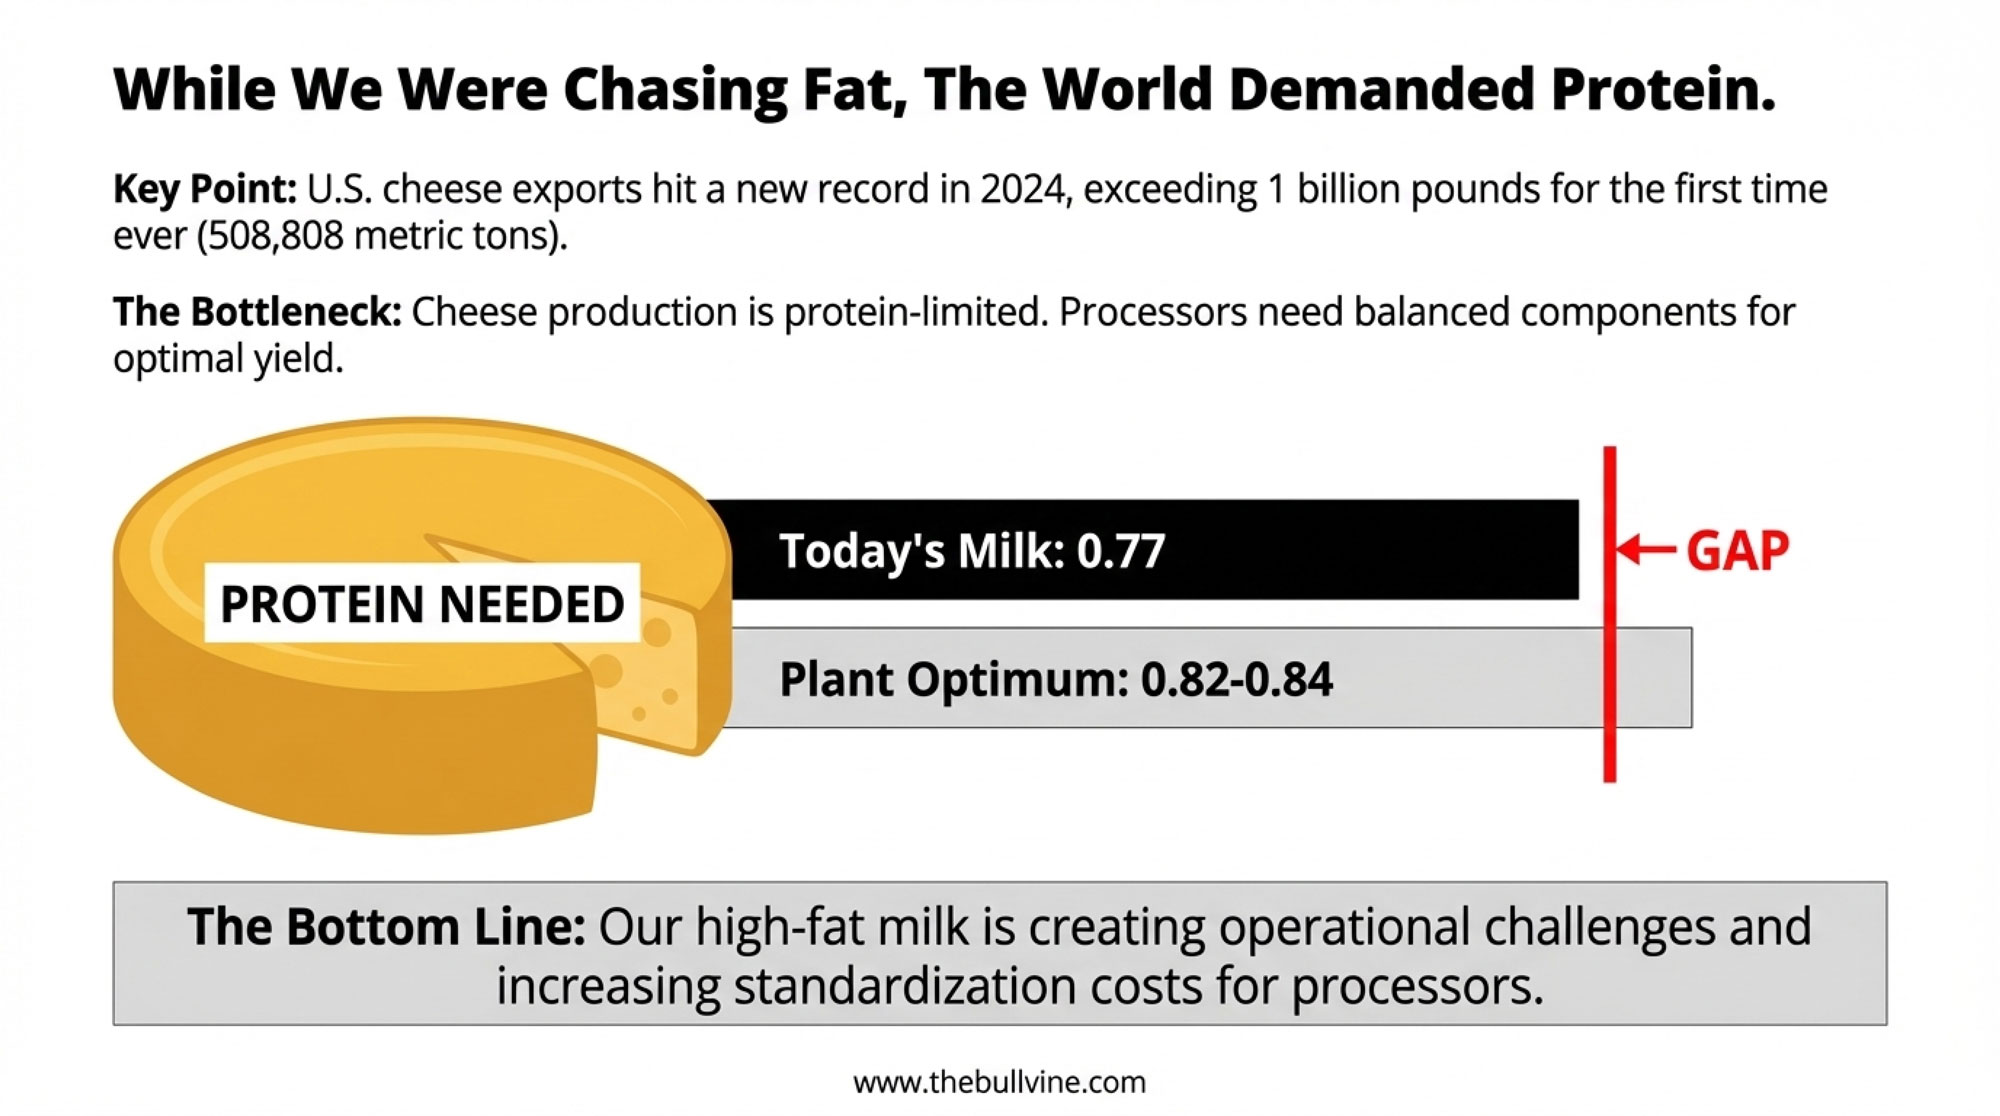
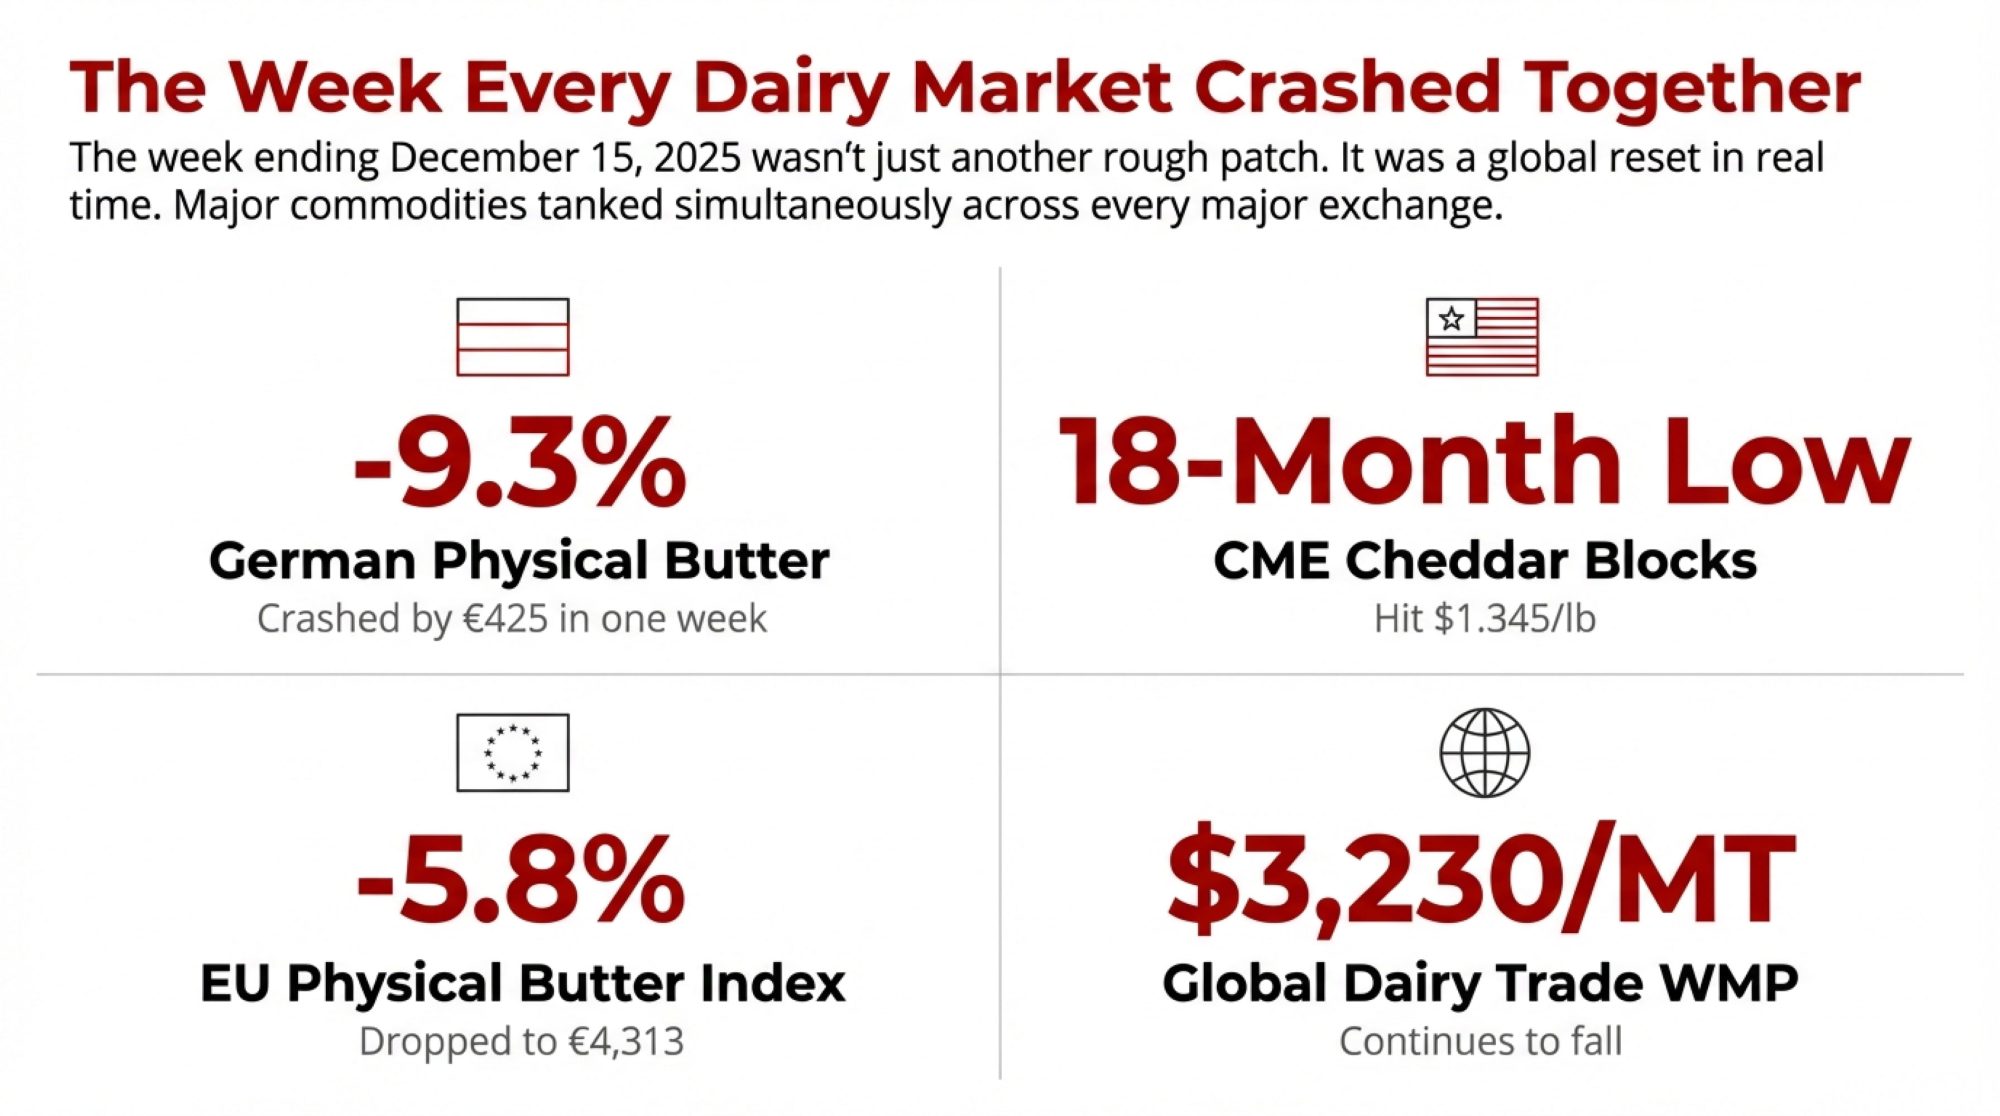
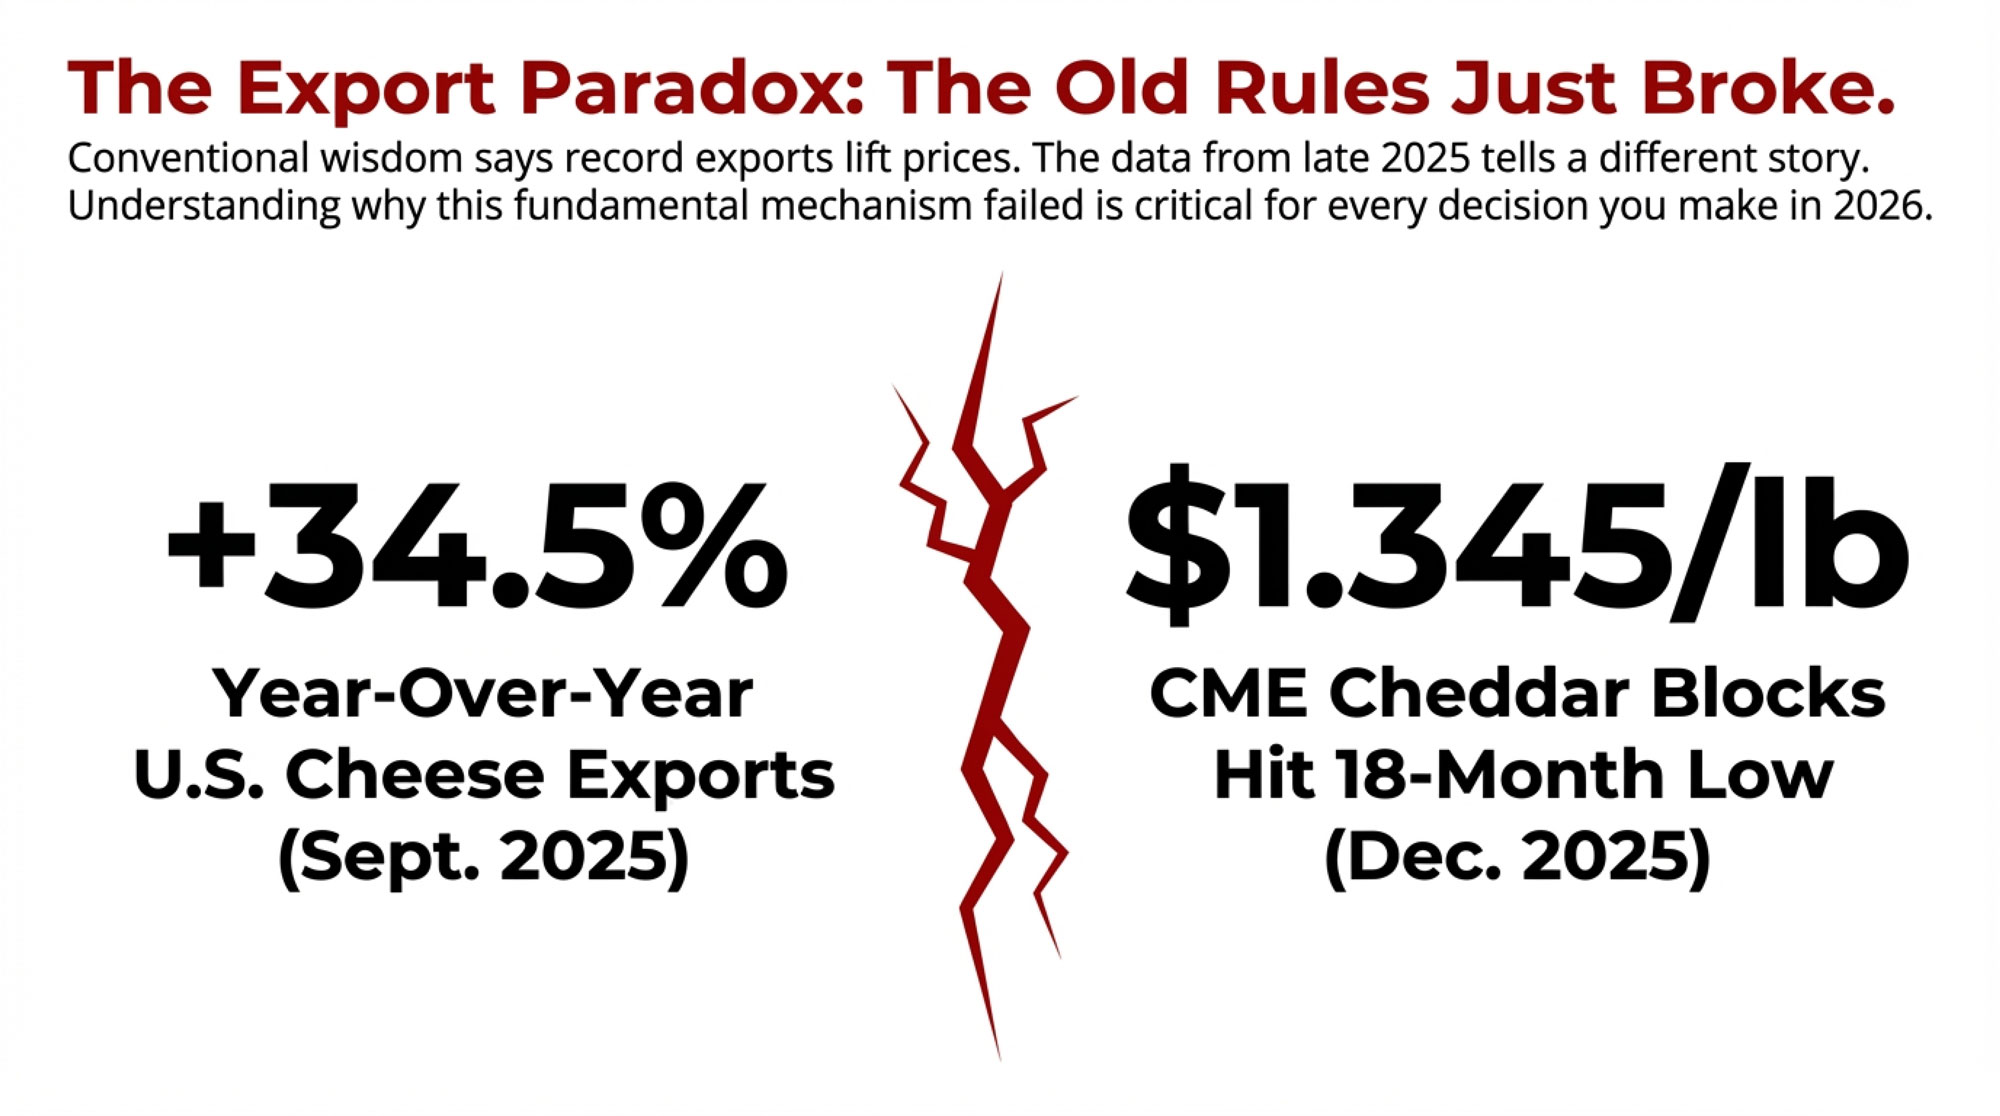
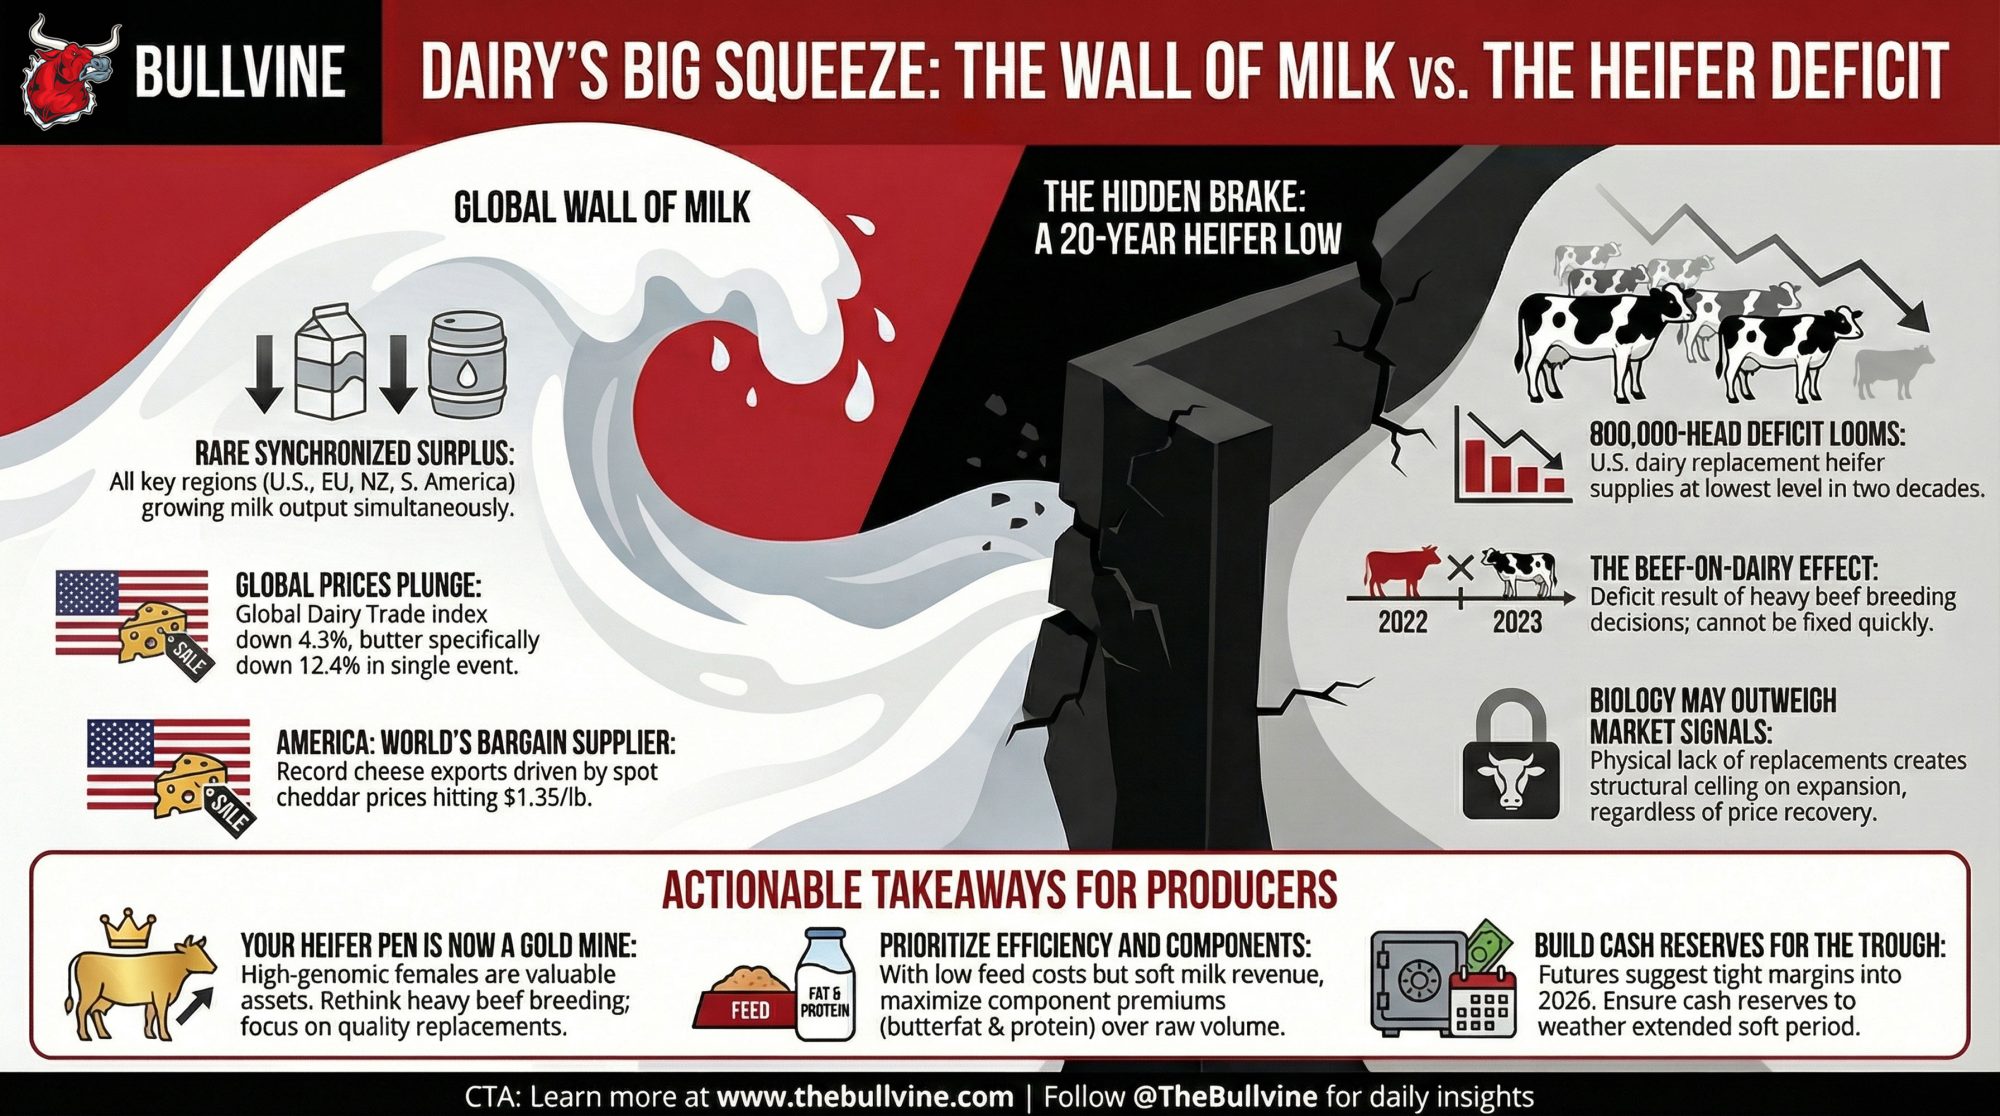
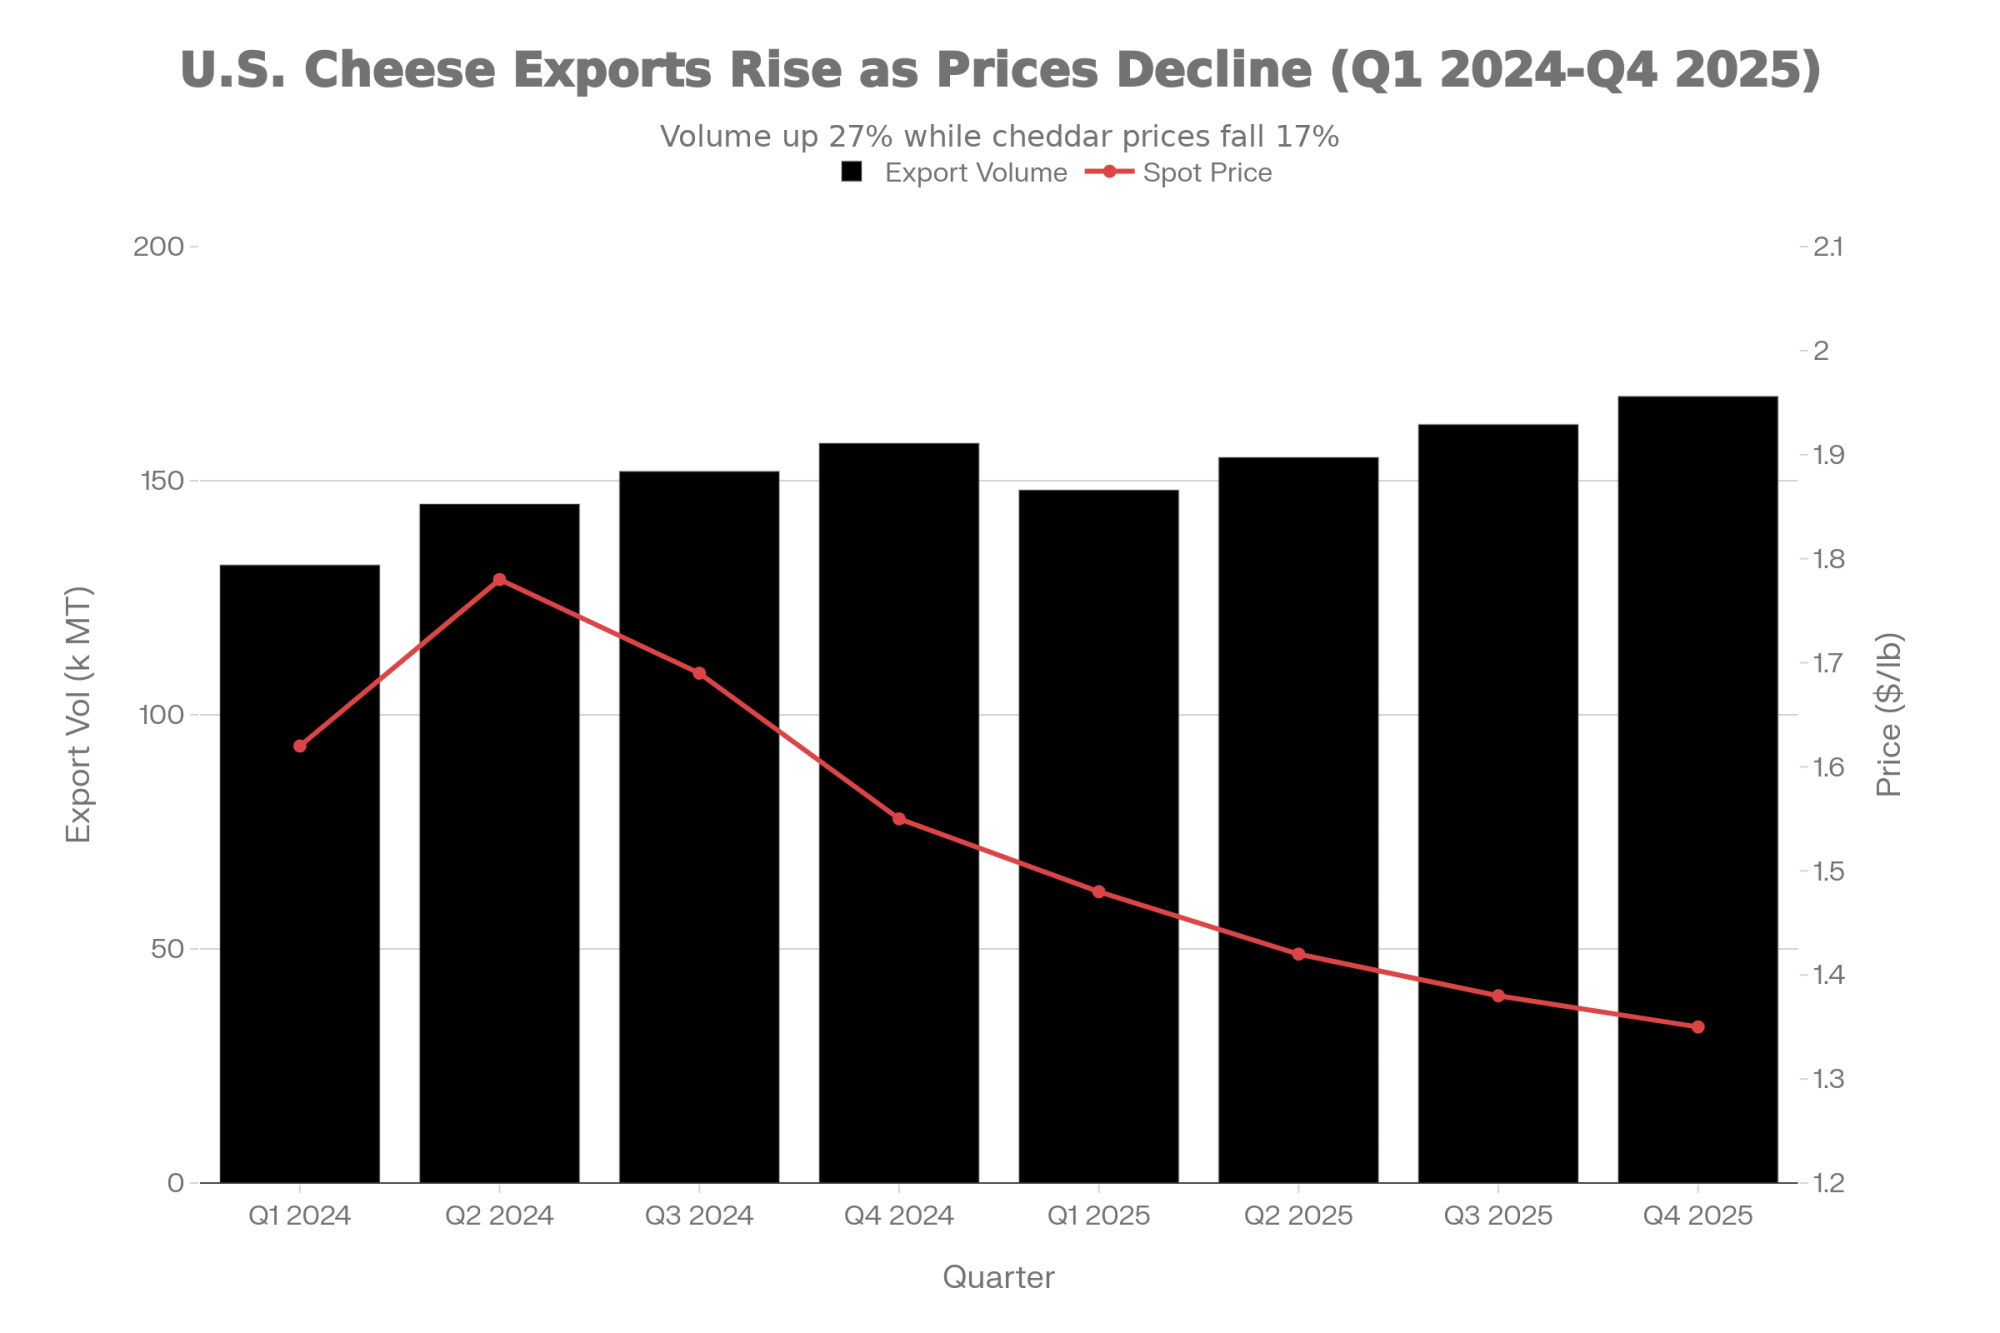
I recently spoke with a producer in California’s Central Valley who noted similar frustrations. “We’re watching cheese exports hit record levels,” she told me, “and our mailbox price doesn’t seem to reflect that demand.” It’s a sentiment I’ve heard echoed from Vermont to Idaho—the sense that global market strength isn’t translating into farm-level returns as producers expect.
Some of this reflects legitimate factors: Federal Milk Marketing Order formulas, transportation costs, local supply-demand balance, and plant proximity. The FMMO system was designed to ensure orderly marketing and prevent predatory practices when milk couldn’t travel far.
But the magnitude of regional differences raises questions worth exploring. I spoke with Dr. Mark Stephenson, recently retired director of dairy policy analysis at the University of Wisconsin-Madison, about this dynamic.
“The regional pricing system reflects historical infrastructure and political compromises as much as current economic realities,” he observed. “Whether it still serves farmers optimally is a legitimate question.”
For individual operations, the practical takeaway is straightforward: understand the dynamics of your specific FMMO region. USDA publishes monthly mailbox prices by state—tracking where you stand relative to other regions can inform marketing decisions.
Processing Sector Changes
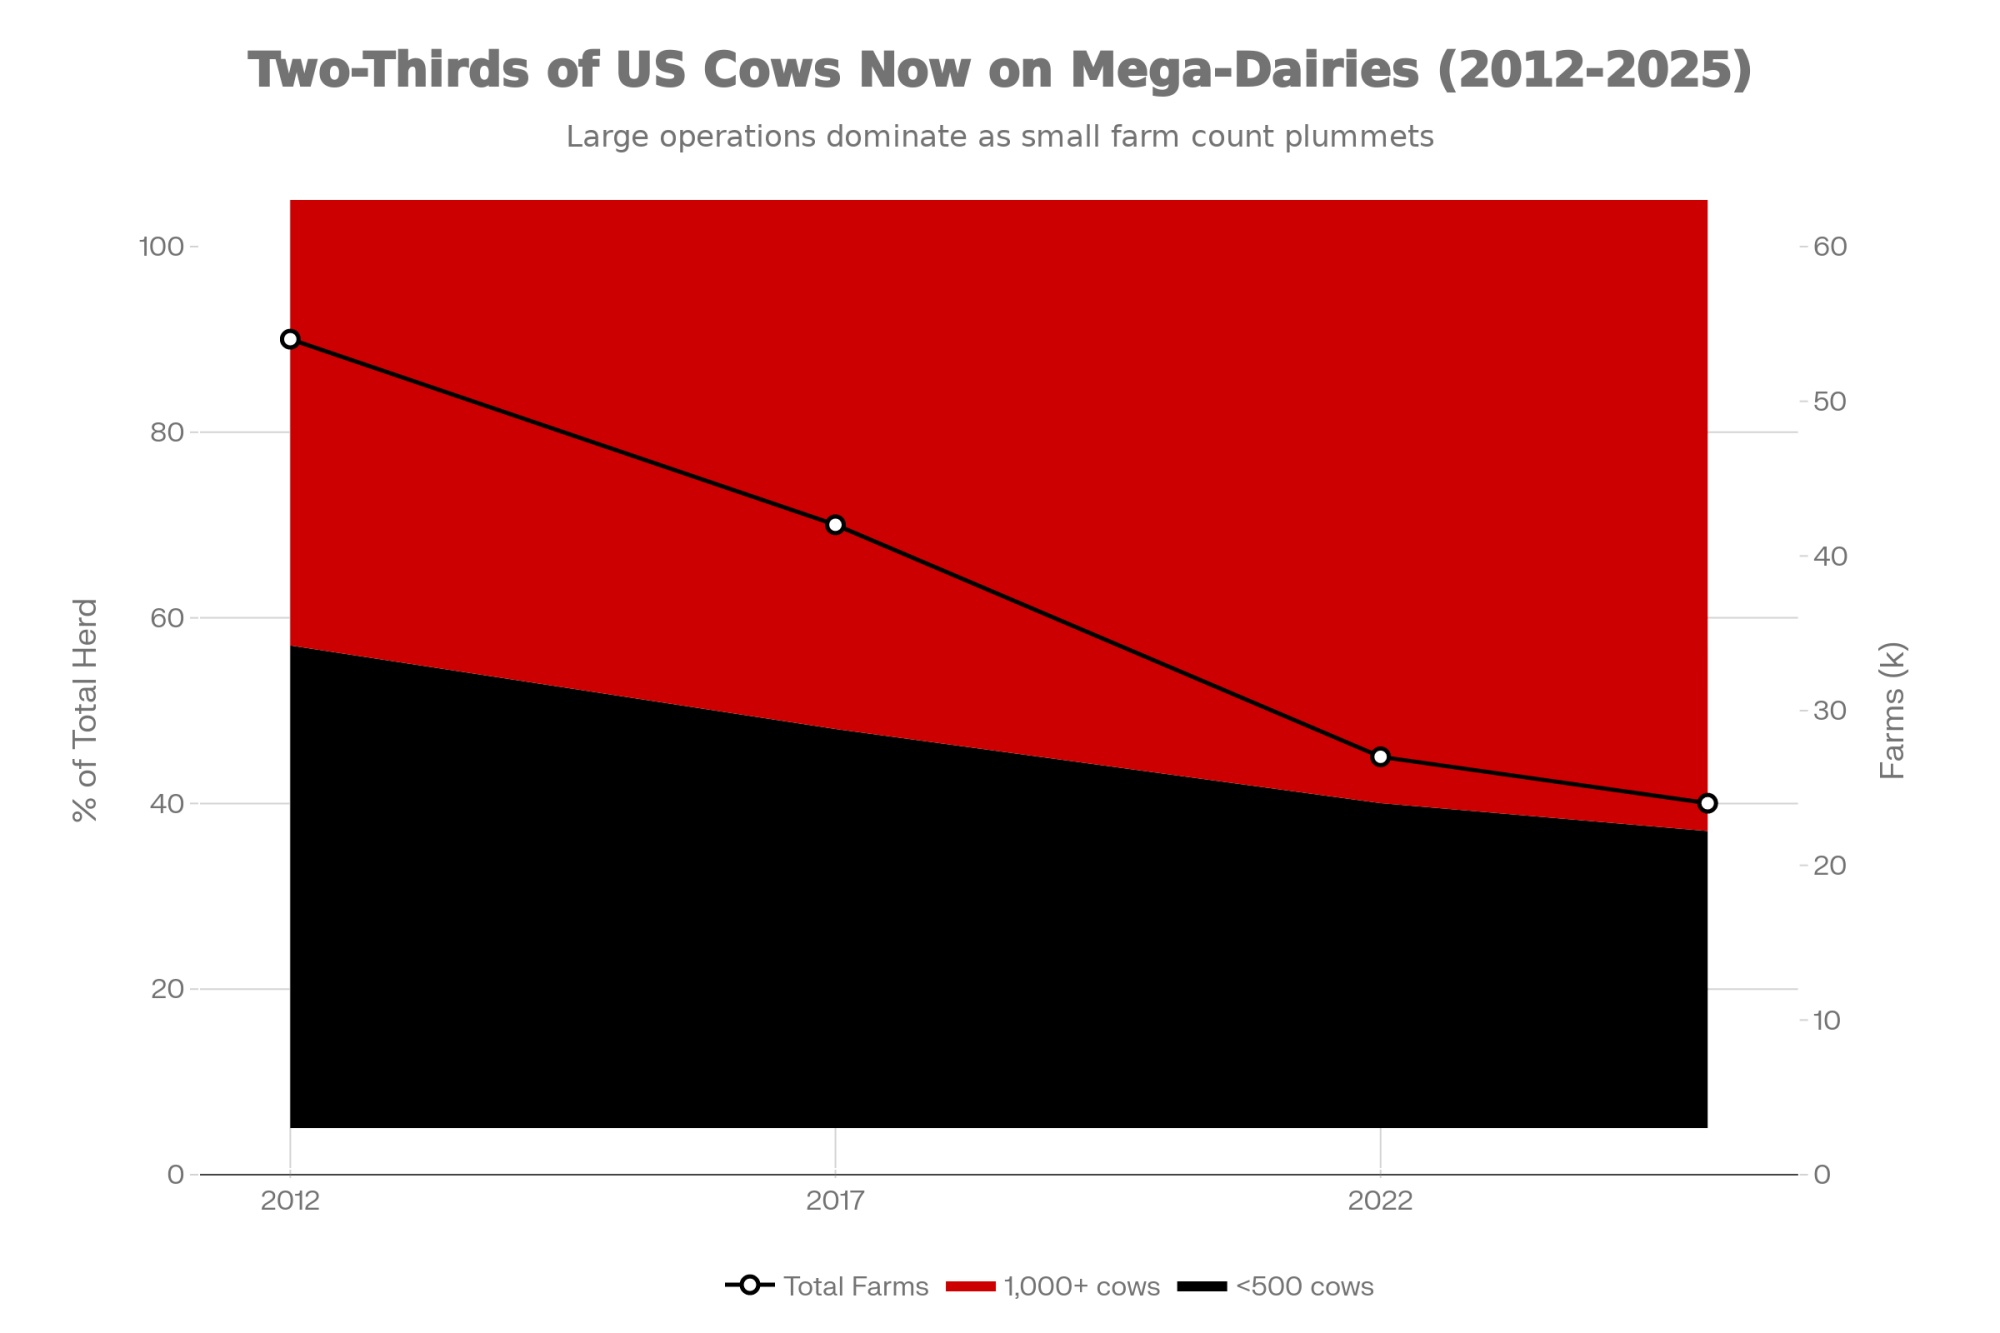
Any discussion of dairy pricing should include what’s happening on the processing side. And the numbers tell a story of significant consolidation over the past several decades.
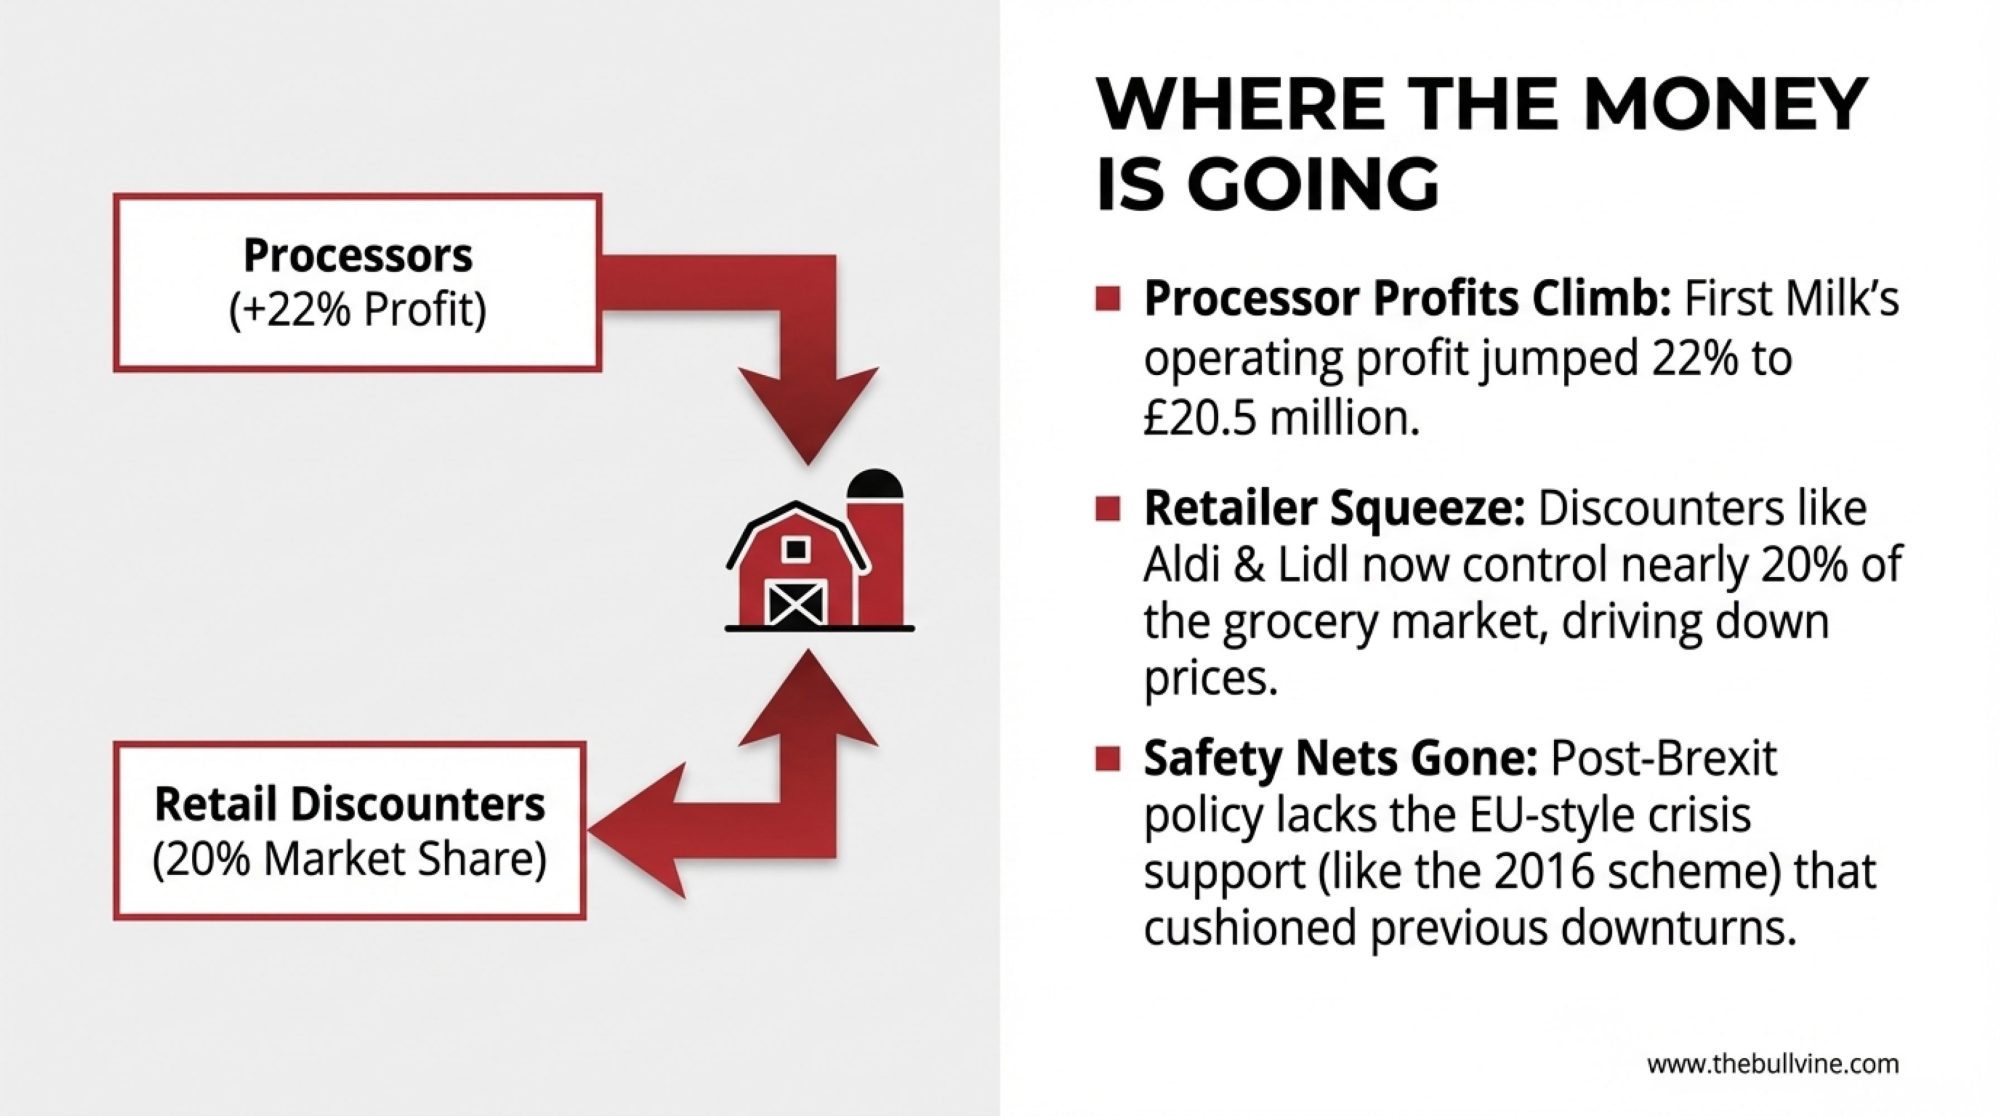
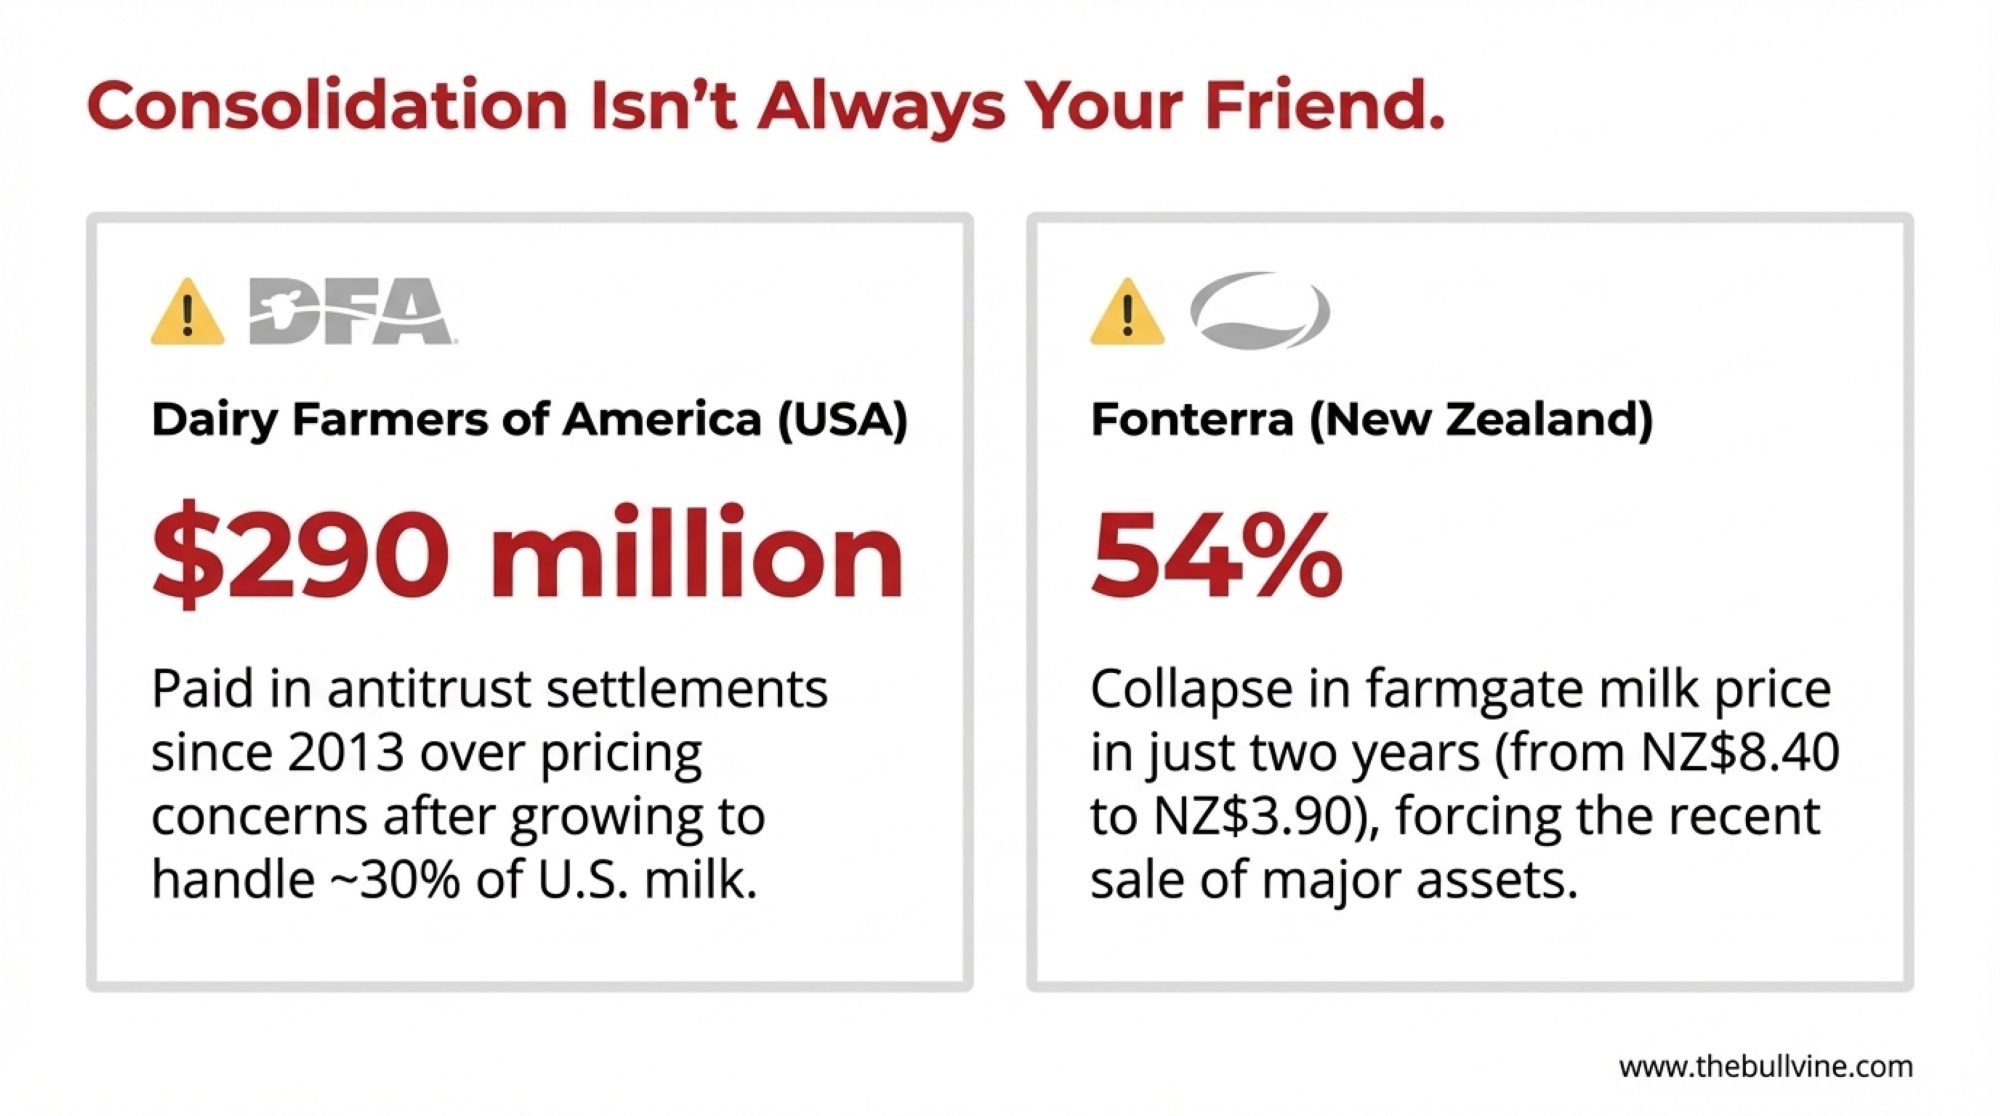
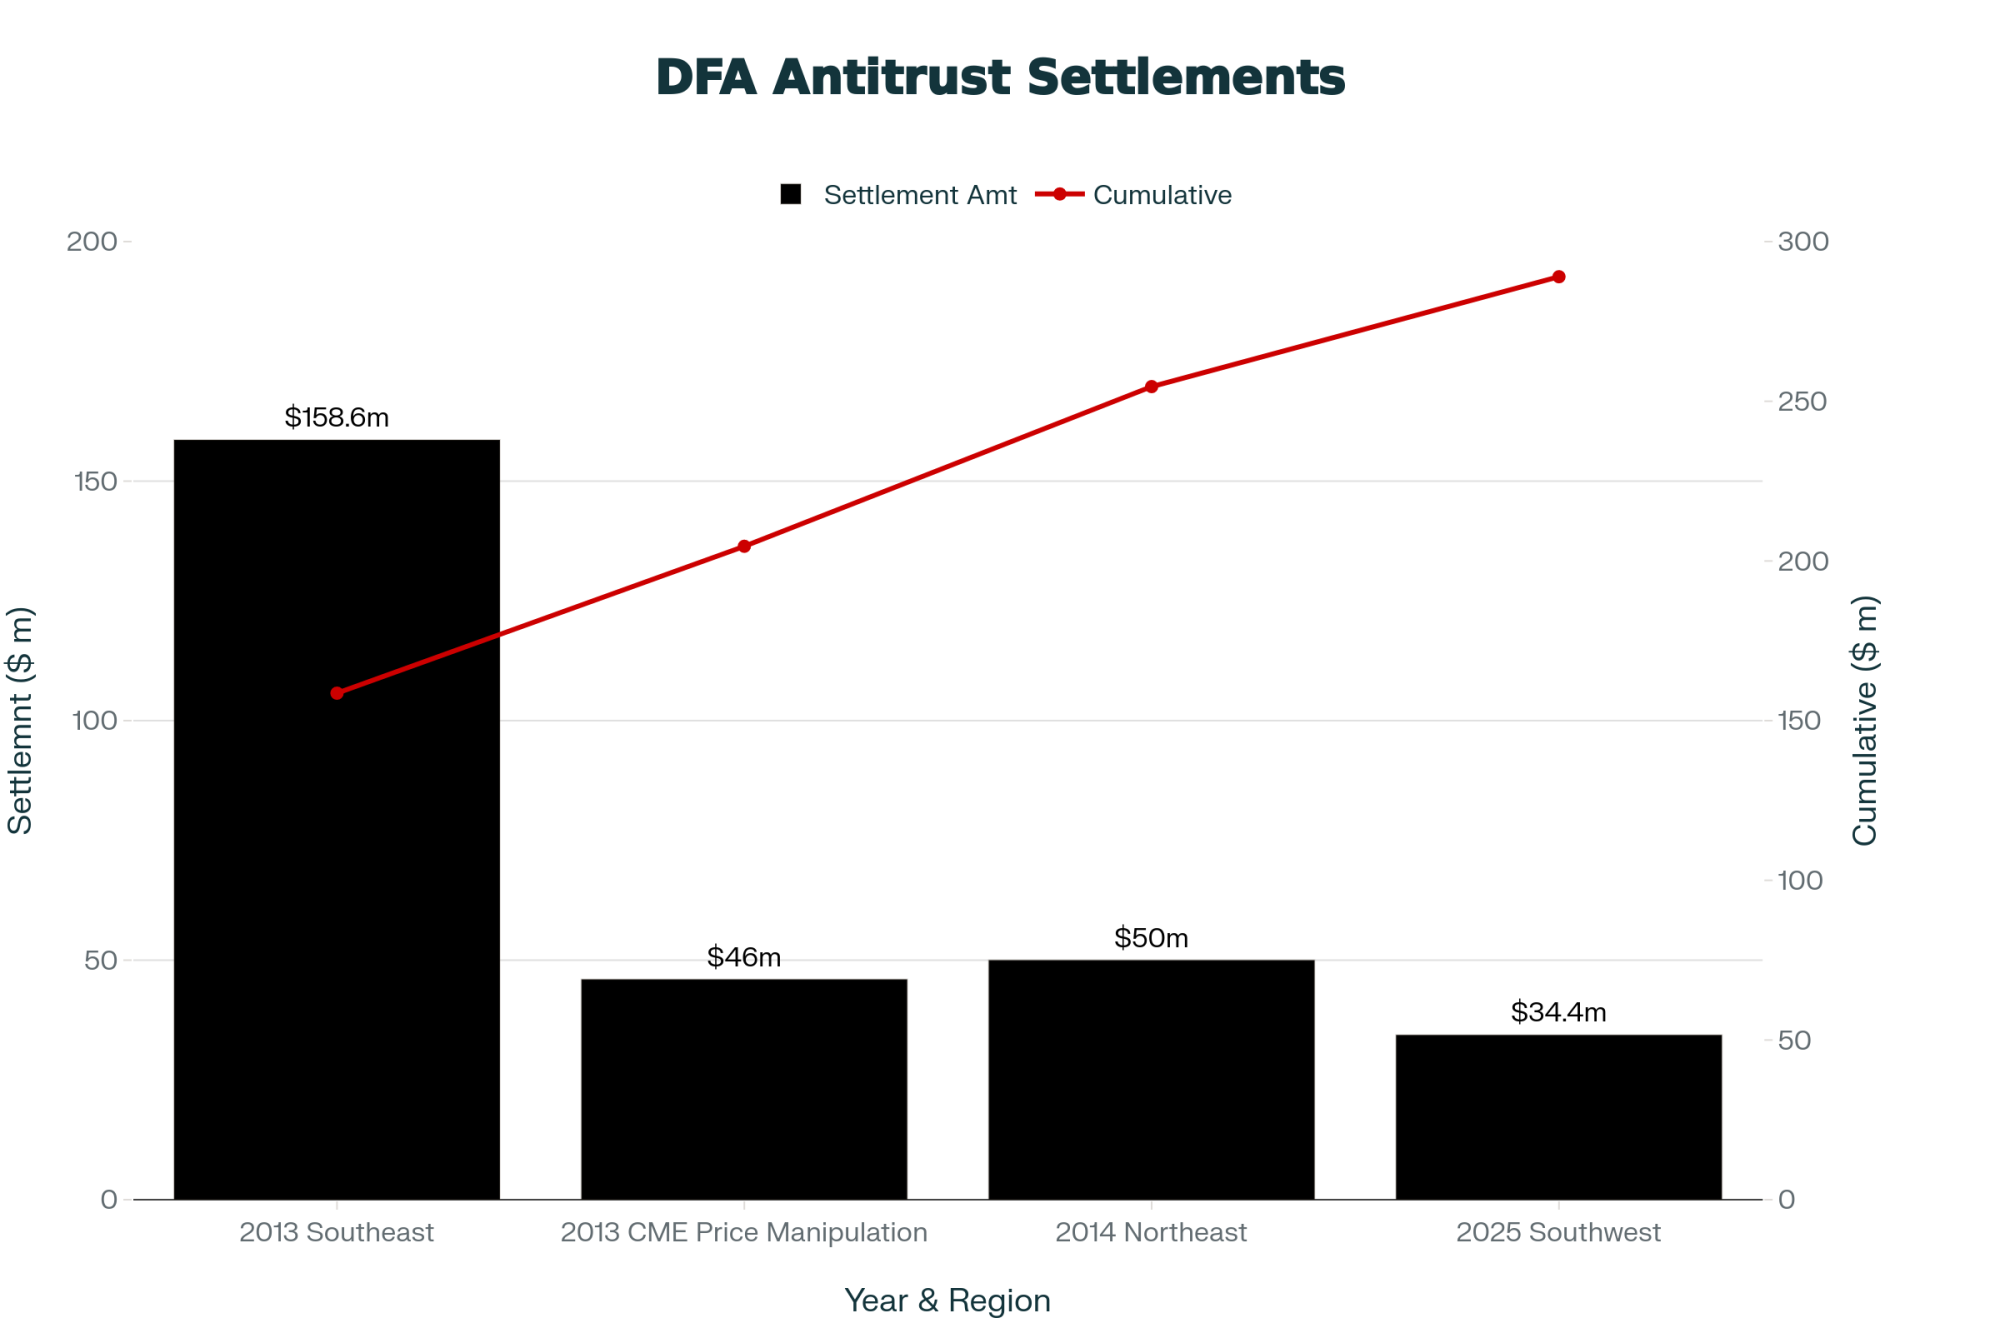
USDA Rural Development cooperative statistics show U.S. dairy cooperatives declined from 1,244 in 1964 to 118 by 2017. Today, the four largest dairy cooperatives market approximately 41% of all U.S. milk. The 2020 acquisition of 44 Dean Foods facilities by Dairy Farmers of America for $425 million represented a significant moment in this trend.
It’s worth noting that cooperatives themselves vary considerably in structure and function. Some focus primarily on bargaining and milk marketing—negotiating prices and finding homes for member milk without owning processing assets. Others operate significant cheese plants, bottling facilities, or ingredient manufacturing. Regional cooperatives often serve different functions than national organizations, and a producer’s relationship with a bargaining-only cooperative differs meaningfully from membership in a cooperative that processes your milk directly.
Understanding what your cooperative actually does, and how its structure affects your returns, matters more than ever in this environment.
Now, I think it’s important to understand the processor’s perspective here too. These are businesses operating in challenging conditions—thin margins, intense retail pressure, significant capital requirements, and increasing regulatory complexity around food safety and environmental compliance.
Mike Brown, senior vice president of economics at the International Dairy Foods Association, has explained the rationale pretty clearly: “Processing is a low-margin business. The investments we’re making in new capacity require a reliable, consistent supply to achieve the economies of scale that make modern processing viable.”
A cheese plant processing 4-5 million pounds of milk daily needs supply certainty. That’s a legitimate operational requirement. The question isn’t whether processors are making rational business decisions—clearly they are. The question is how the overall market structure affects outcomes across the dairy sector.
New Processing Investment and Export Growth
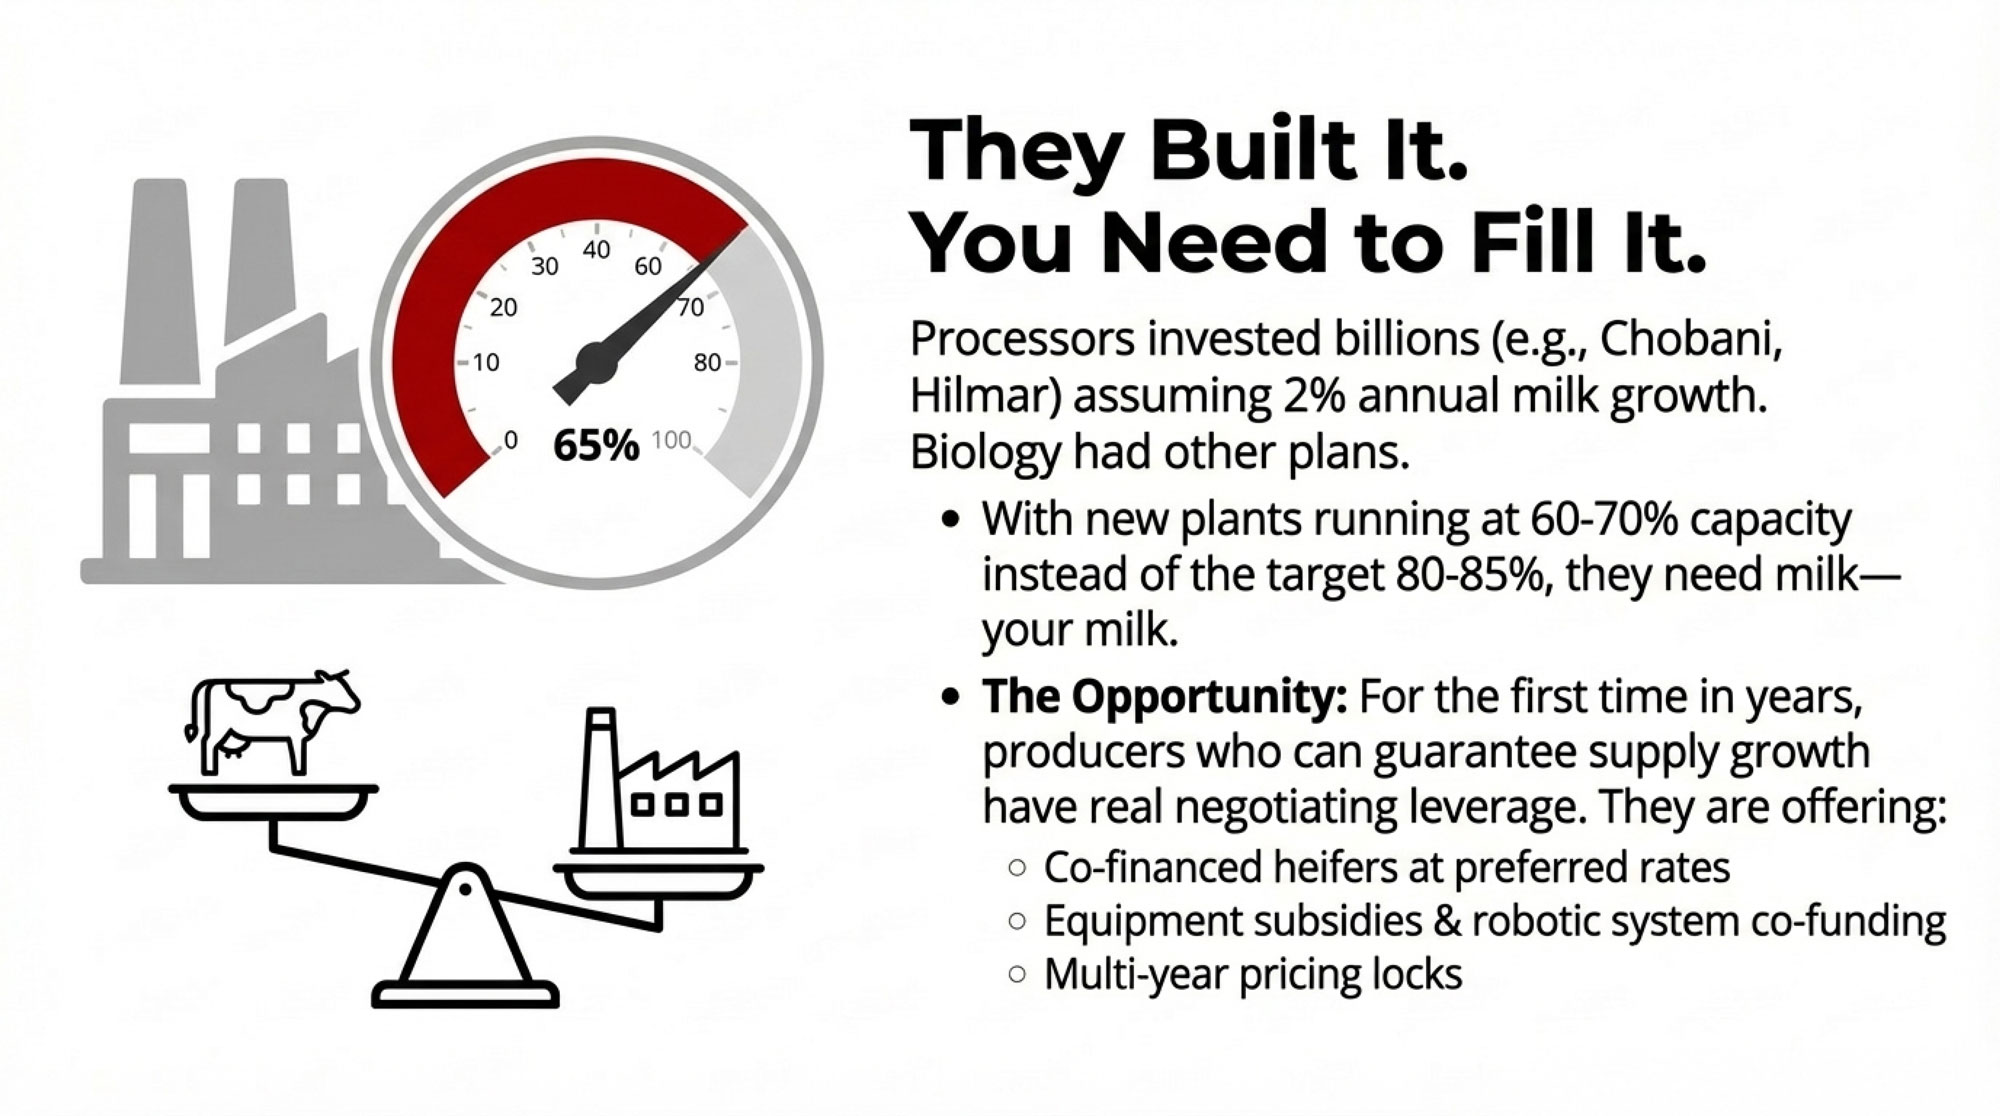
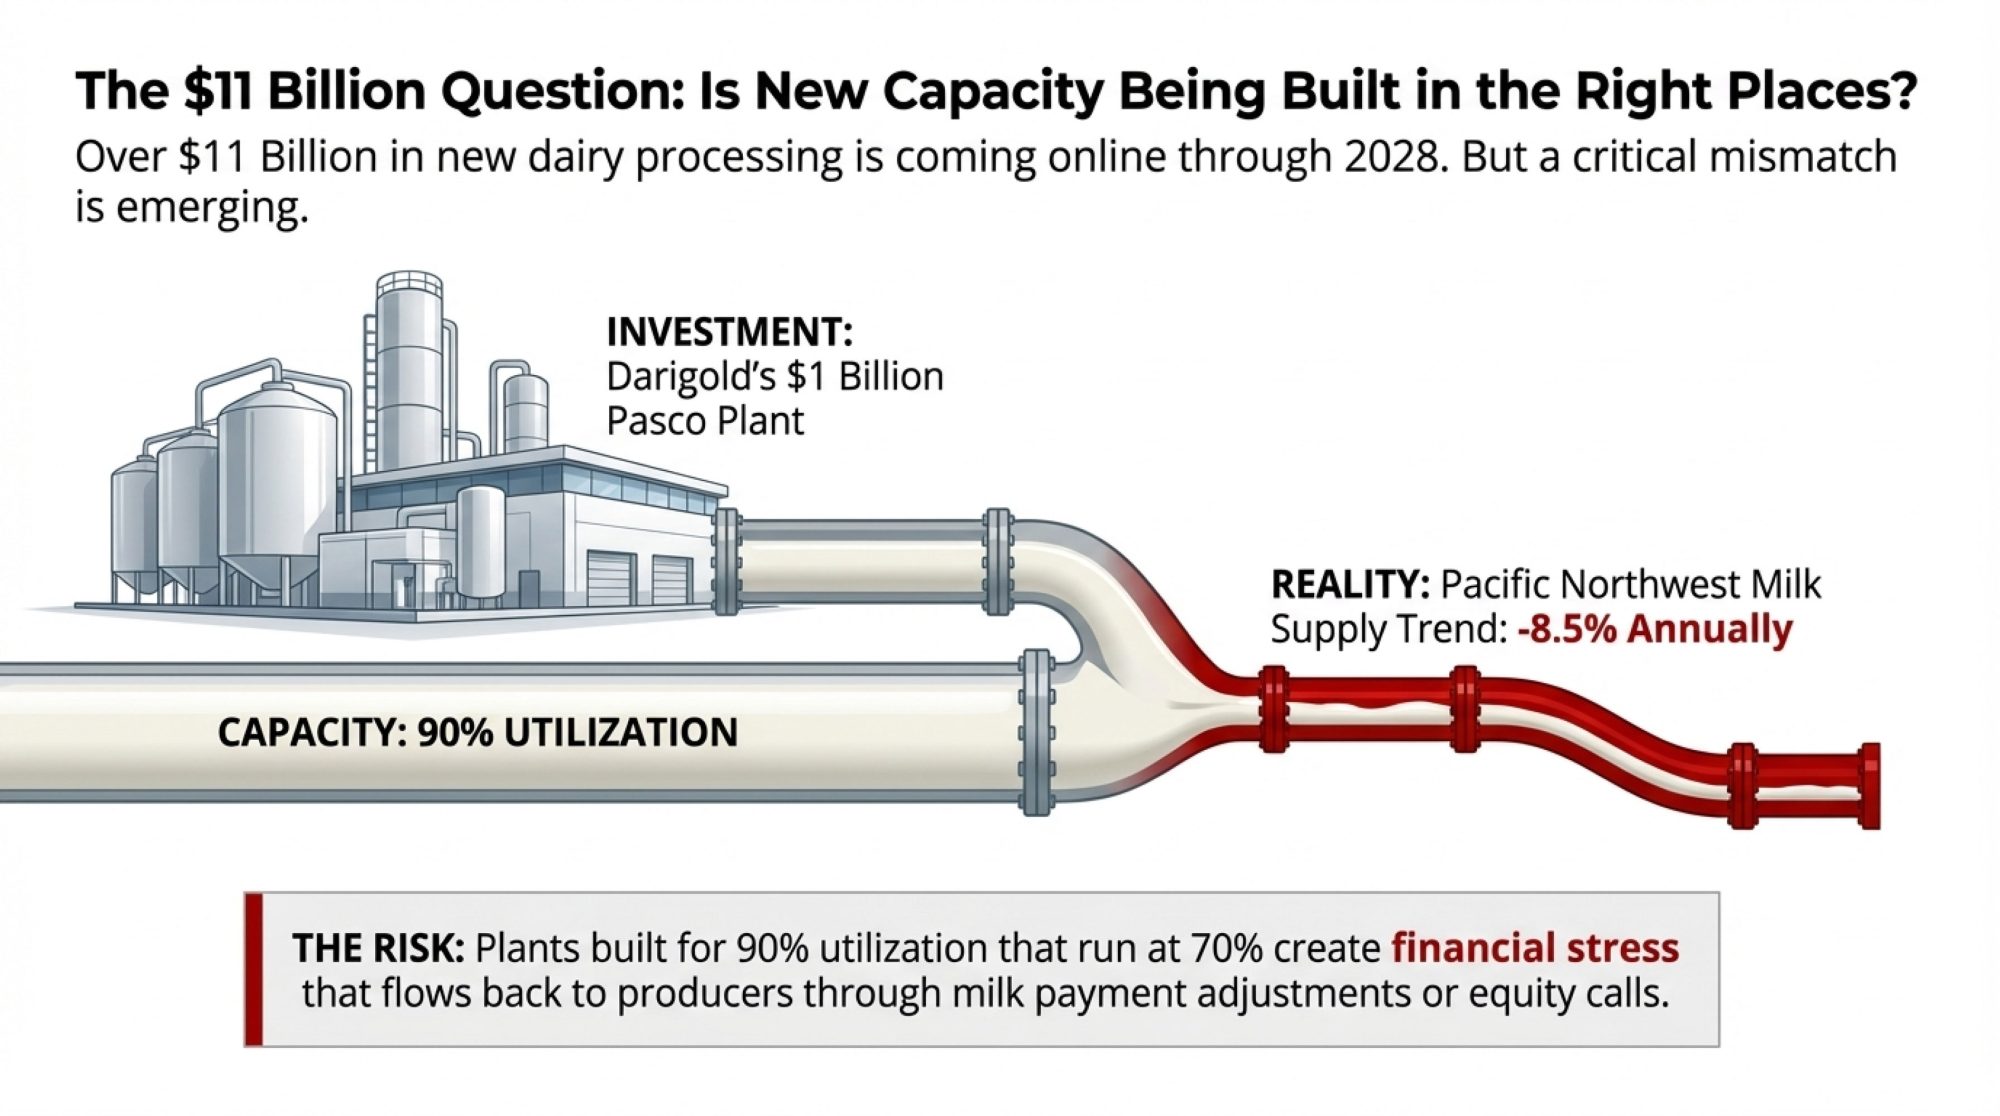
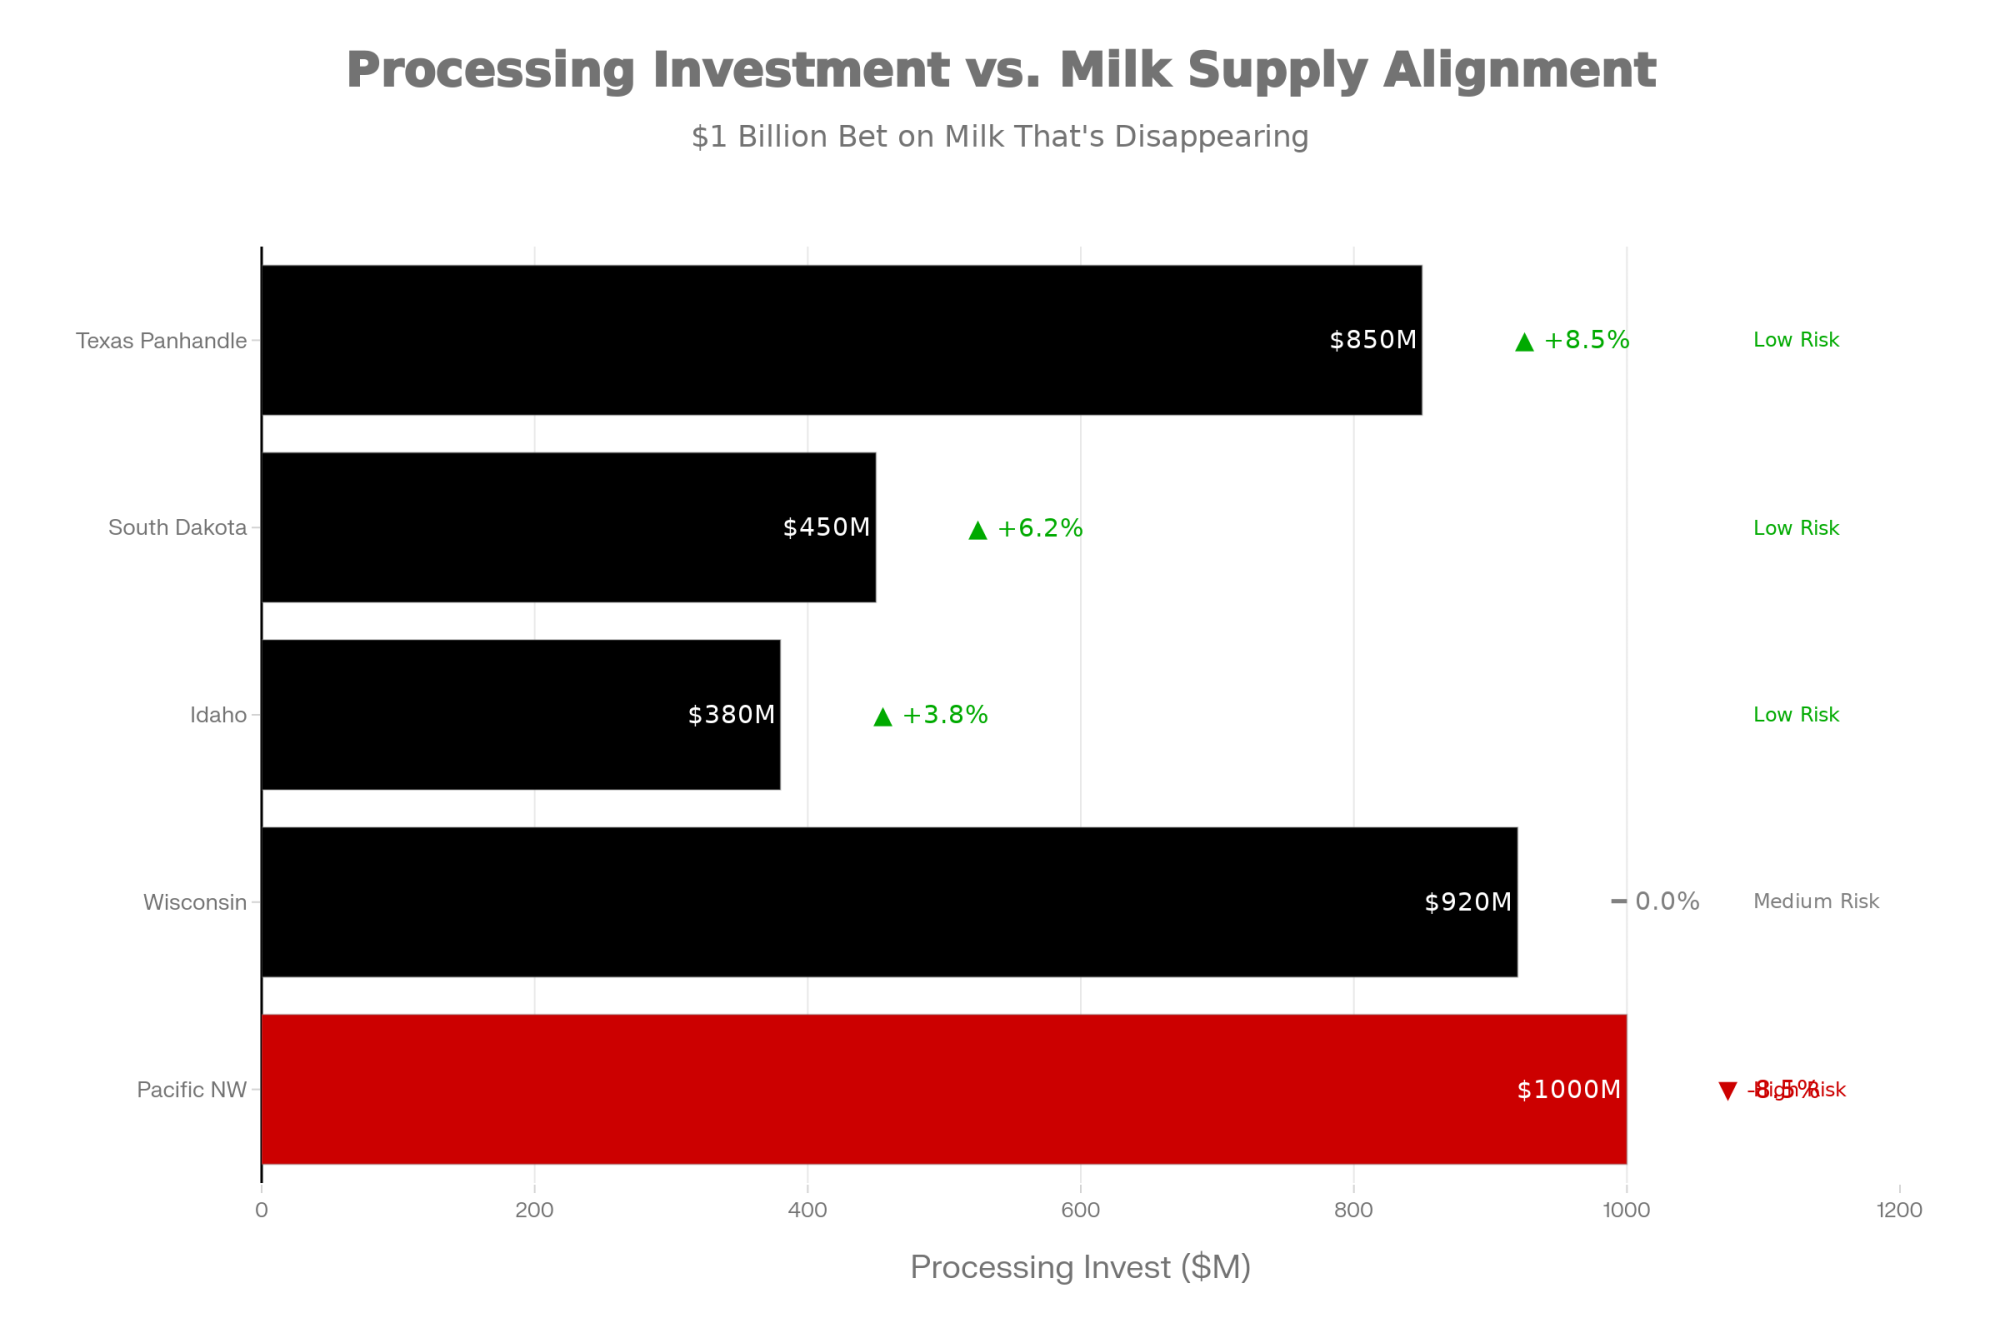
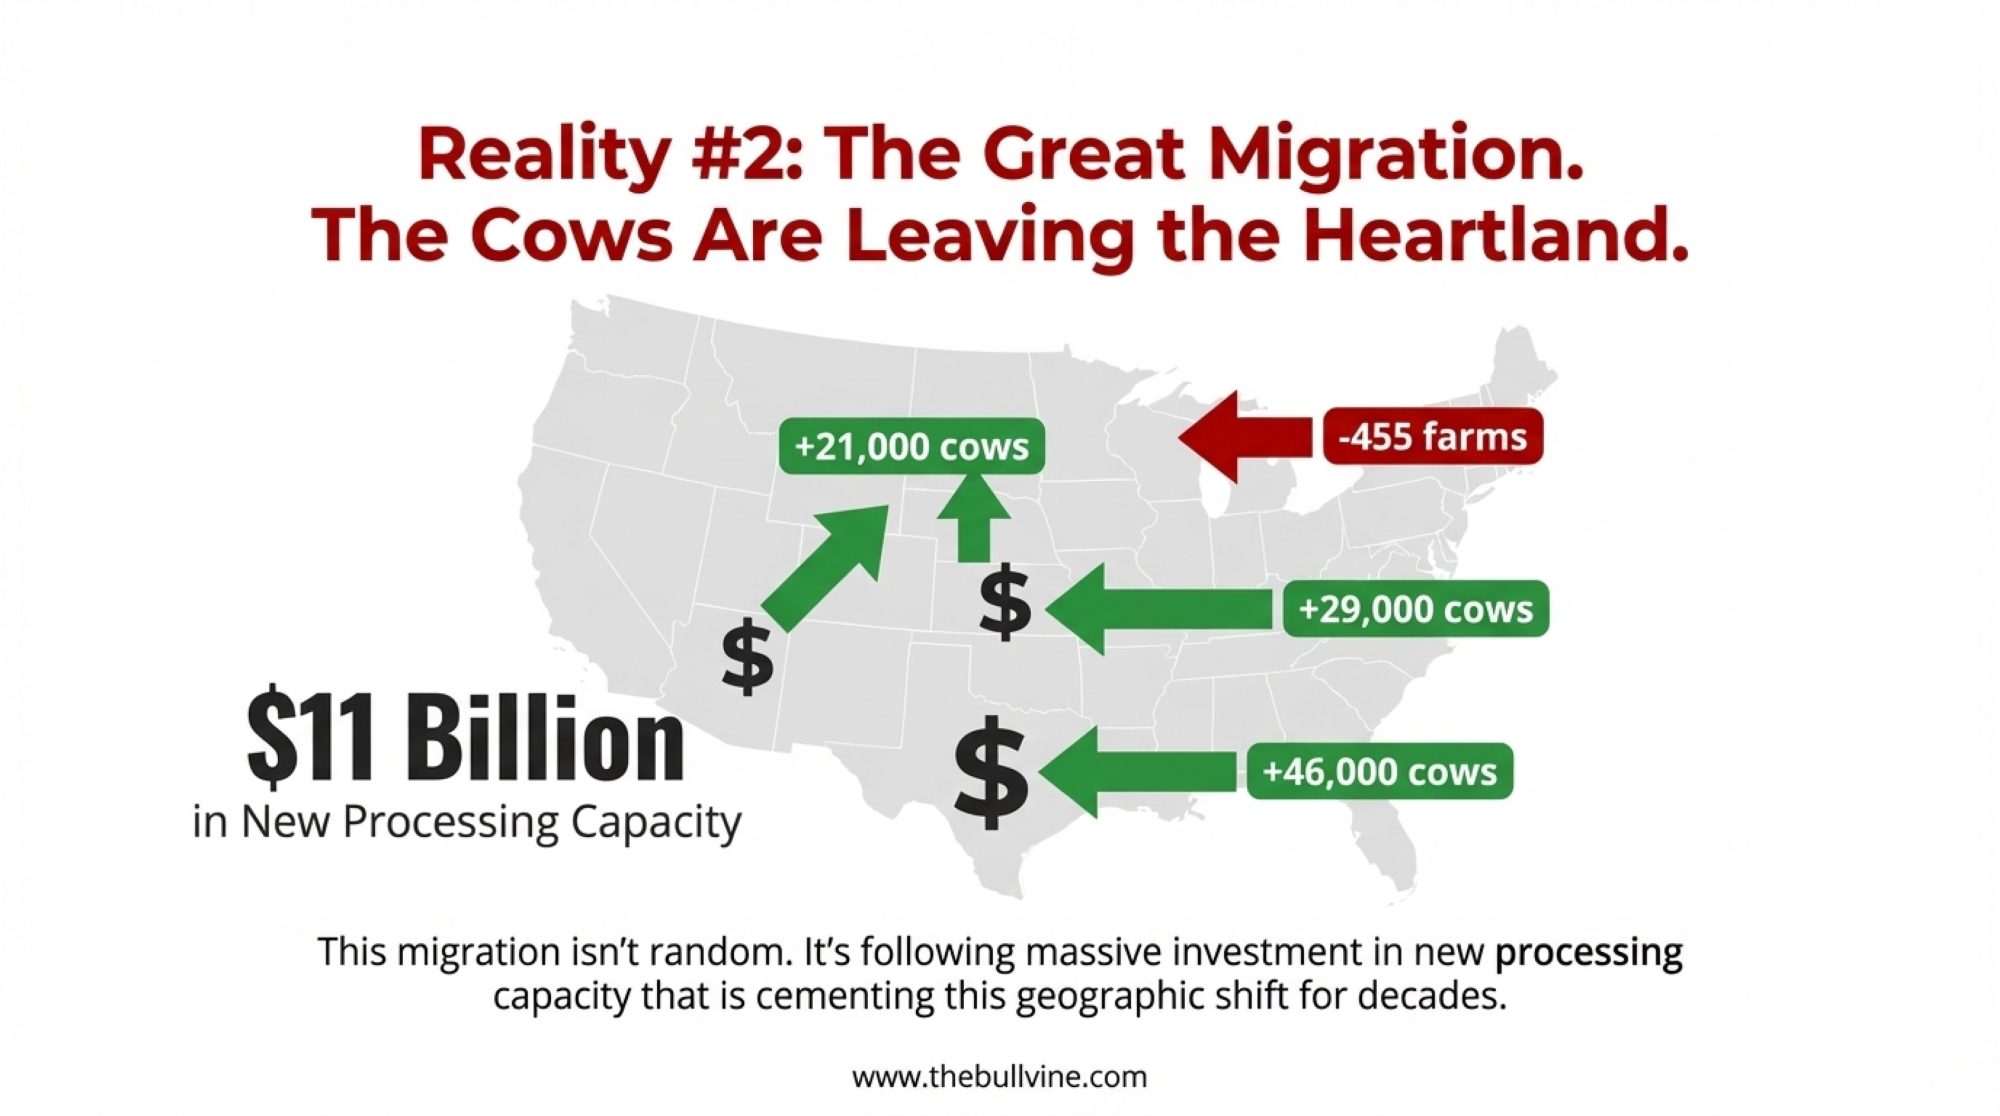
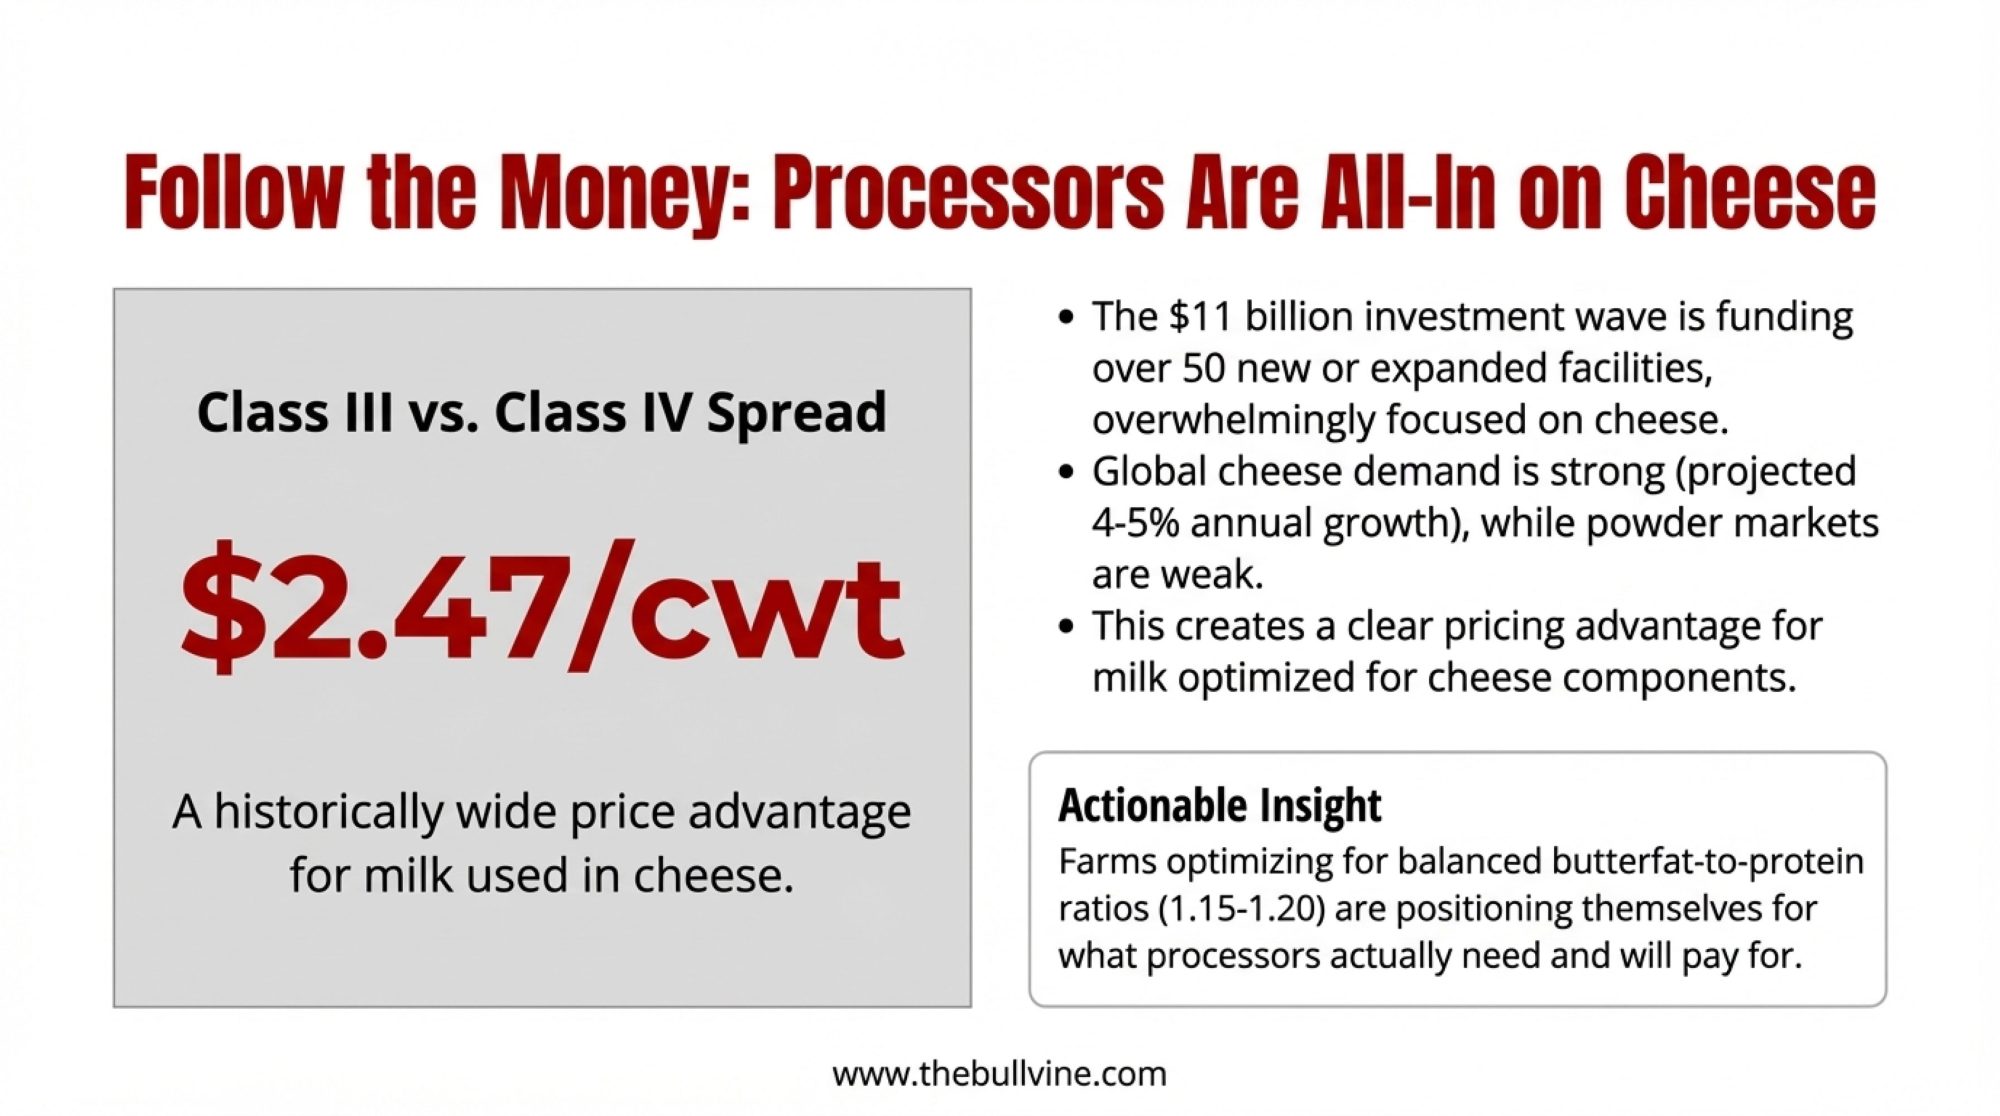
What’s encouraging is the investment flowing into the industry right now. The International Dairy Foods Association reports approximately $11 billion in new dairy processing investment across more than 50 facilities in 19 states. NMPF president and CEO Gregg Doud has called it unprecedented in American agricultural history.

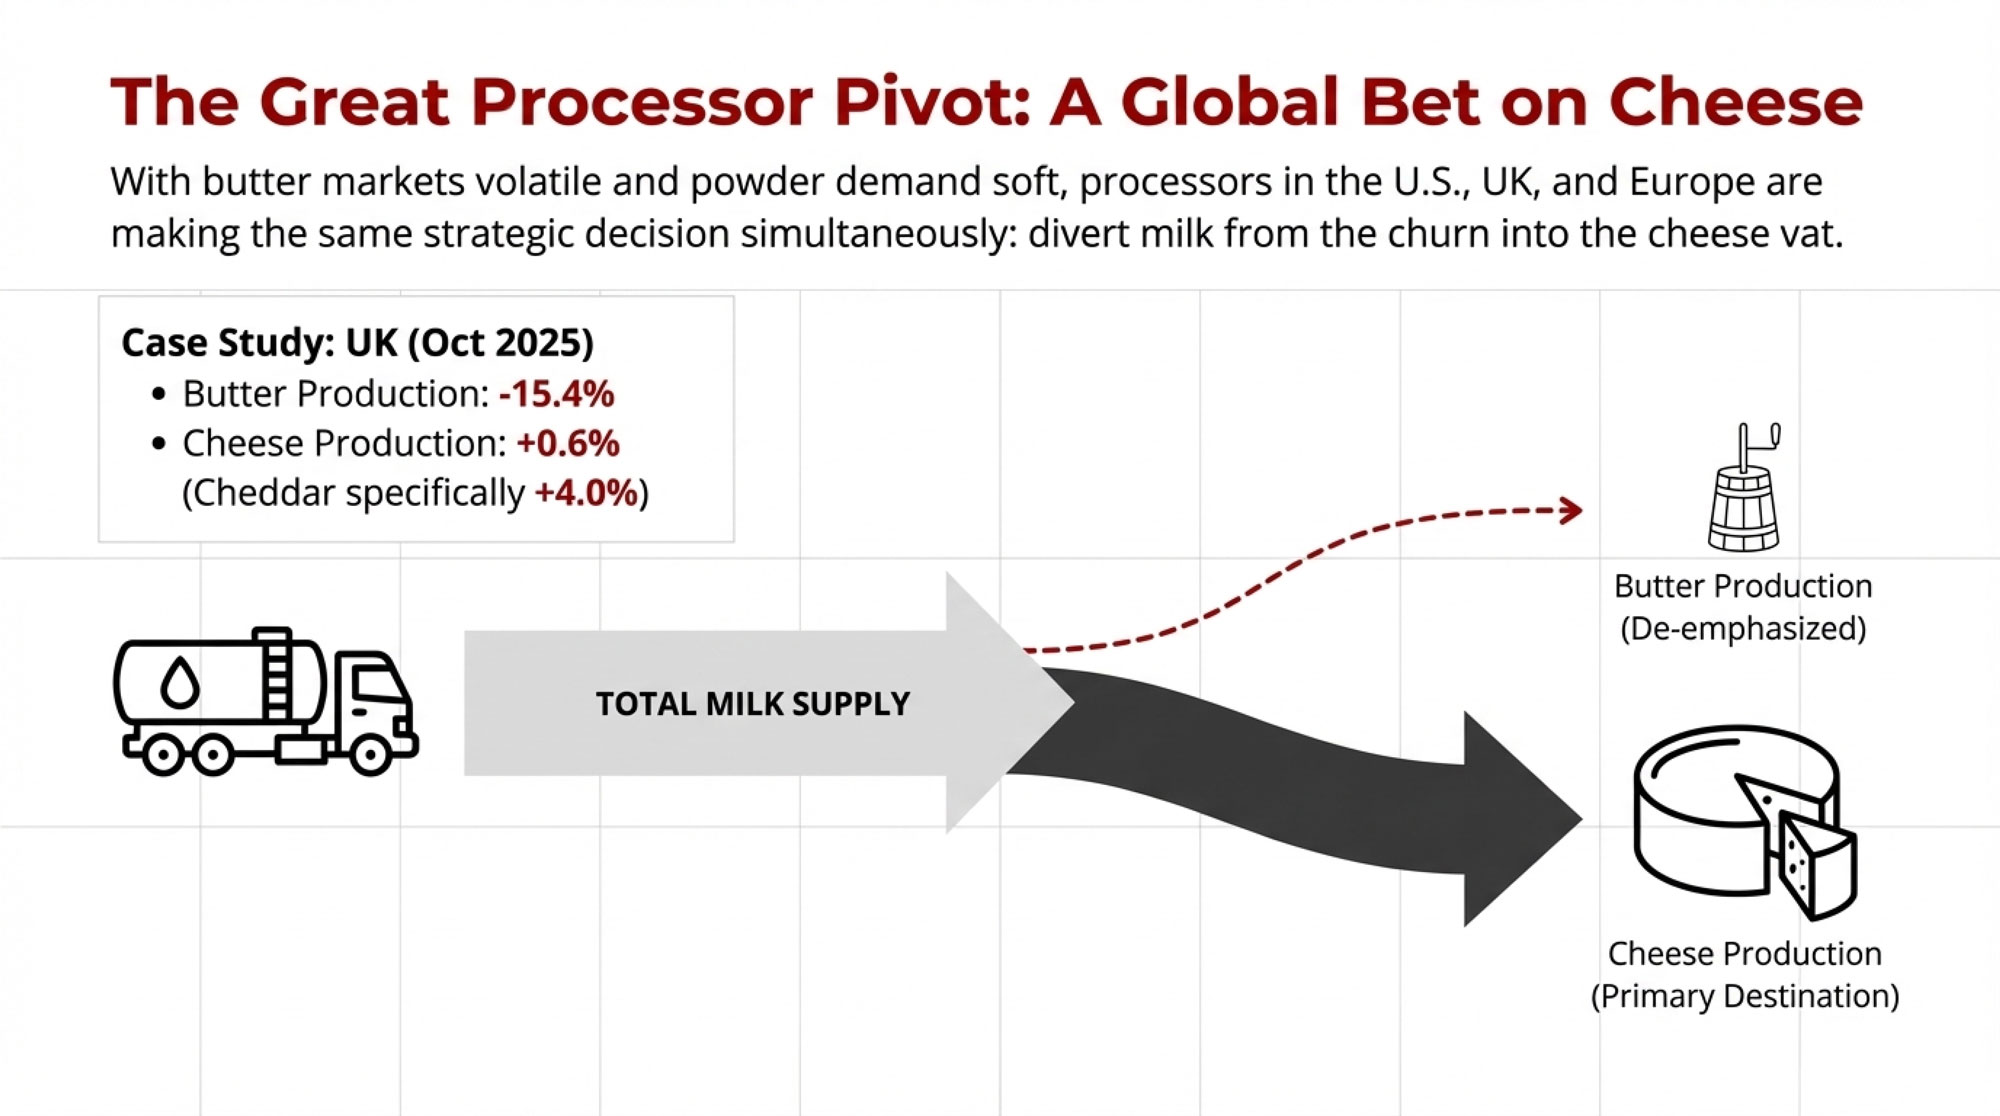
Much of this investment is oriented toward export markets—cheese, butter, and milk powder destined for growing demand in Asia and other regions. U.S. dairy exports have grown substantially over the past decade, and this processing capacity positions the industry to capture more international market share.
That’s genuinely positive for the industry’s future. Expanded processing capacity creates new market opportunities for milk, and export growth provides demand beyond what domestic consumption alone can support.
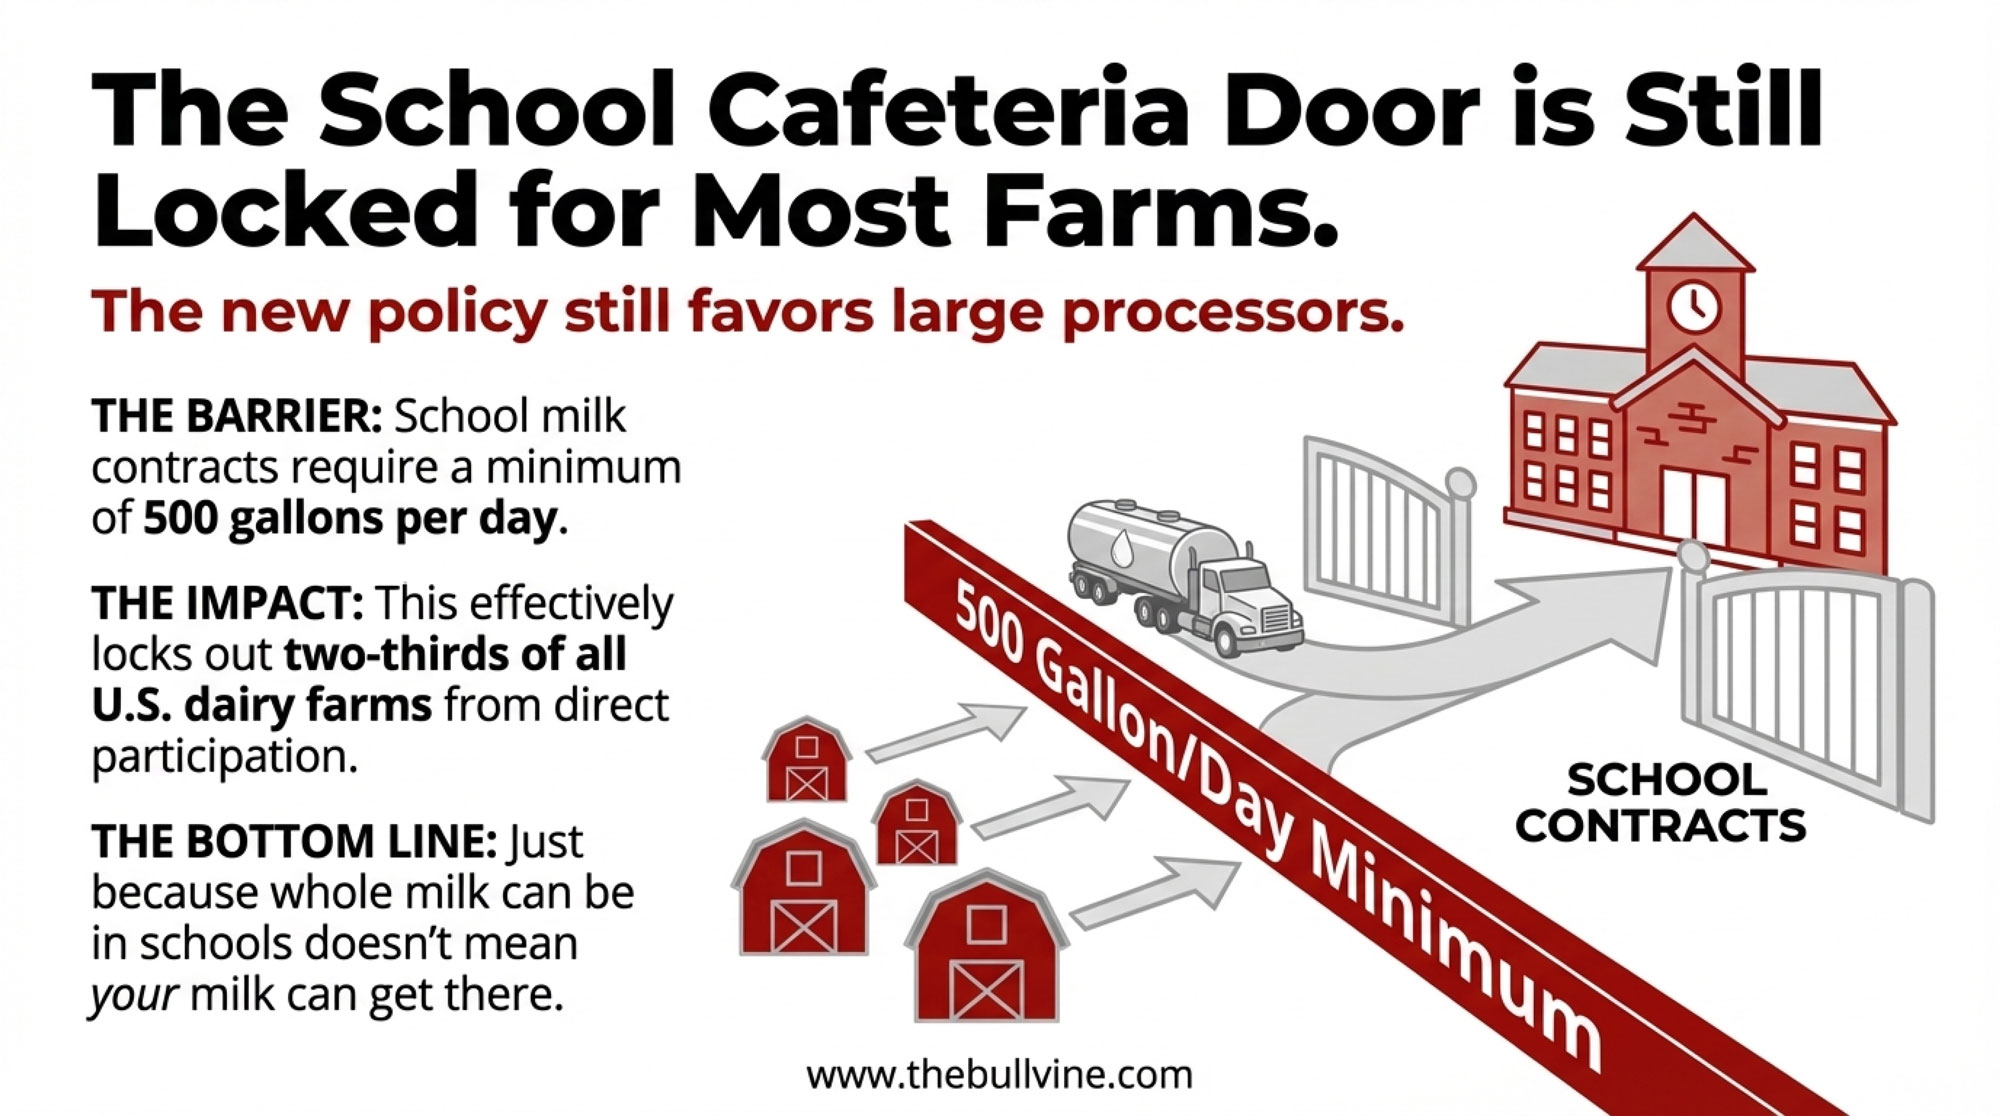
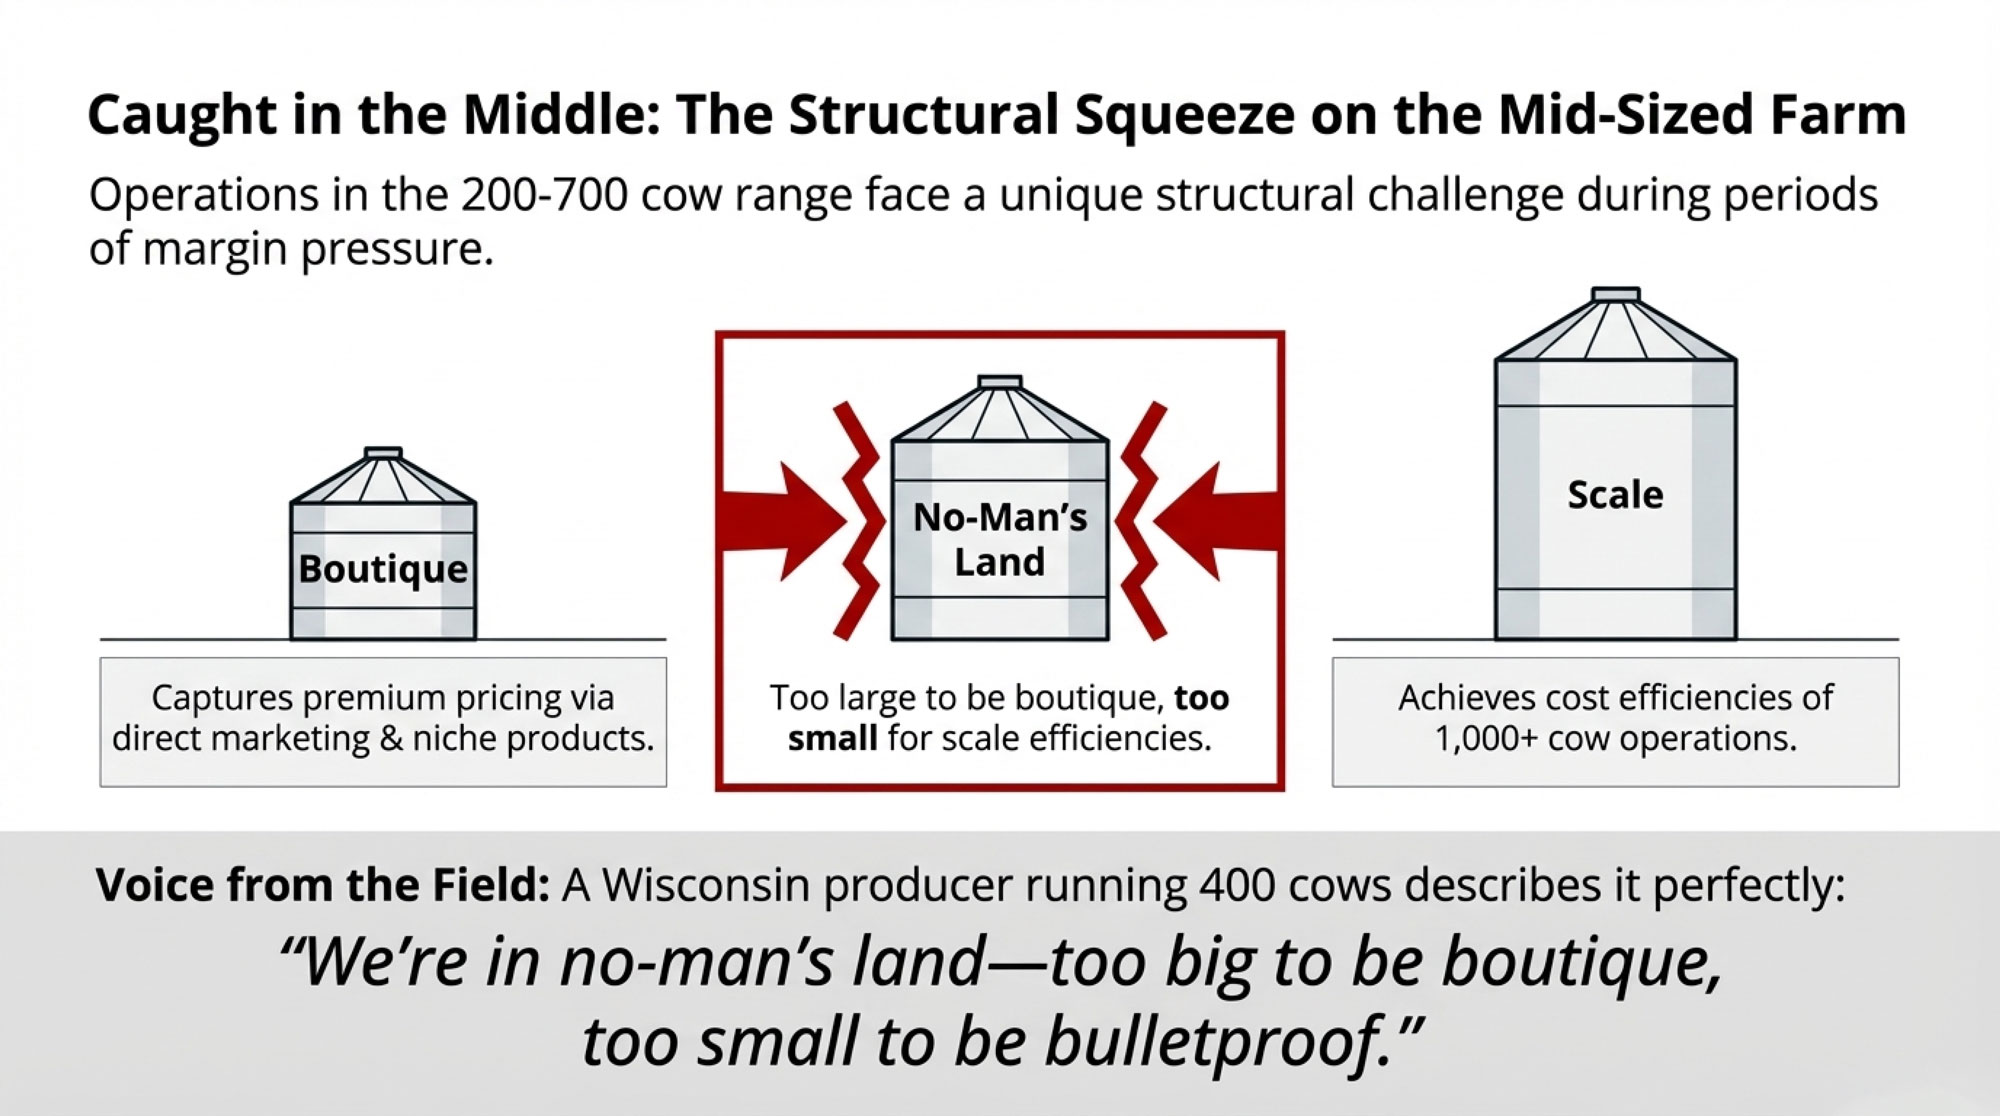
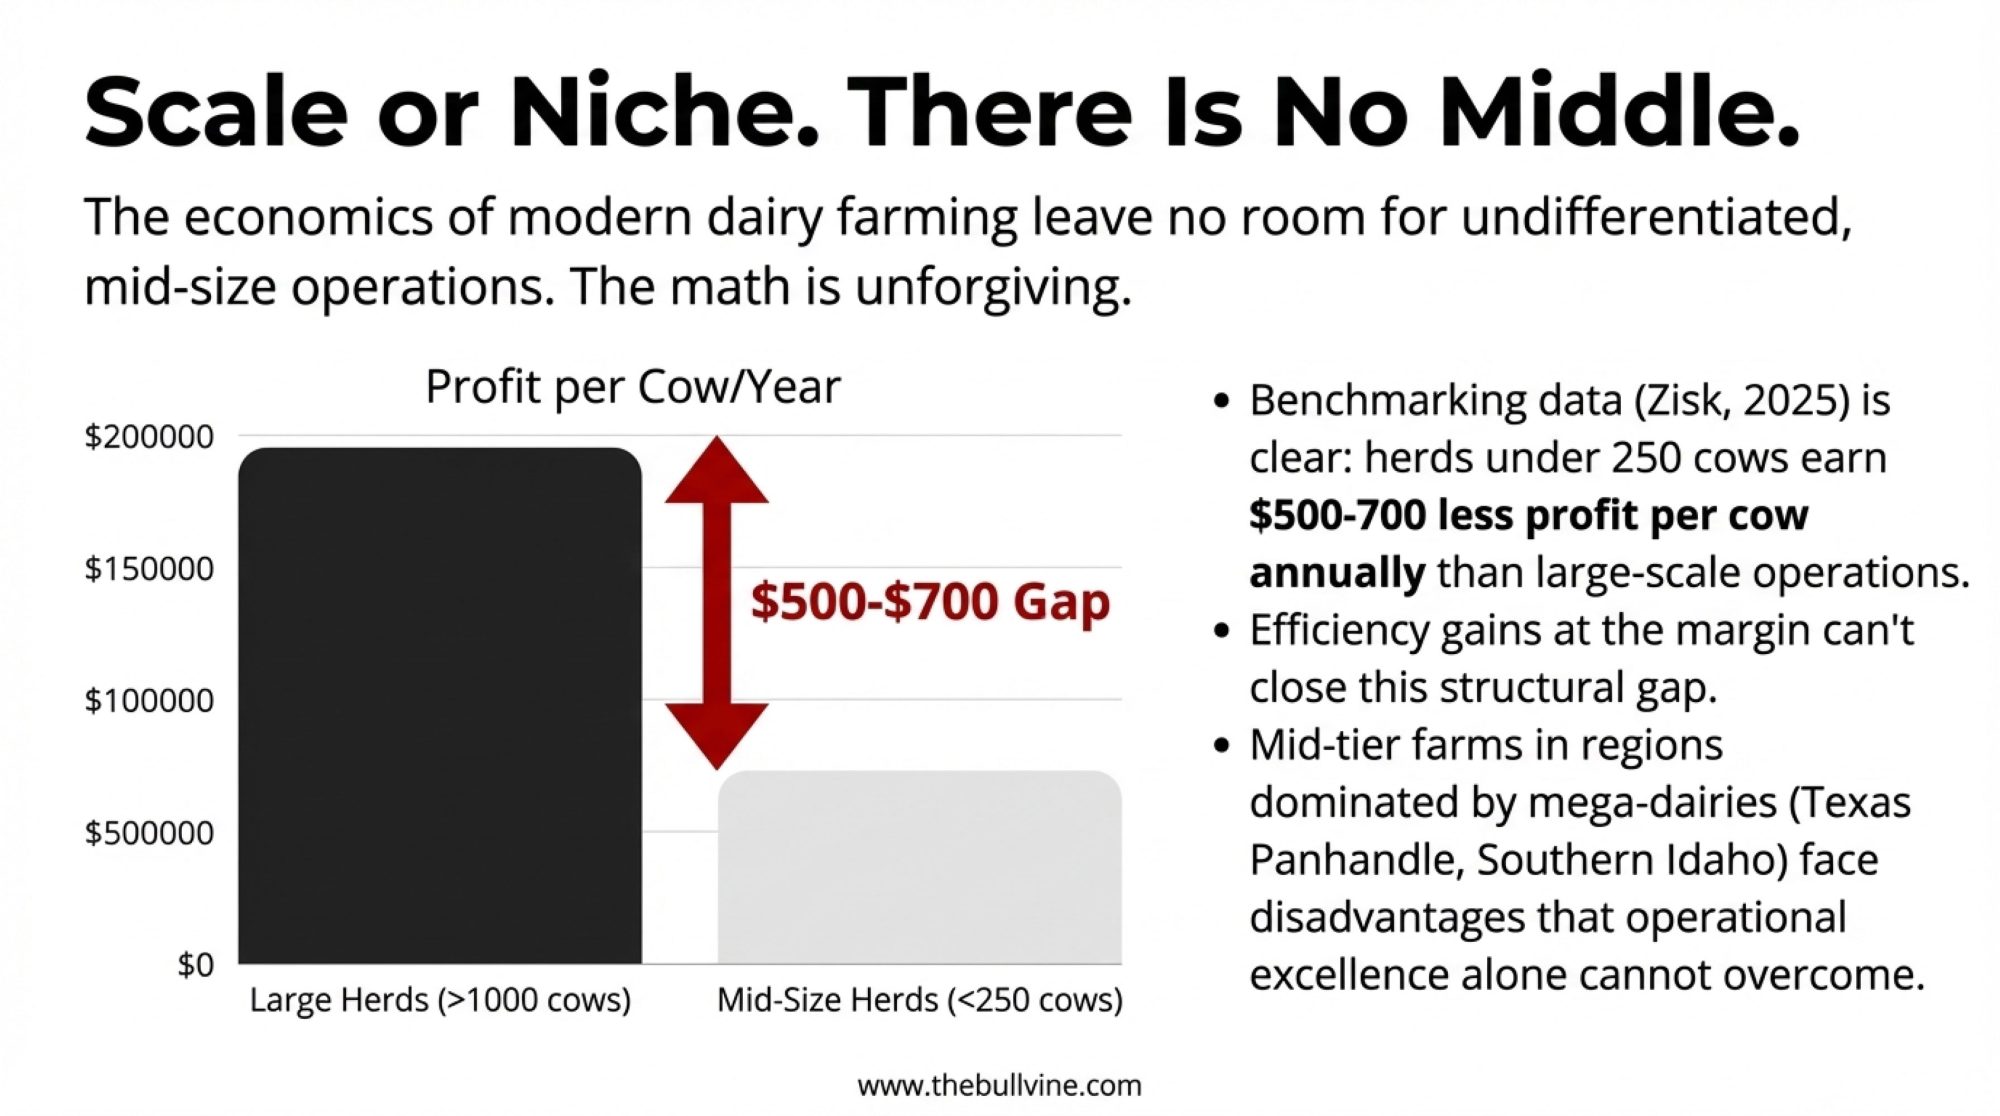
The nuance worth noting: much of this new capacity appears oriented toward long-term supply agreements with larger operations—dairies that can provide consistent, high-volume supply year-round. For a 400-cow dairy in Michigan or a 600-cow operation in Pennsylvania, this raises practical questions about market access as the processing landscape evolves.
This isn’t cause for alarm, but it is cause for planning. Understanding where processing investment is flowing—and what supply characteristics those facilities seek—can inform strategic decisions.
Policy Developments
On the policy front, Senators Kirsten Gillibrand of New York and Susan Collins of Maine have introduced the Fair Milk Pricing for Farmers Act, that’s H.R. 295 in the House and S. 581 in the Senate. The bill would require processors to report production costs and product yields to the USDA every two years.
Senator Gillibrand framed the rationale in her February 2025 announcement: “Requiring manufacturers to report dairy processing costs on a biennial basis will give dairy producers, processors, and cooperatives the data they need to ensure that their prices accurately reflect the costs of production.”
This seems like a reasonable transparency measure, and it’s attracted bipartisan support from both producer and processor organizations.
That said, it’s worth understanding what the legislation does and doesn’t do. It creates baseline transparency—useful for FMMO hearing processes when make allowances and pricing formulas are adjusted. It doesn’t set minimum prices, mandate formula changes, or establish collective bargaining frameworks.
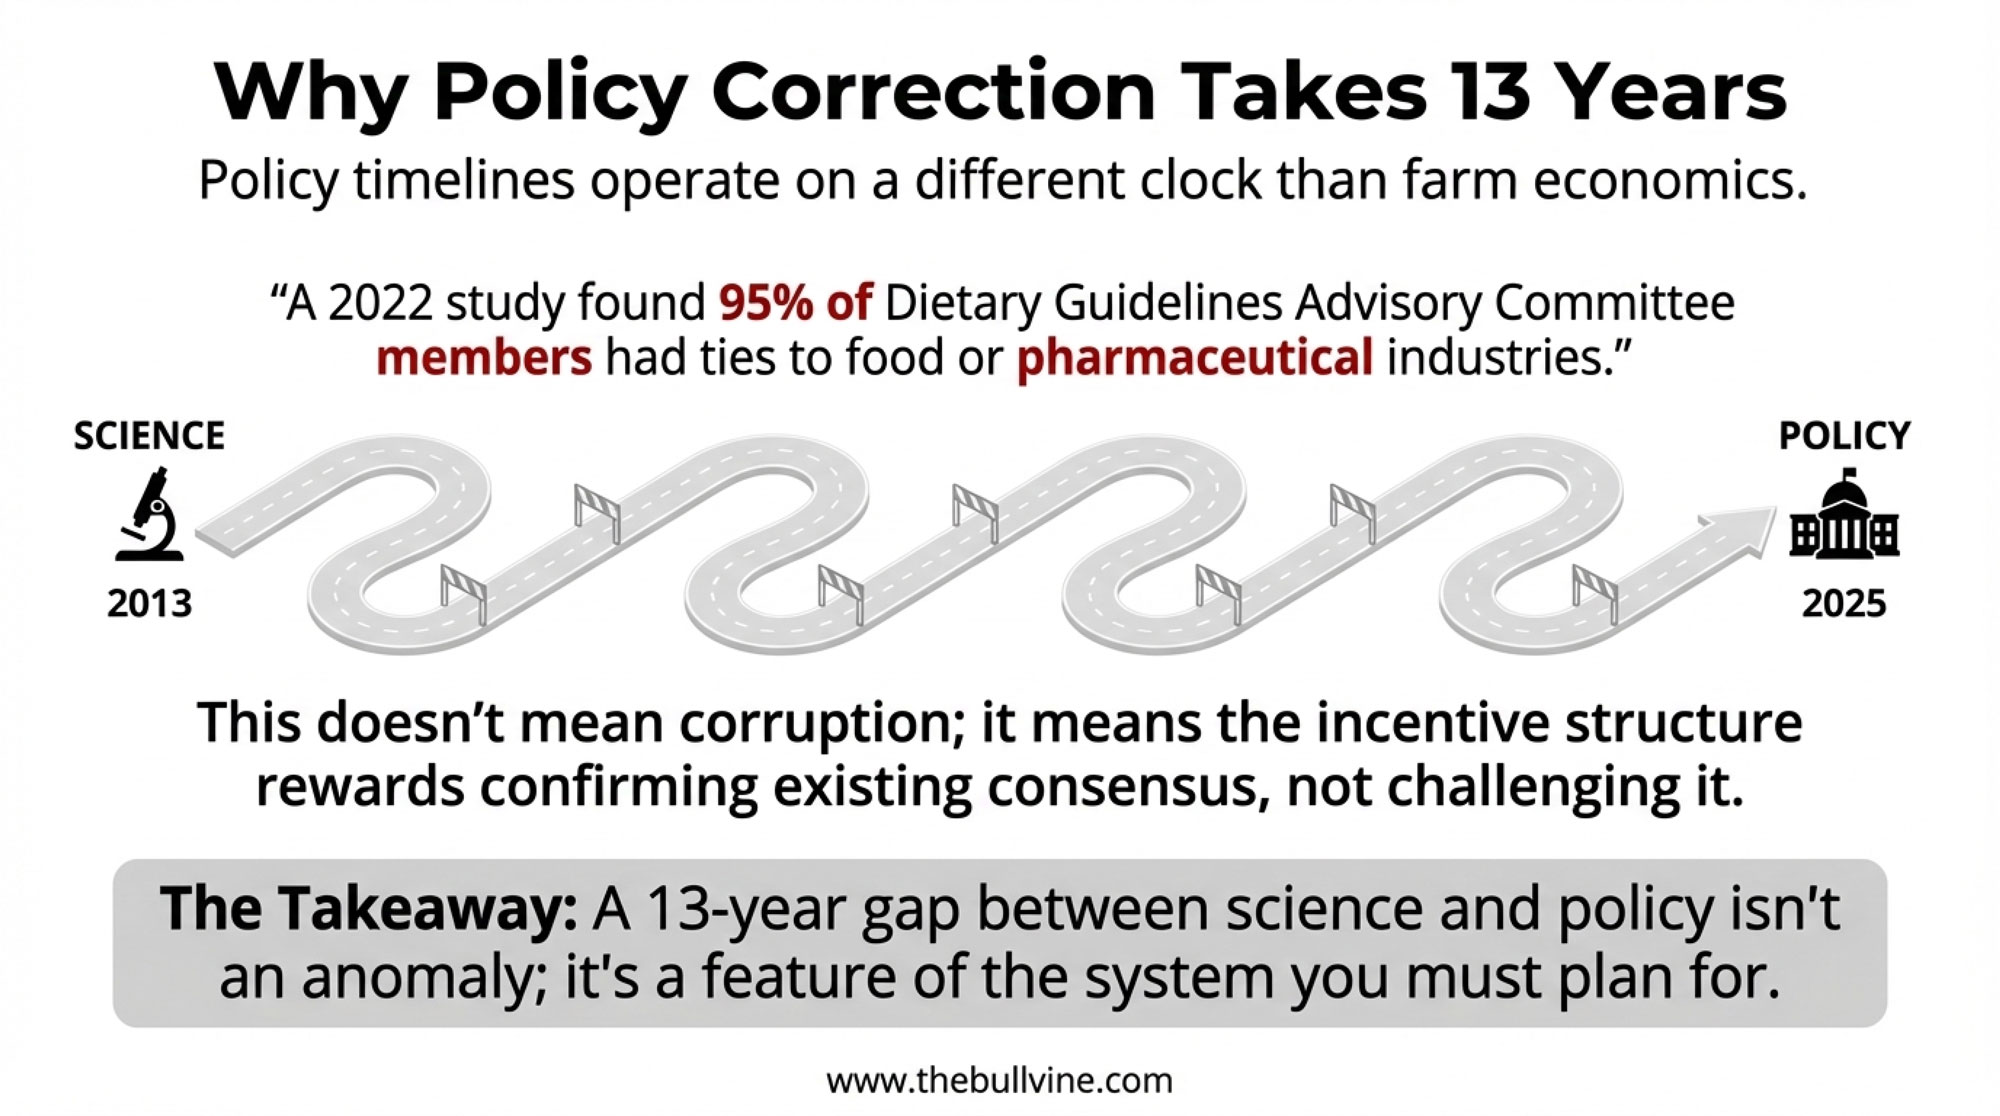
As the European research suggests, transparency is valuable but may not be sufficient on its own. It’s one piece of a larger puzzle.
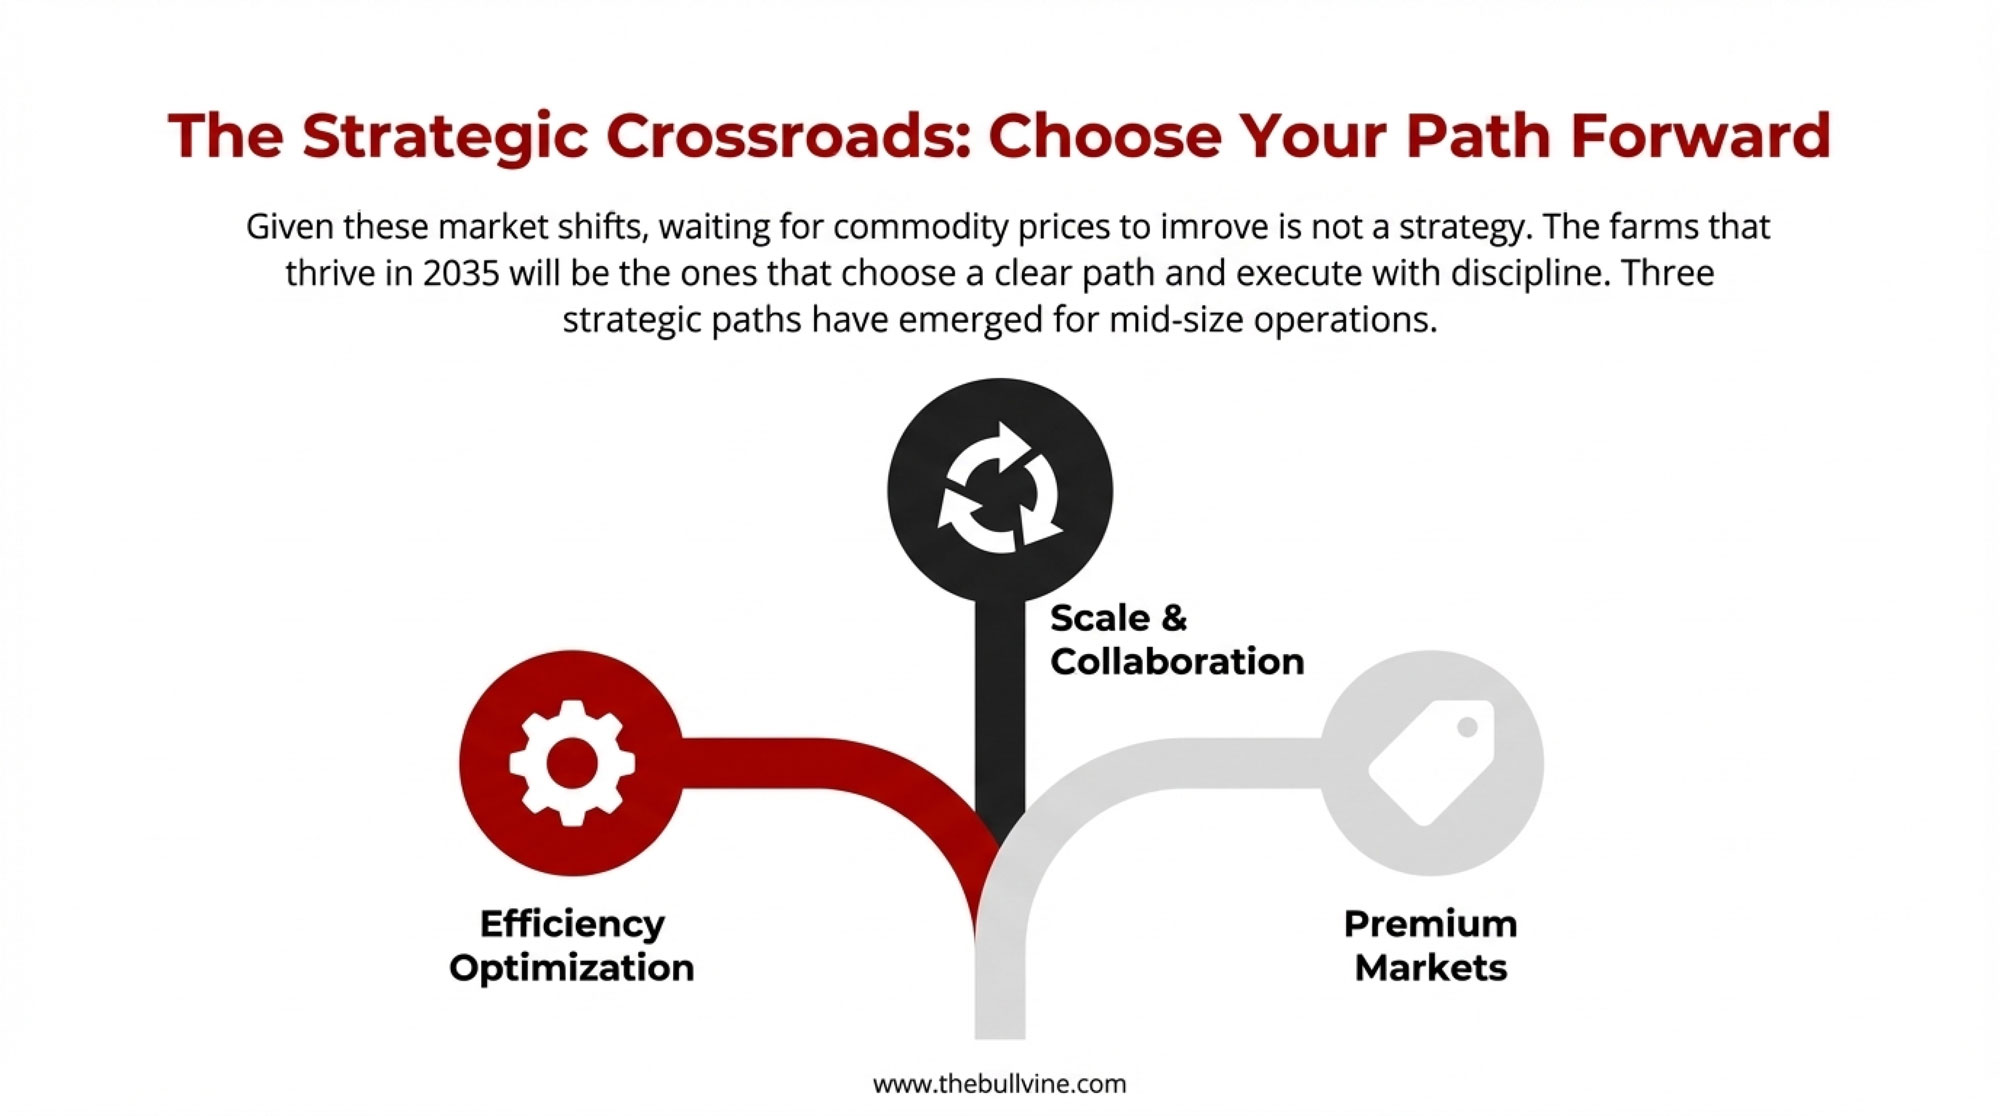
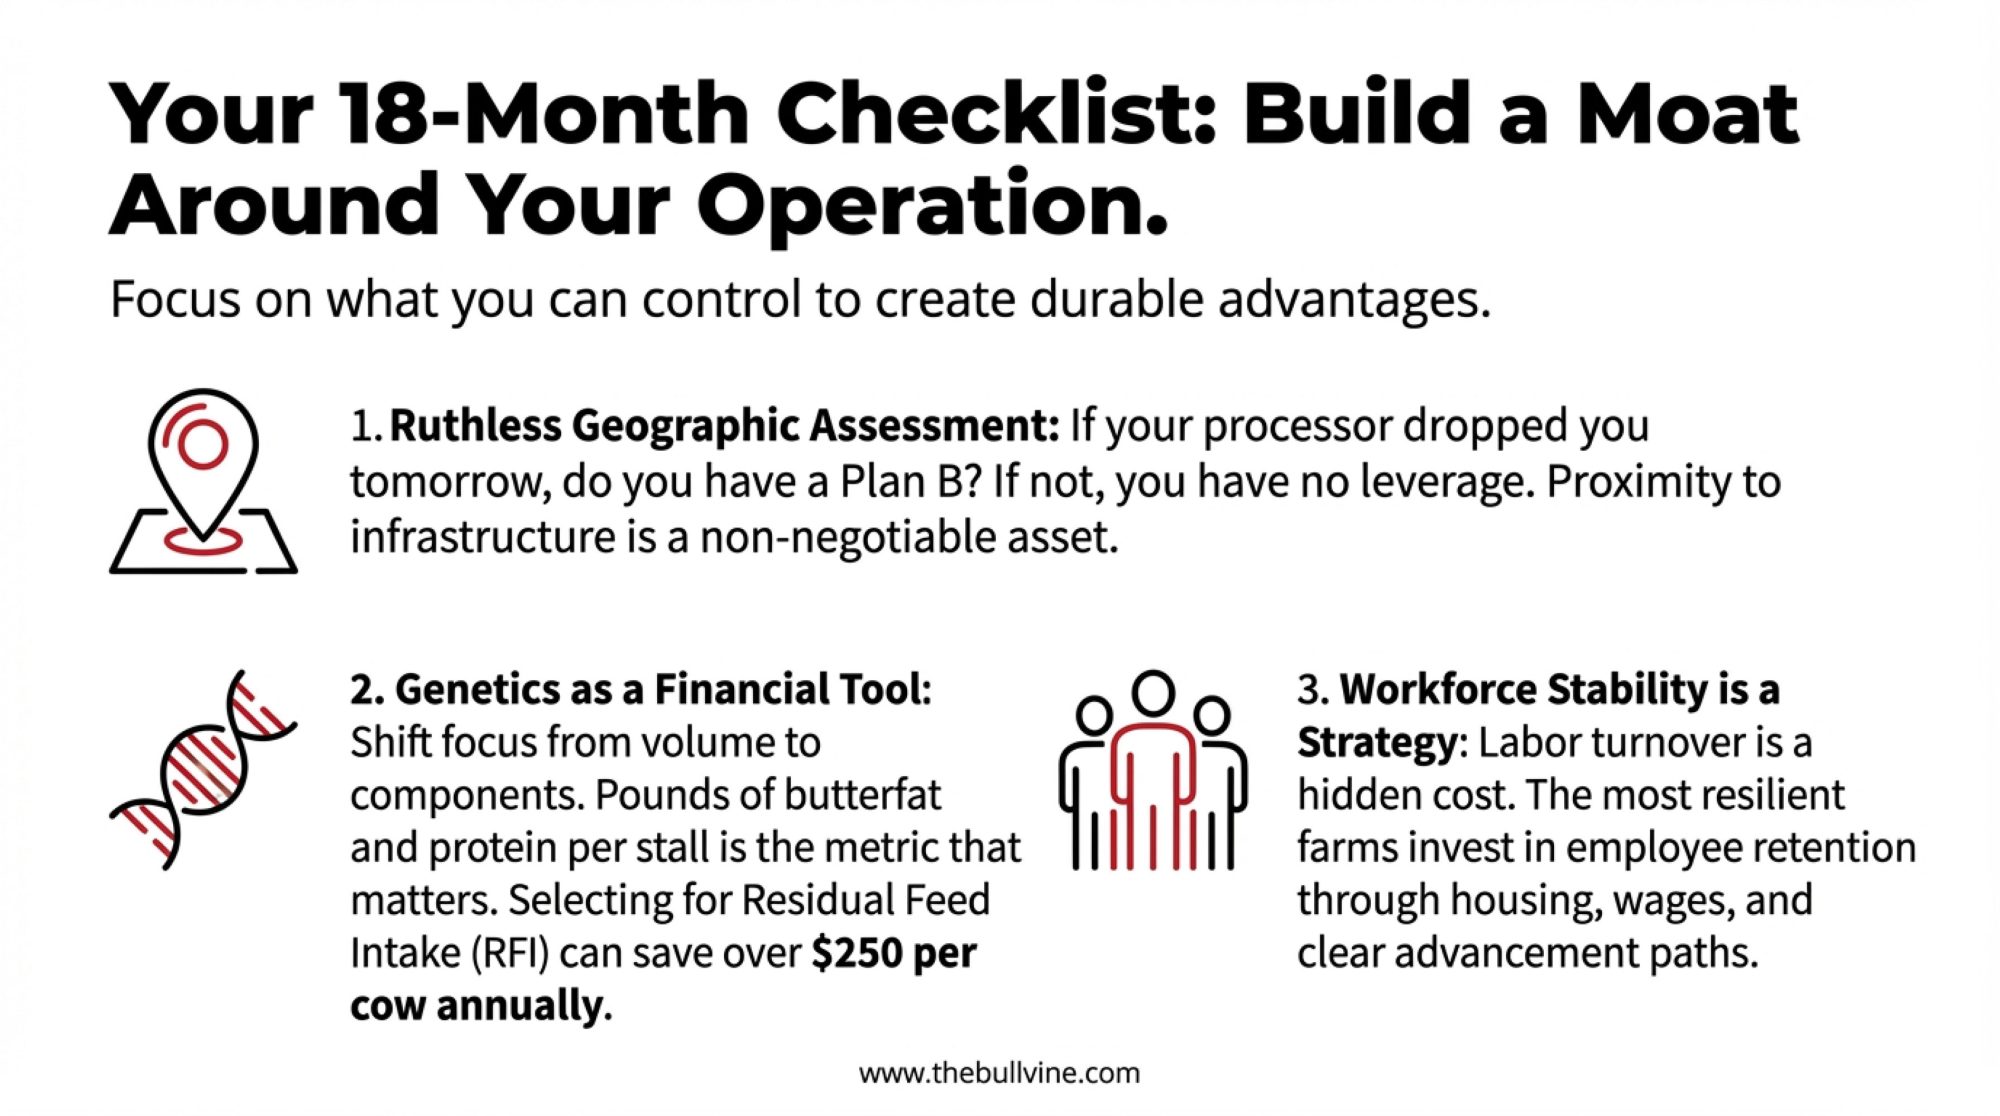
Strategic Options for Mid-Size Operations
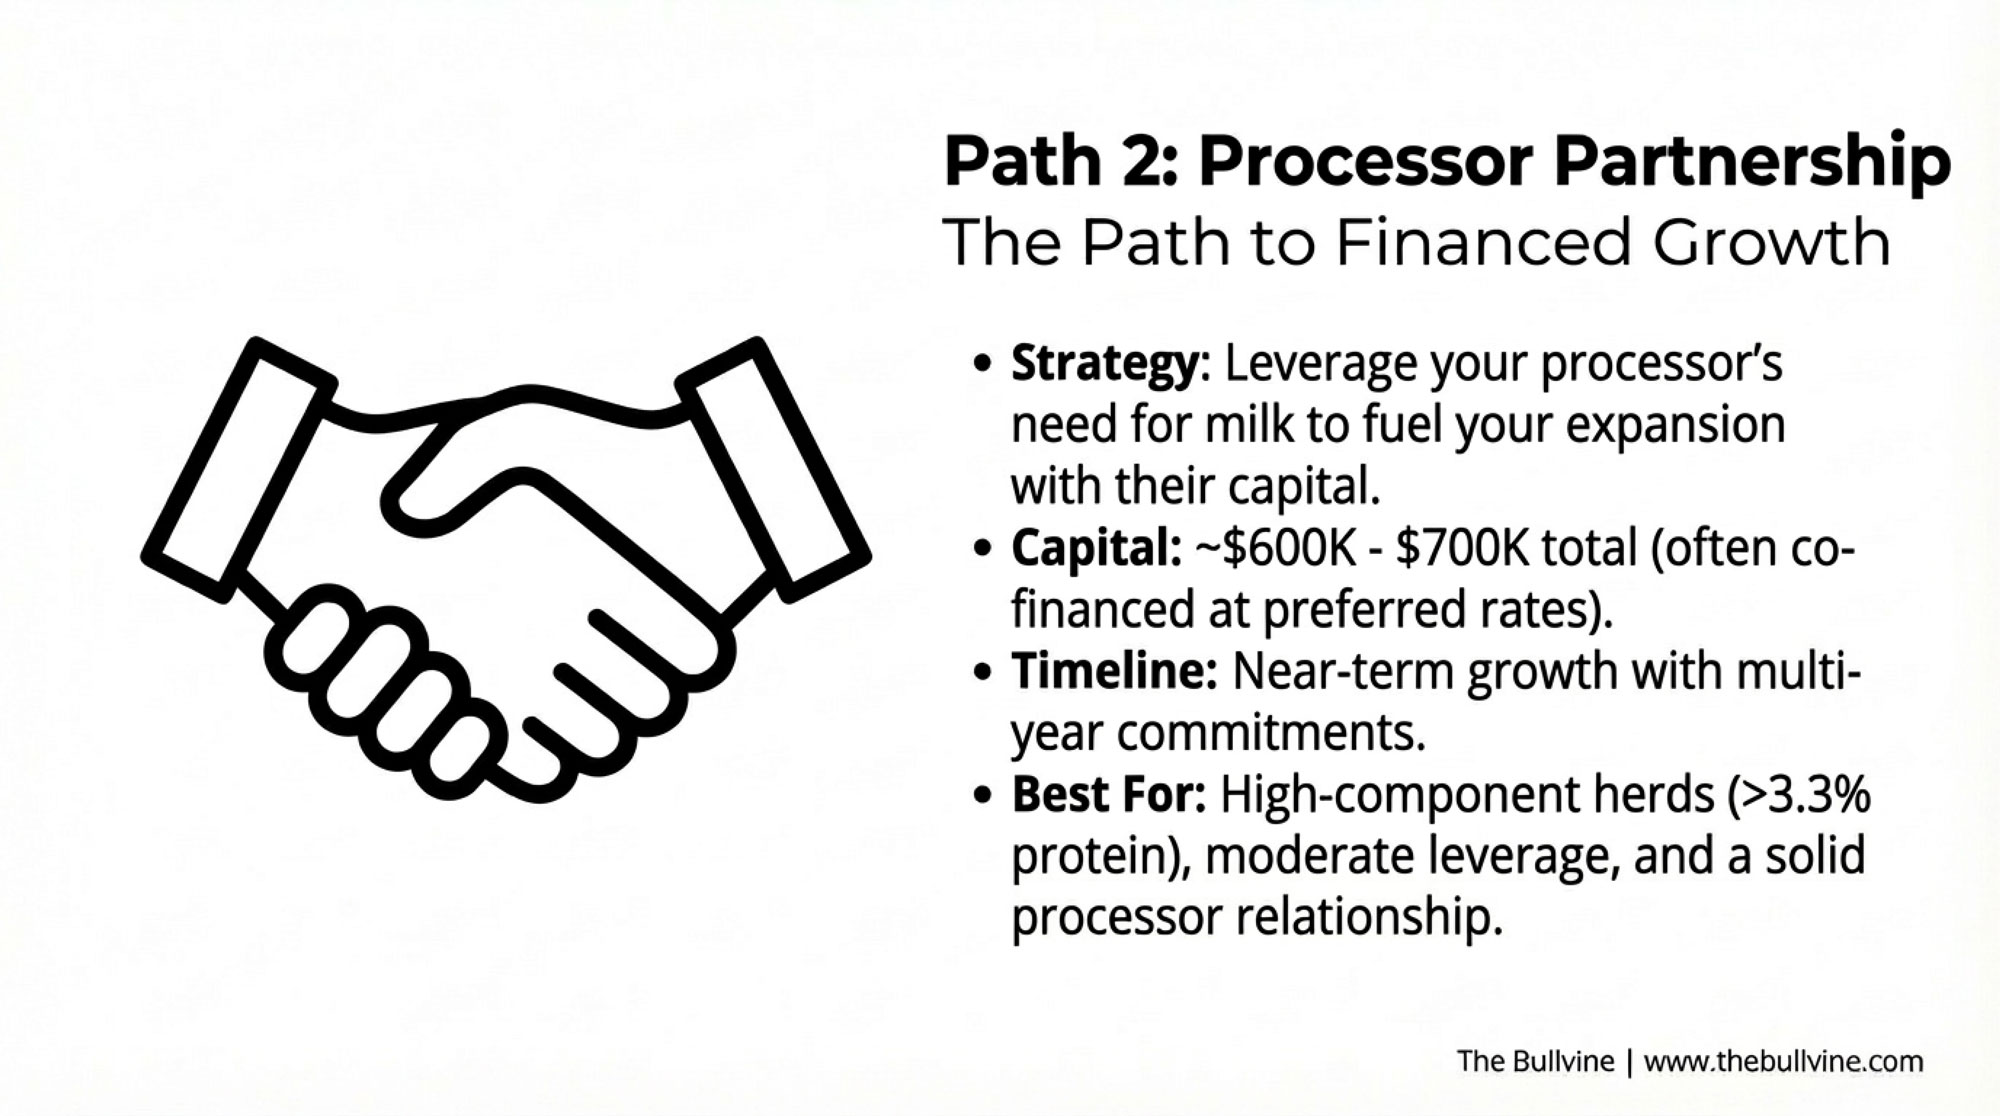
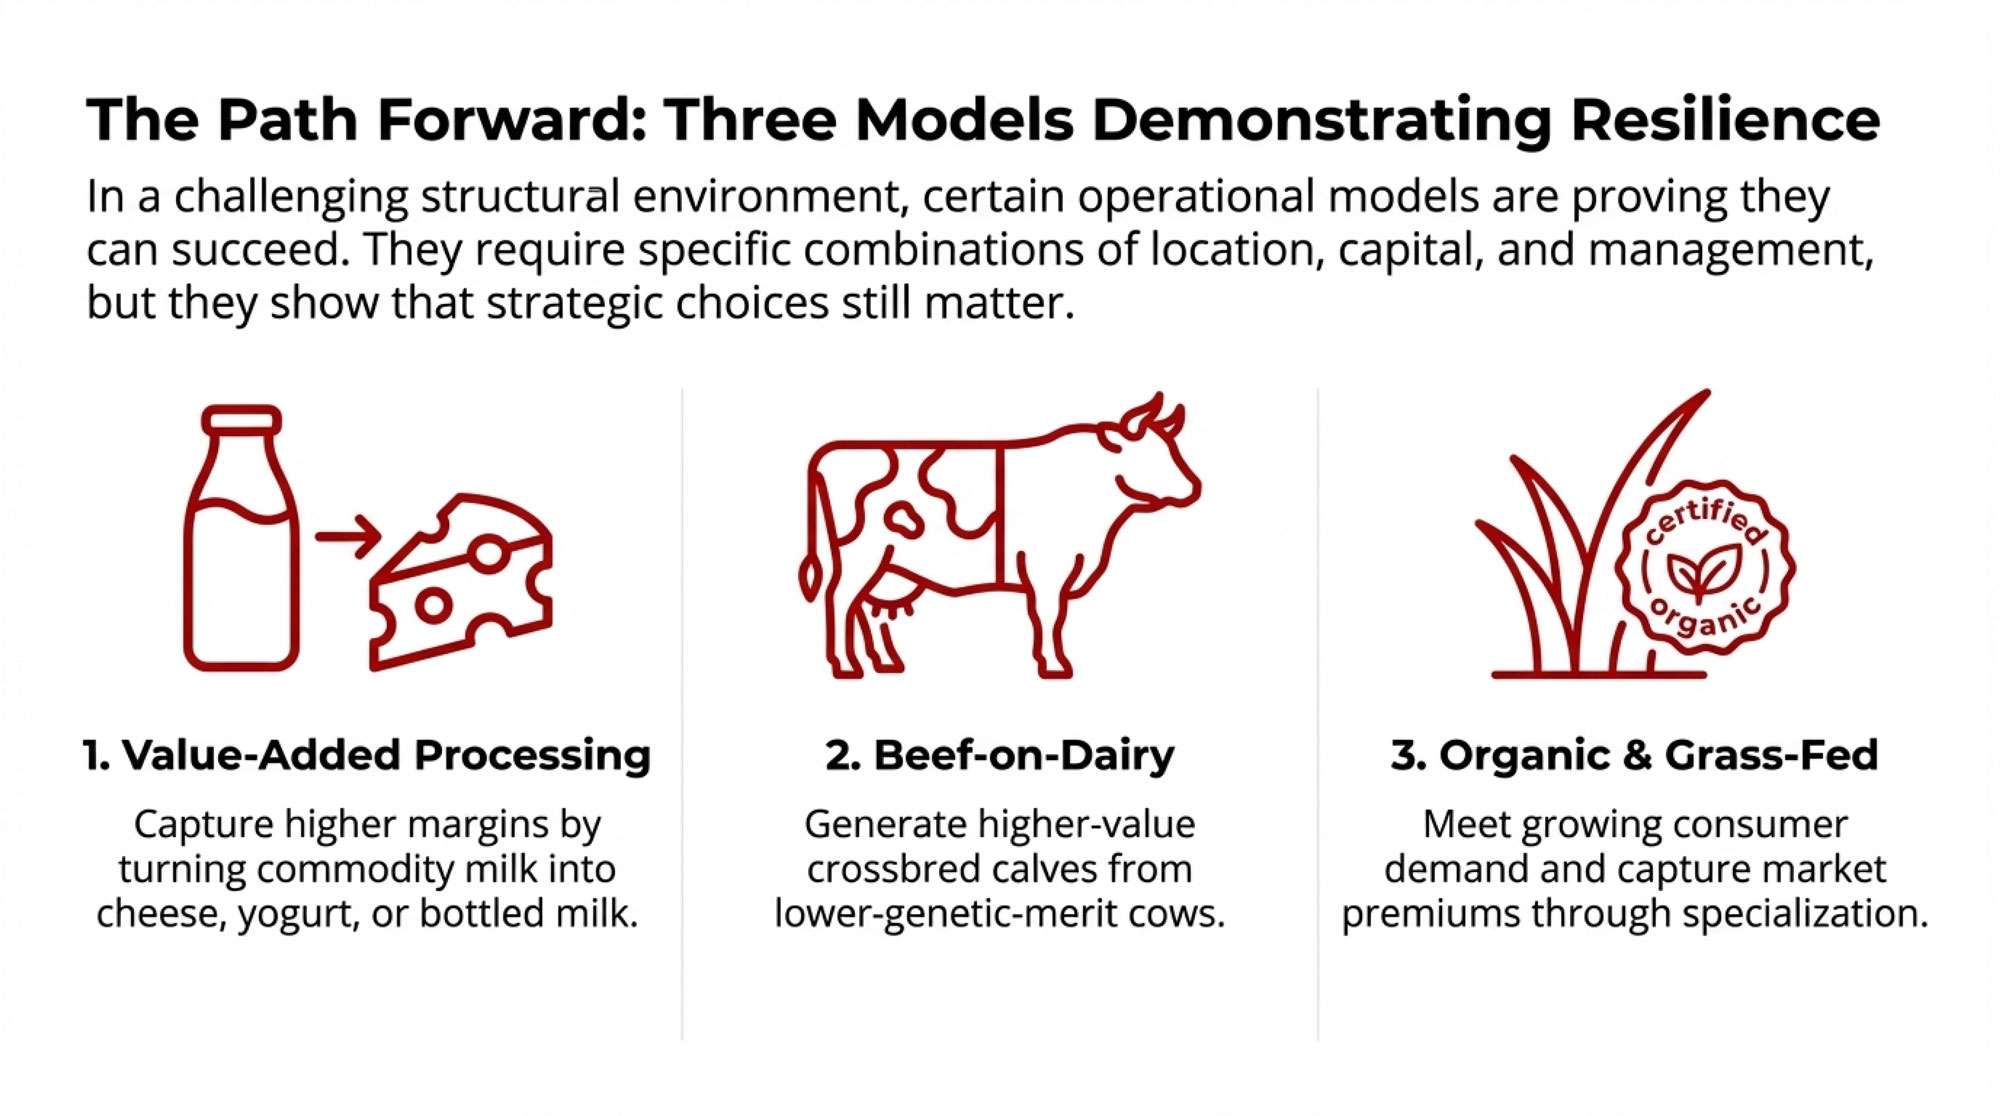
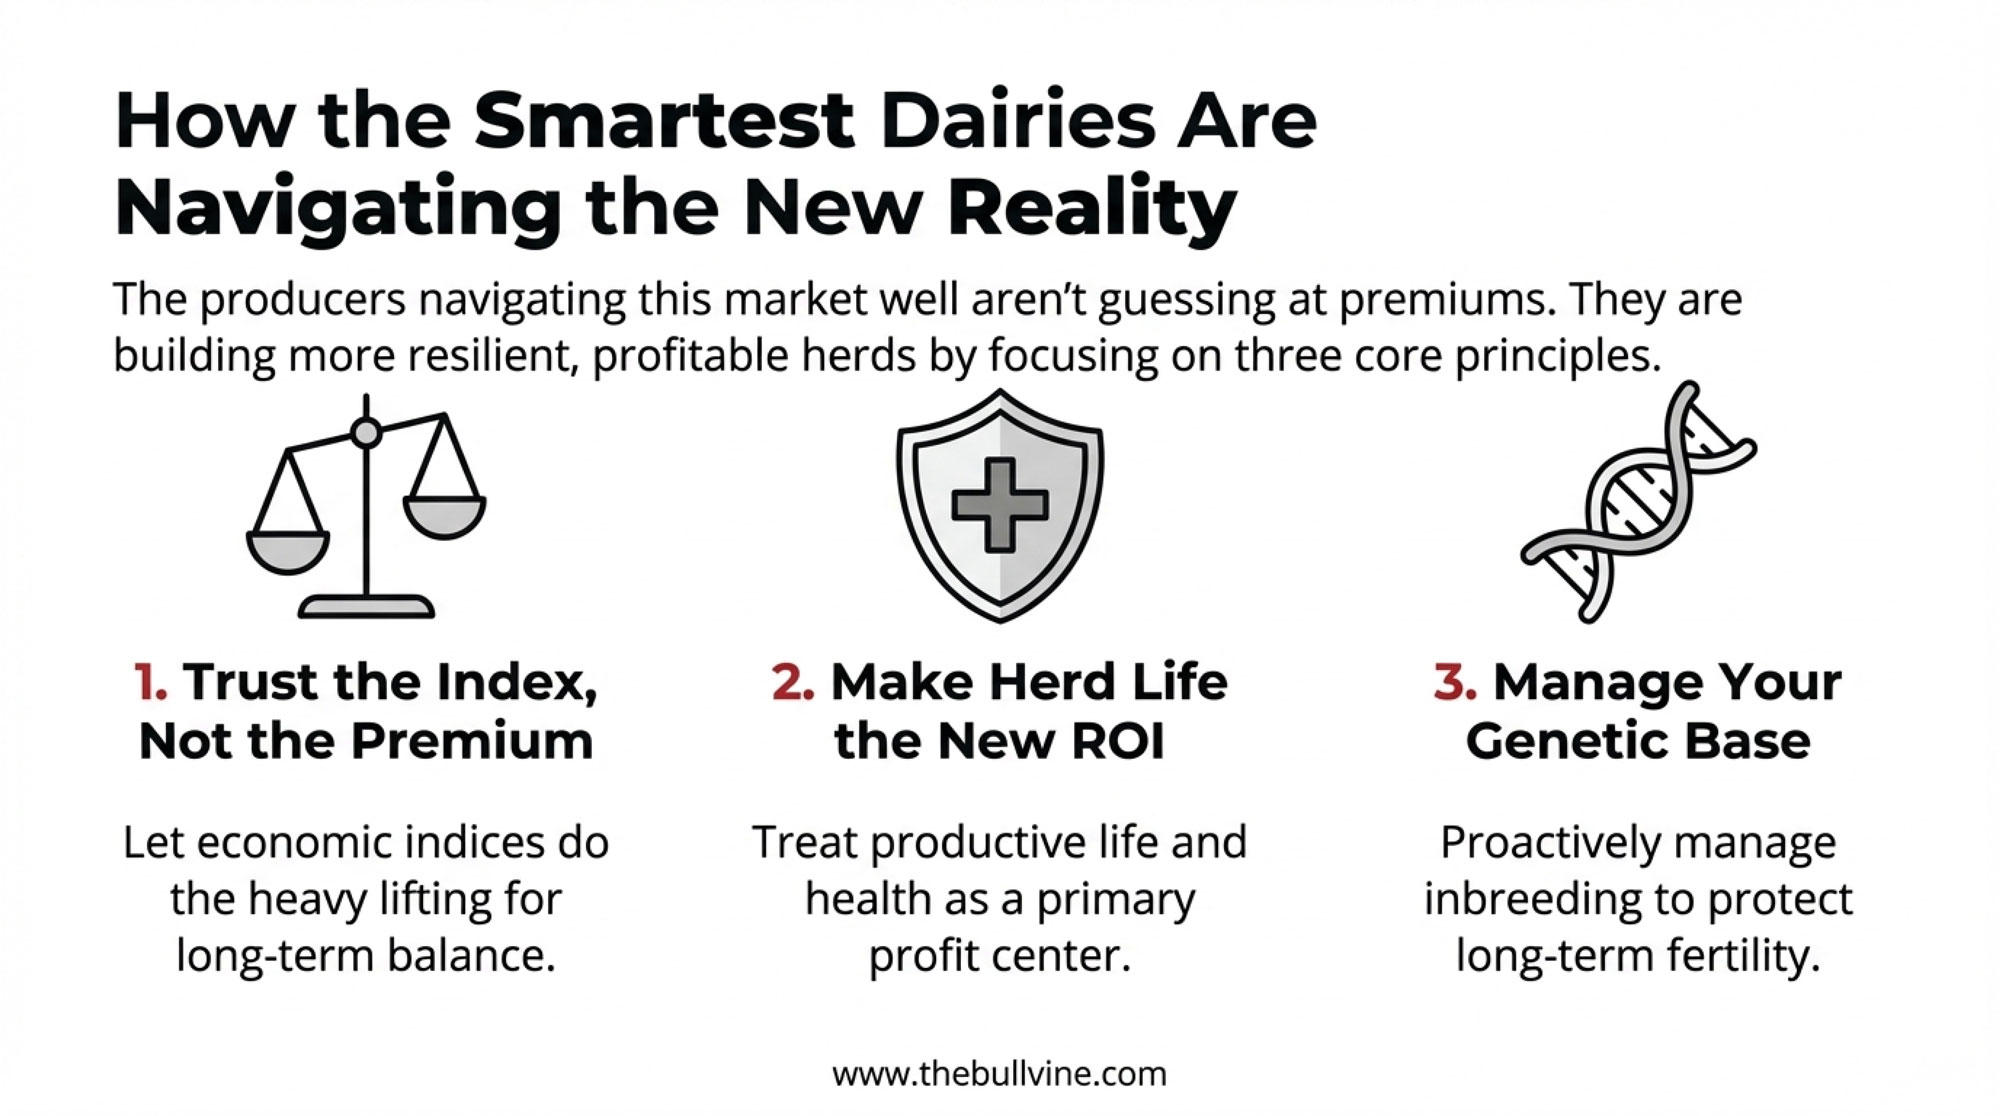
Given these market dynamics, what can mid-size operations actually do? After conversations with farm management specialists, agricultural economists, and producers across several regions, three strategic directions keep emerging.
| Strategy | Capital Required | Time to ROI | Potential Annual Gain (500-600 cow herd) | Risk Level |
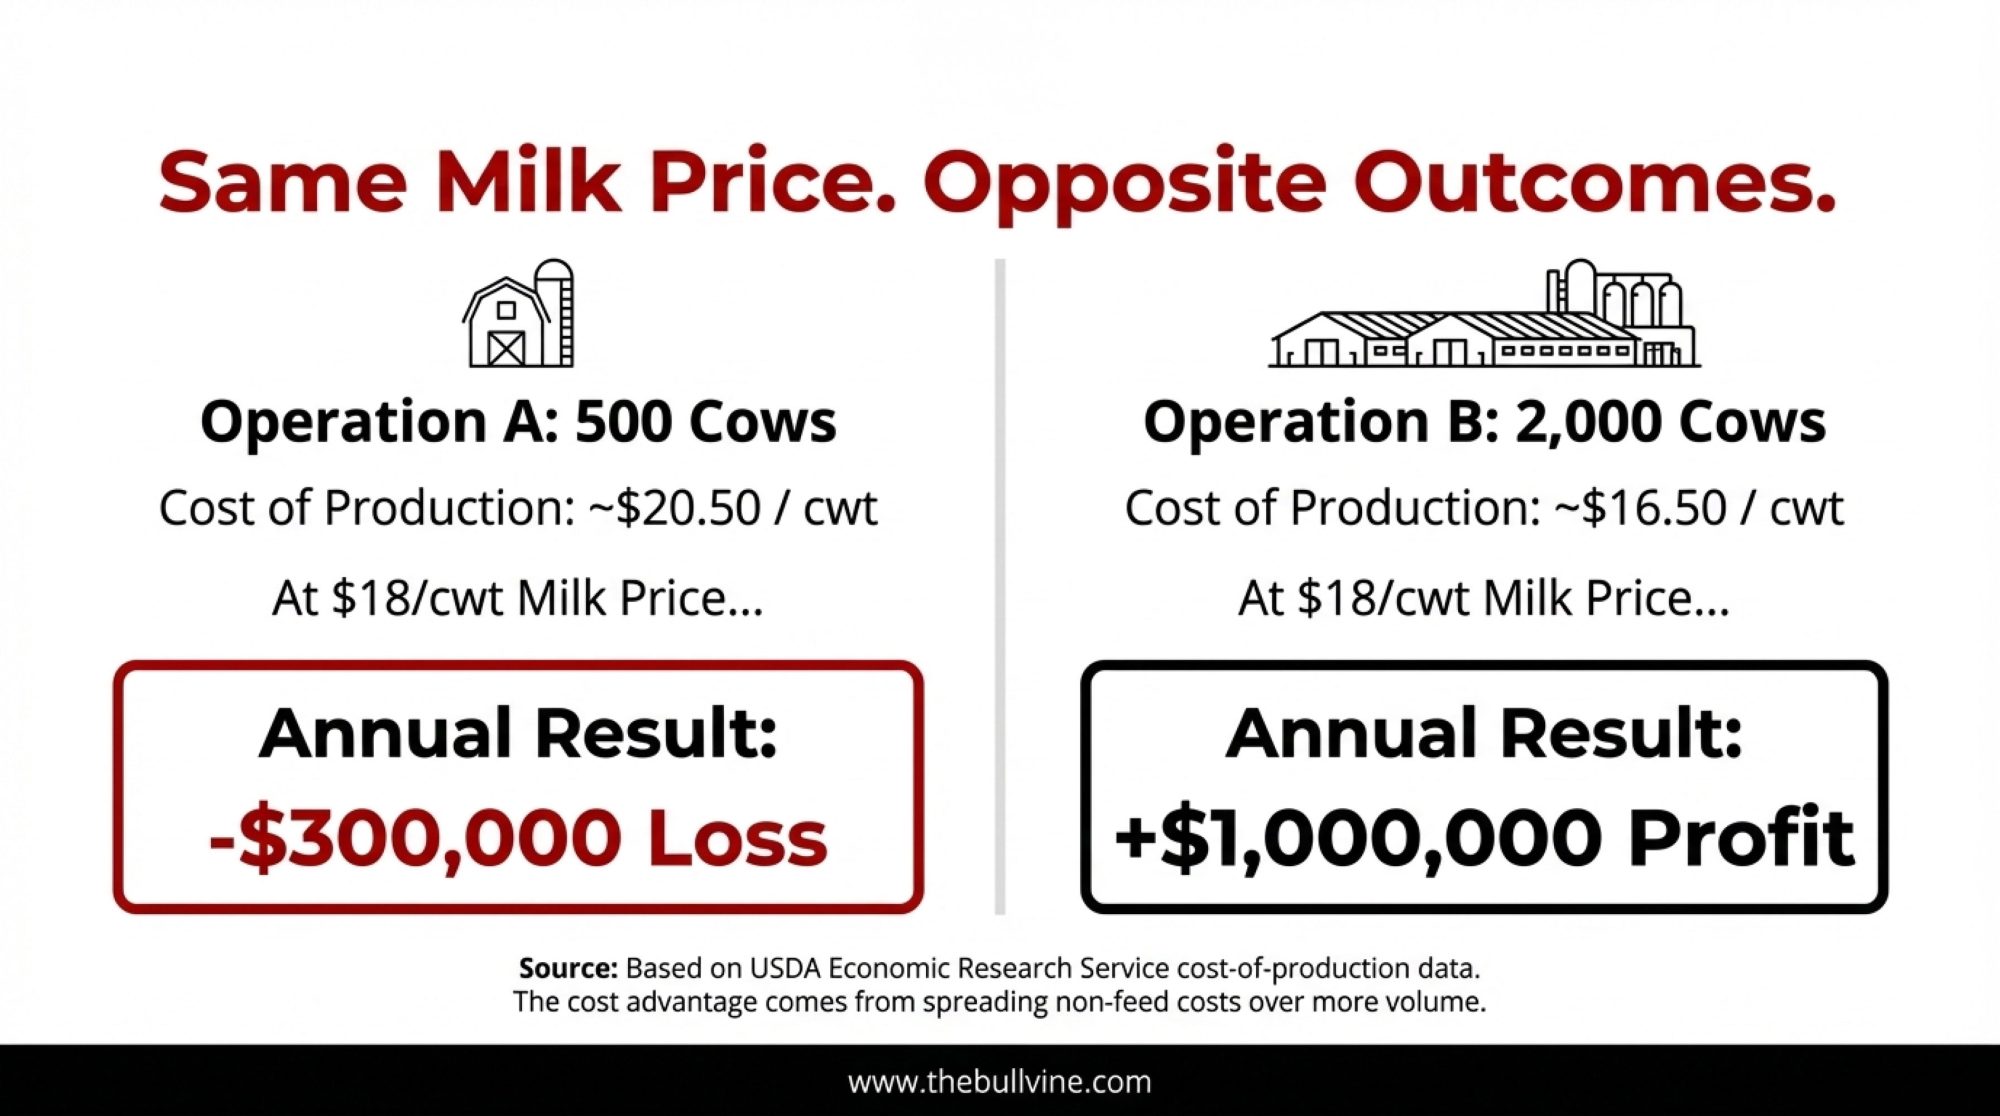
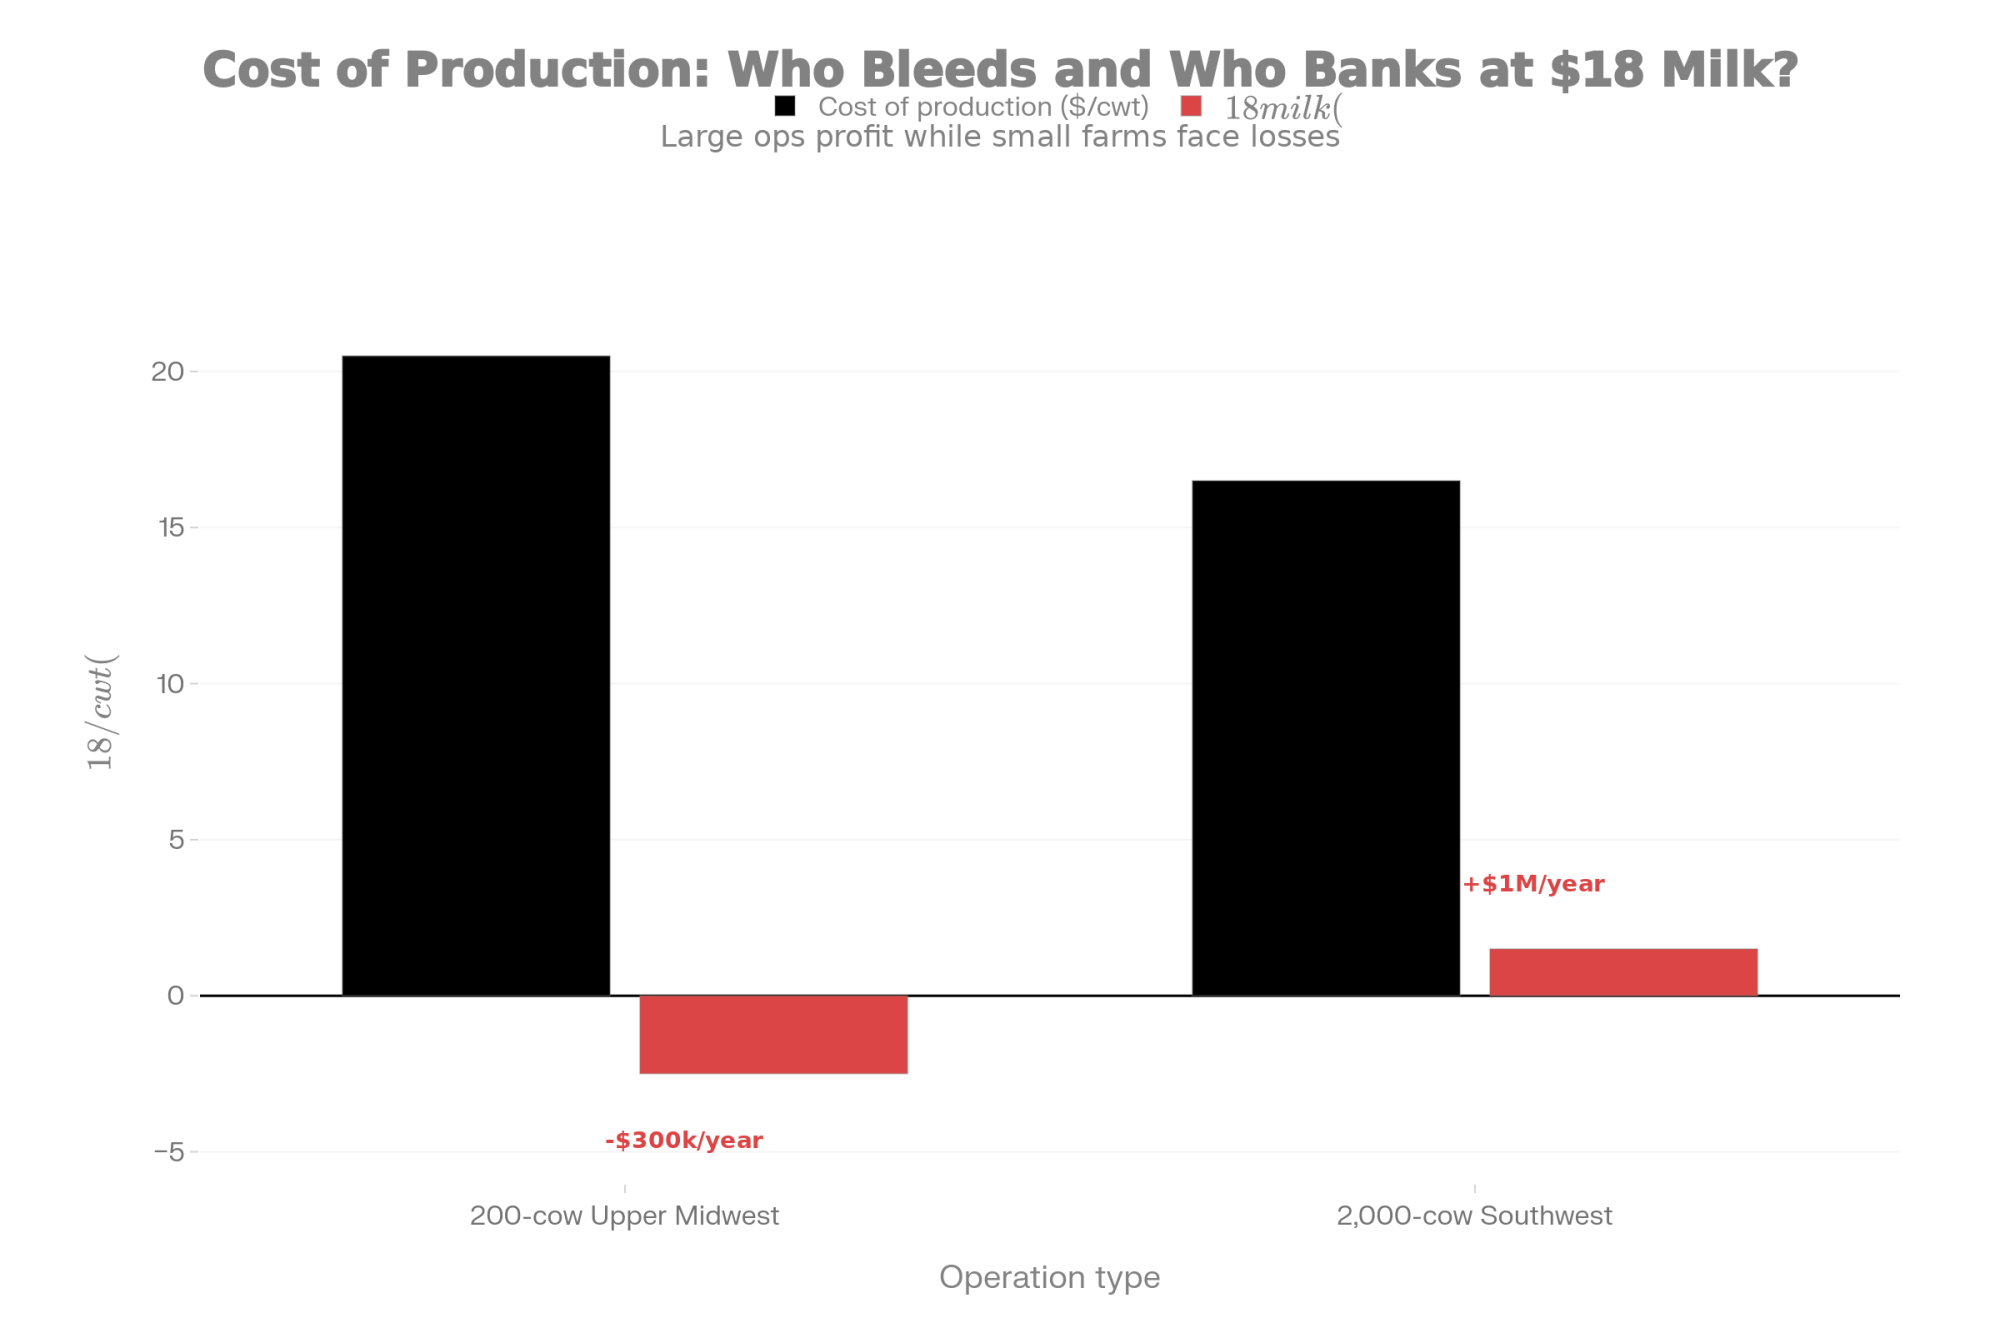
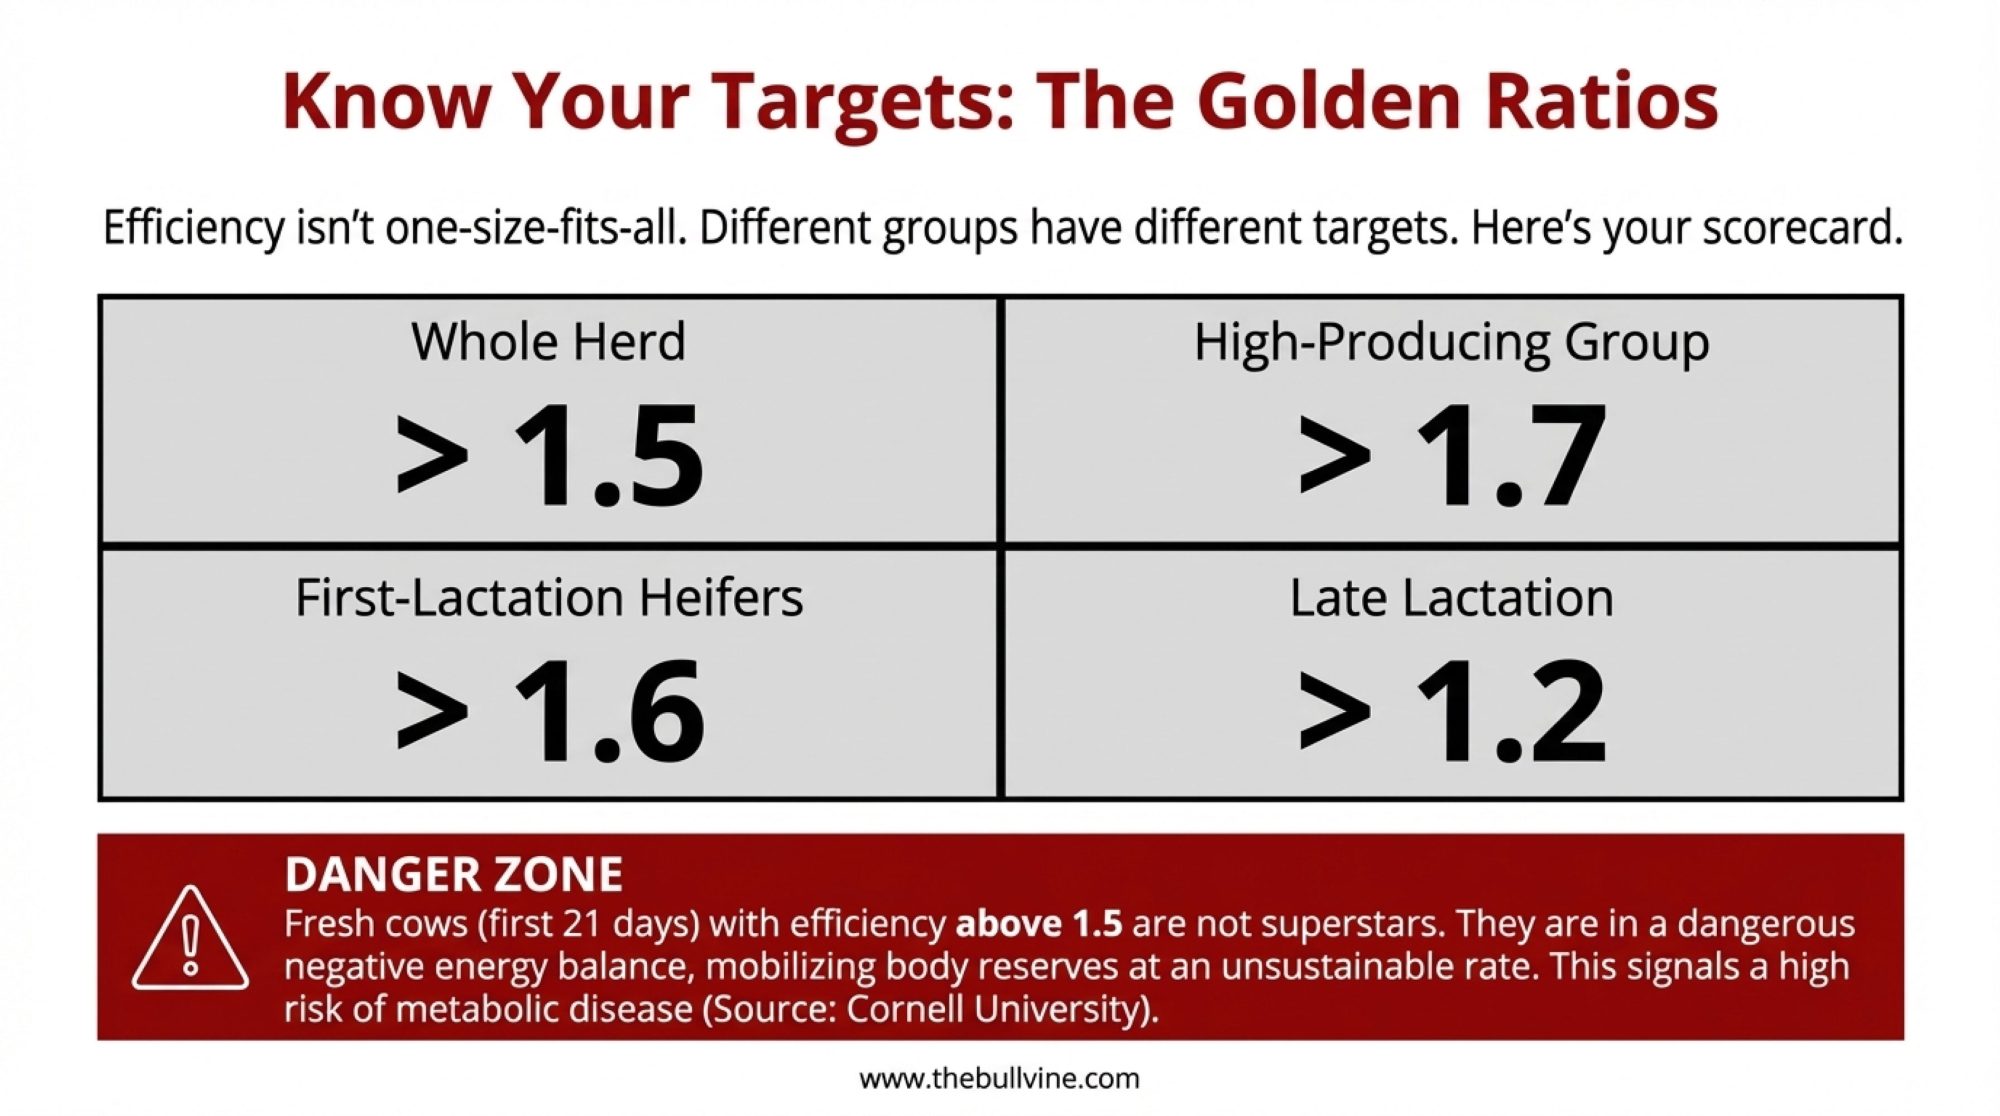
| Efficiency Optimization | $50K-250K (monitoring systems, feed tech, genetics) | 7-12 months | $350K-550K annually (gap between average and top-quartile execution) | Low-Medium |
| Scale Expansion | $8M-12M per 1,000 cows (40% equity required: $3.2M-4.8M) | 5-7 years | Scale-dependent; driven by per-cow efficiency at 2,000+ head | High (labor, capital, market access) |
| Premium Positioning (Organic/Farmstead) | $50K-150K + 36-month transition without premium income | 3-5 years | $100K-300K annually (based on $20-30/cwt premium capture) | Medium-High (market, transition, certification) |
Which path makes sense depends partly on where you are in the business cycle—and honestly, on generational considerations. An operation with a clear succession plan and incoming family labor faces different calculations than one where the next generation has moved on. The strategic choices you make today will shape what kind of operation exists in ten or fifteen years, whether that’s for family members to continue or for an eventual transition. That reality should inform which path you pursue.
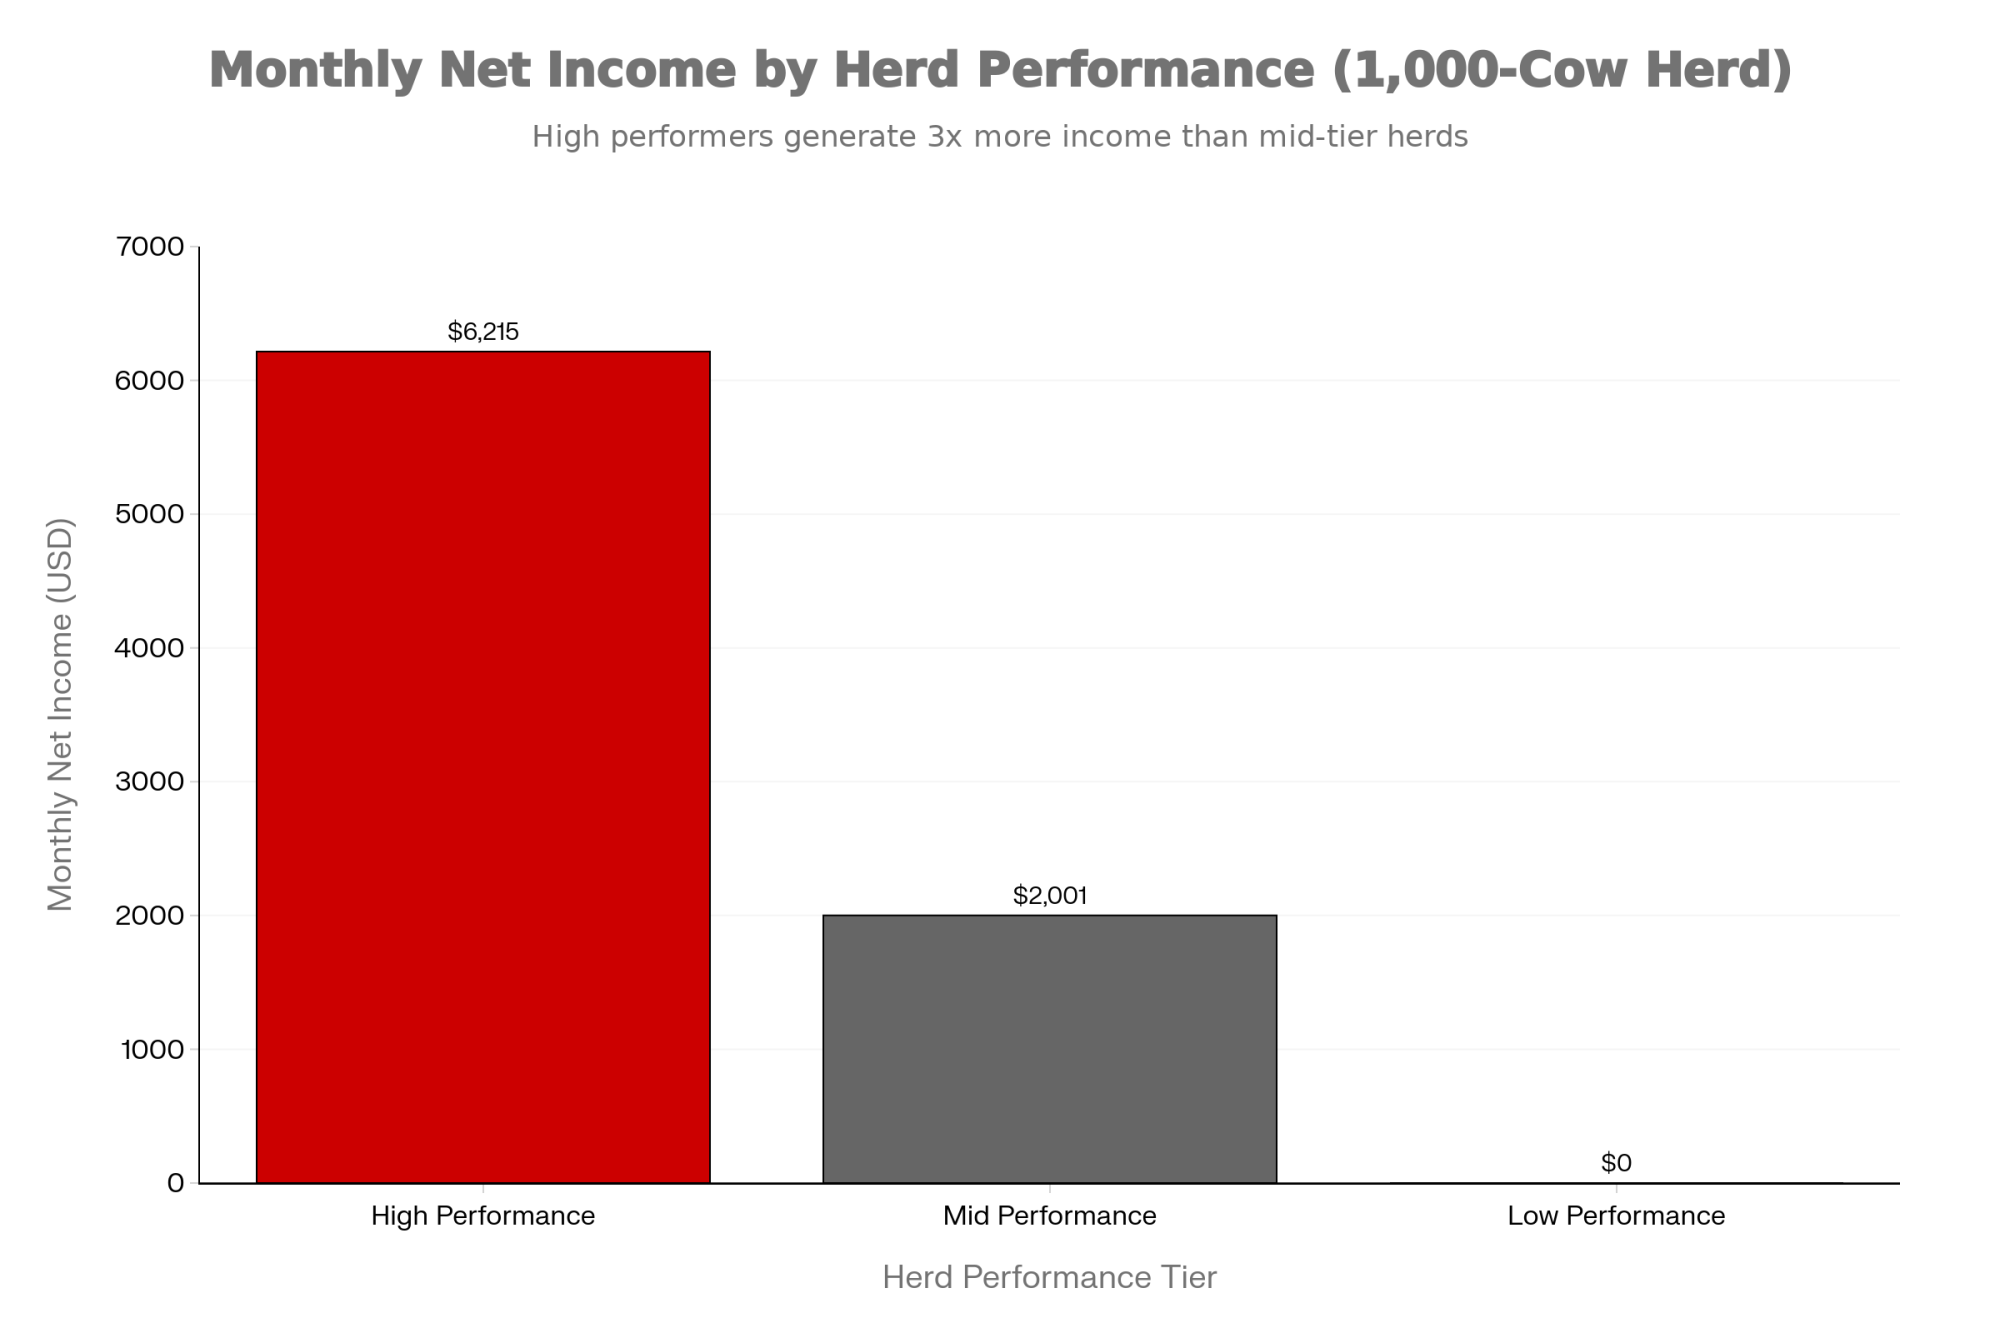
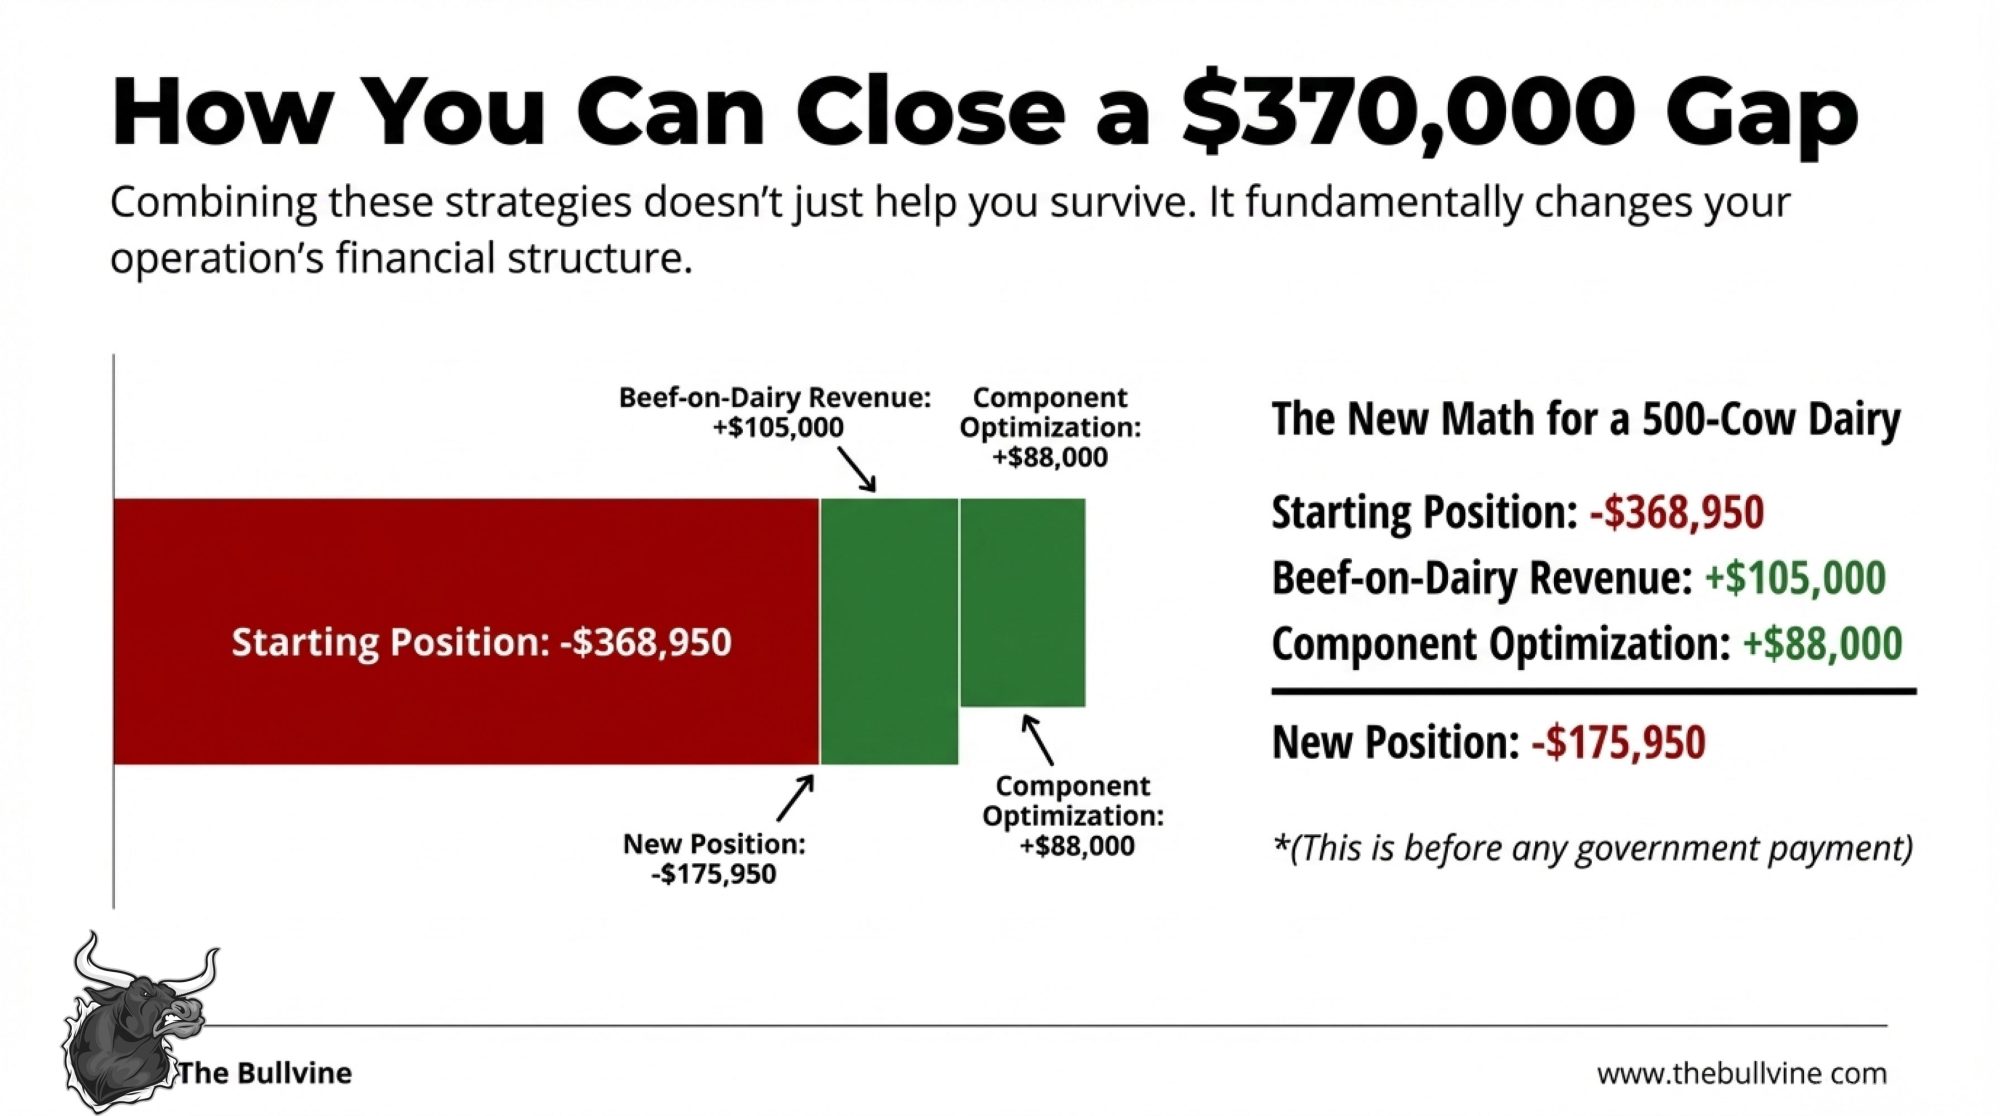
Here’s what the numbers suggest: on a well-managed 500-cow dairy, the gap between average and top-quartile execution across efficiency measures could mean $350,000-550,000 annually. That’s the difference between surviving commodity cycles and building genuine equity. The three paths below represent different ways to capture that value.

Path One: Efficiency Optimization
For many operations, the most practical path is executing the fundamentals exceptionally well. And the performance gap between average and top-performing herds of similar size can be more meaningful than you might expect—Penn State Extension dairy specialists have documented income-over-feed-cost differences of $2.00-3.00 per cow per day between operations with similar herd sizes.
On a 600-cow dairy, that daily difference compounds to something significant over a year.
Where does that improvement come from? A few areas consistently matter:
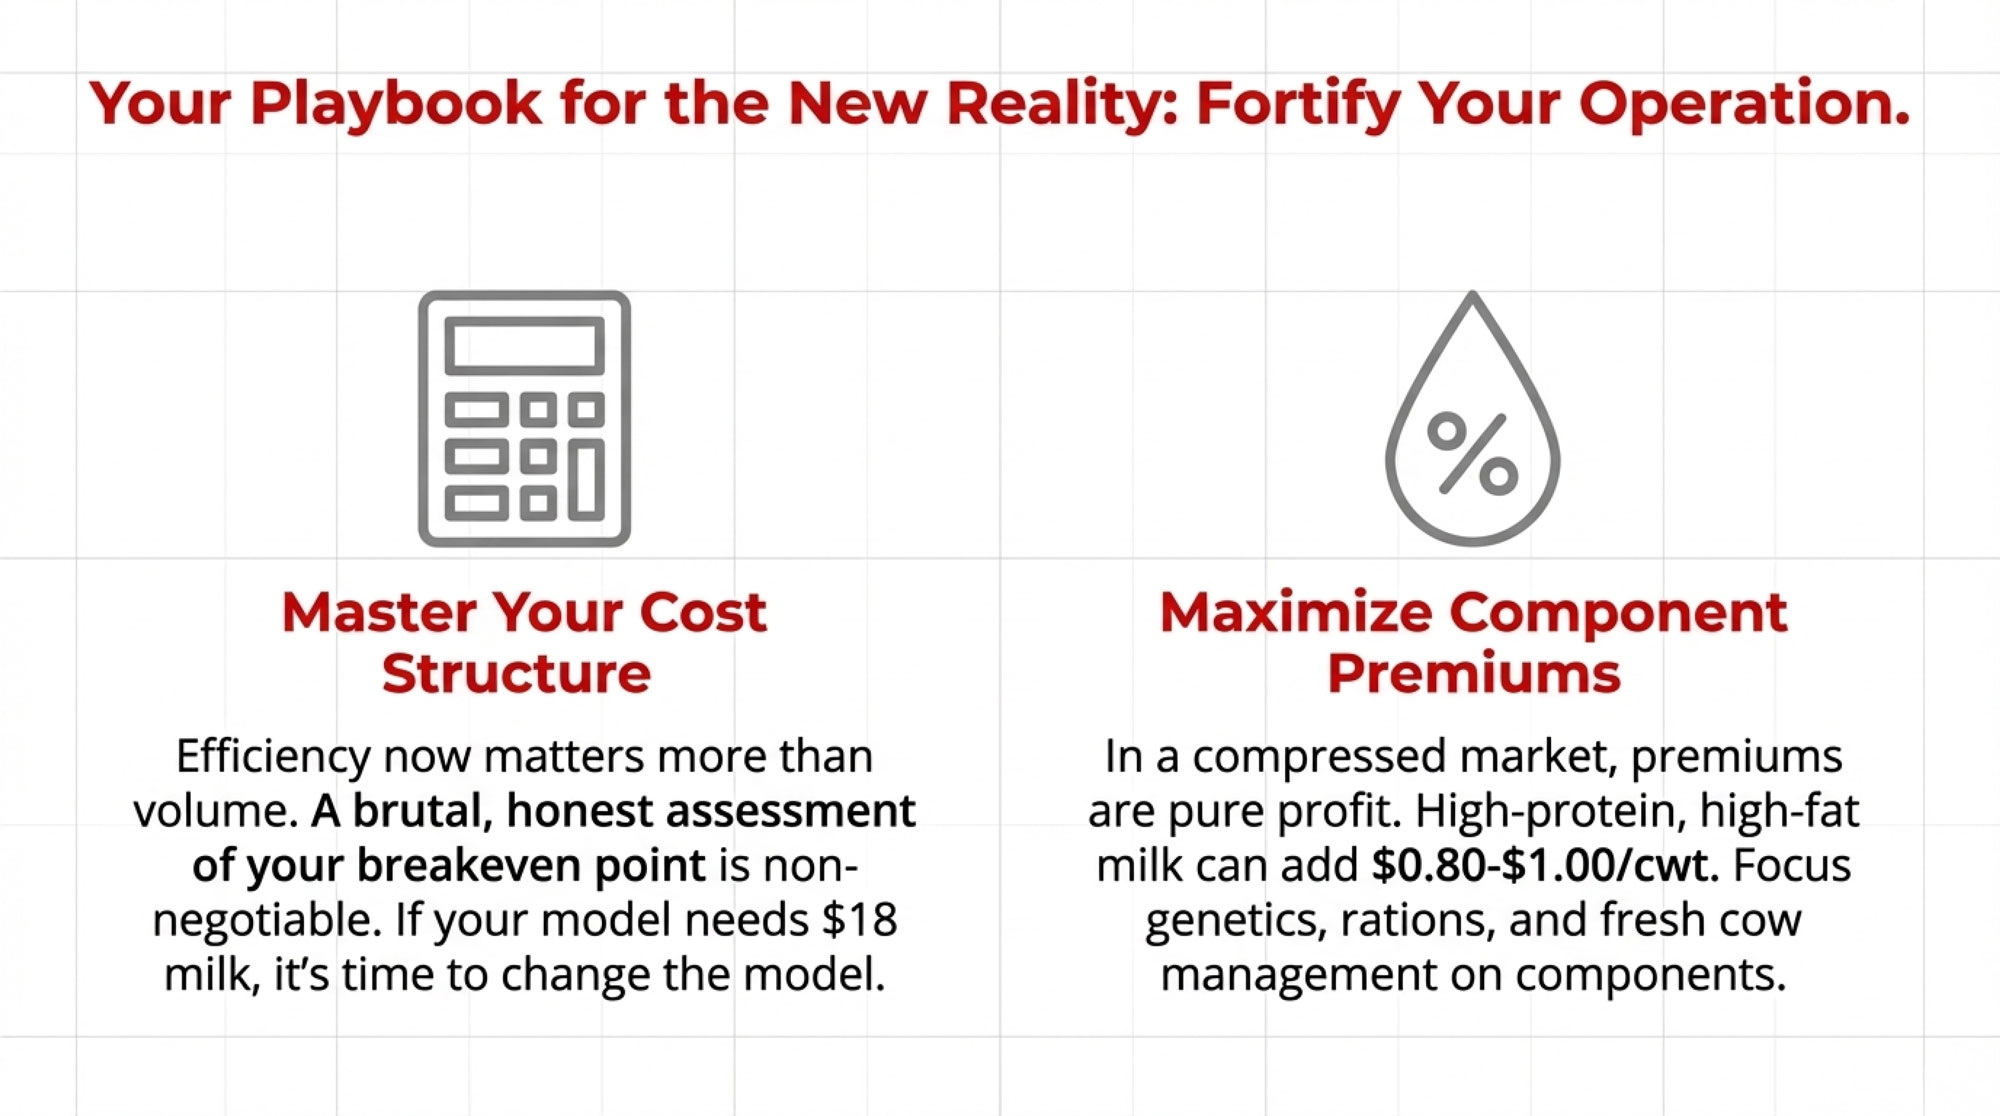
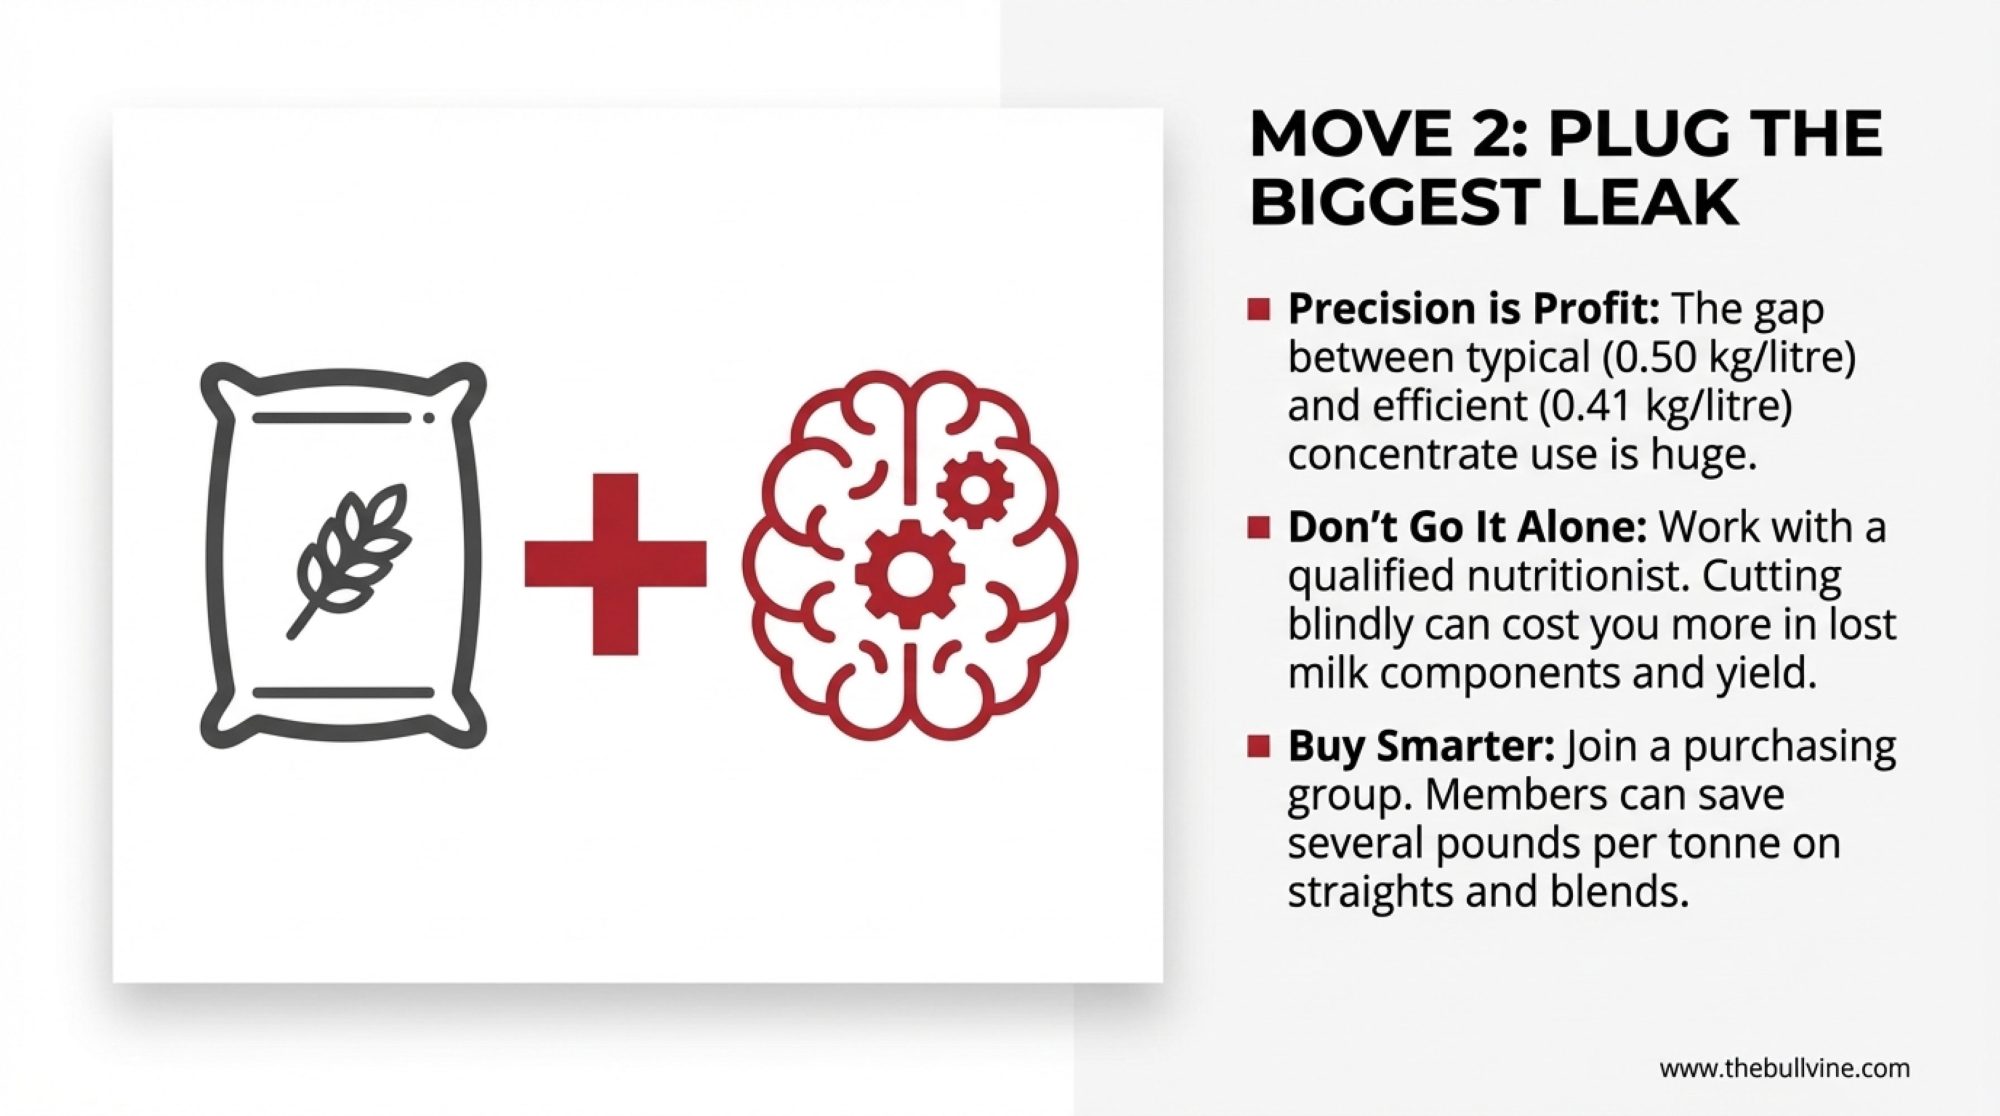
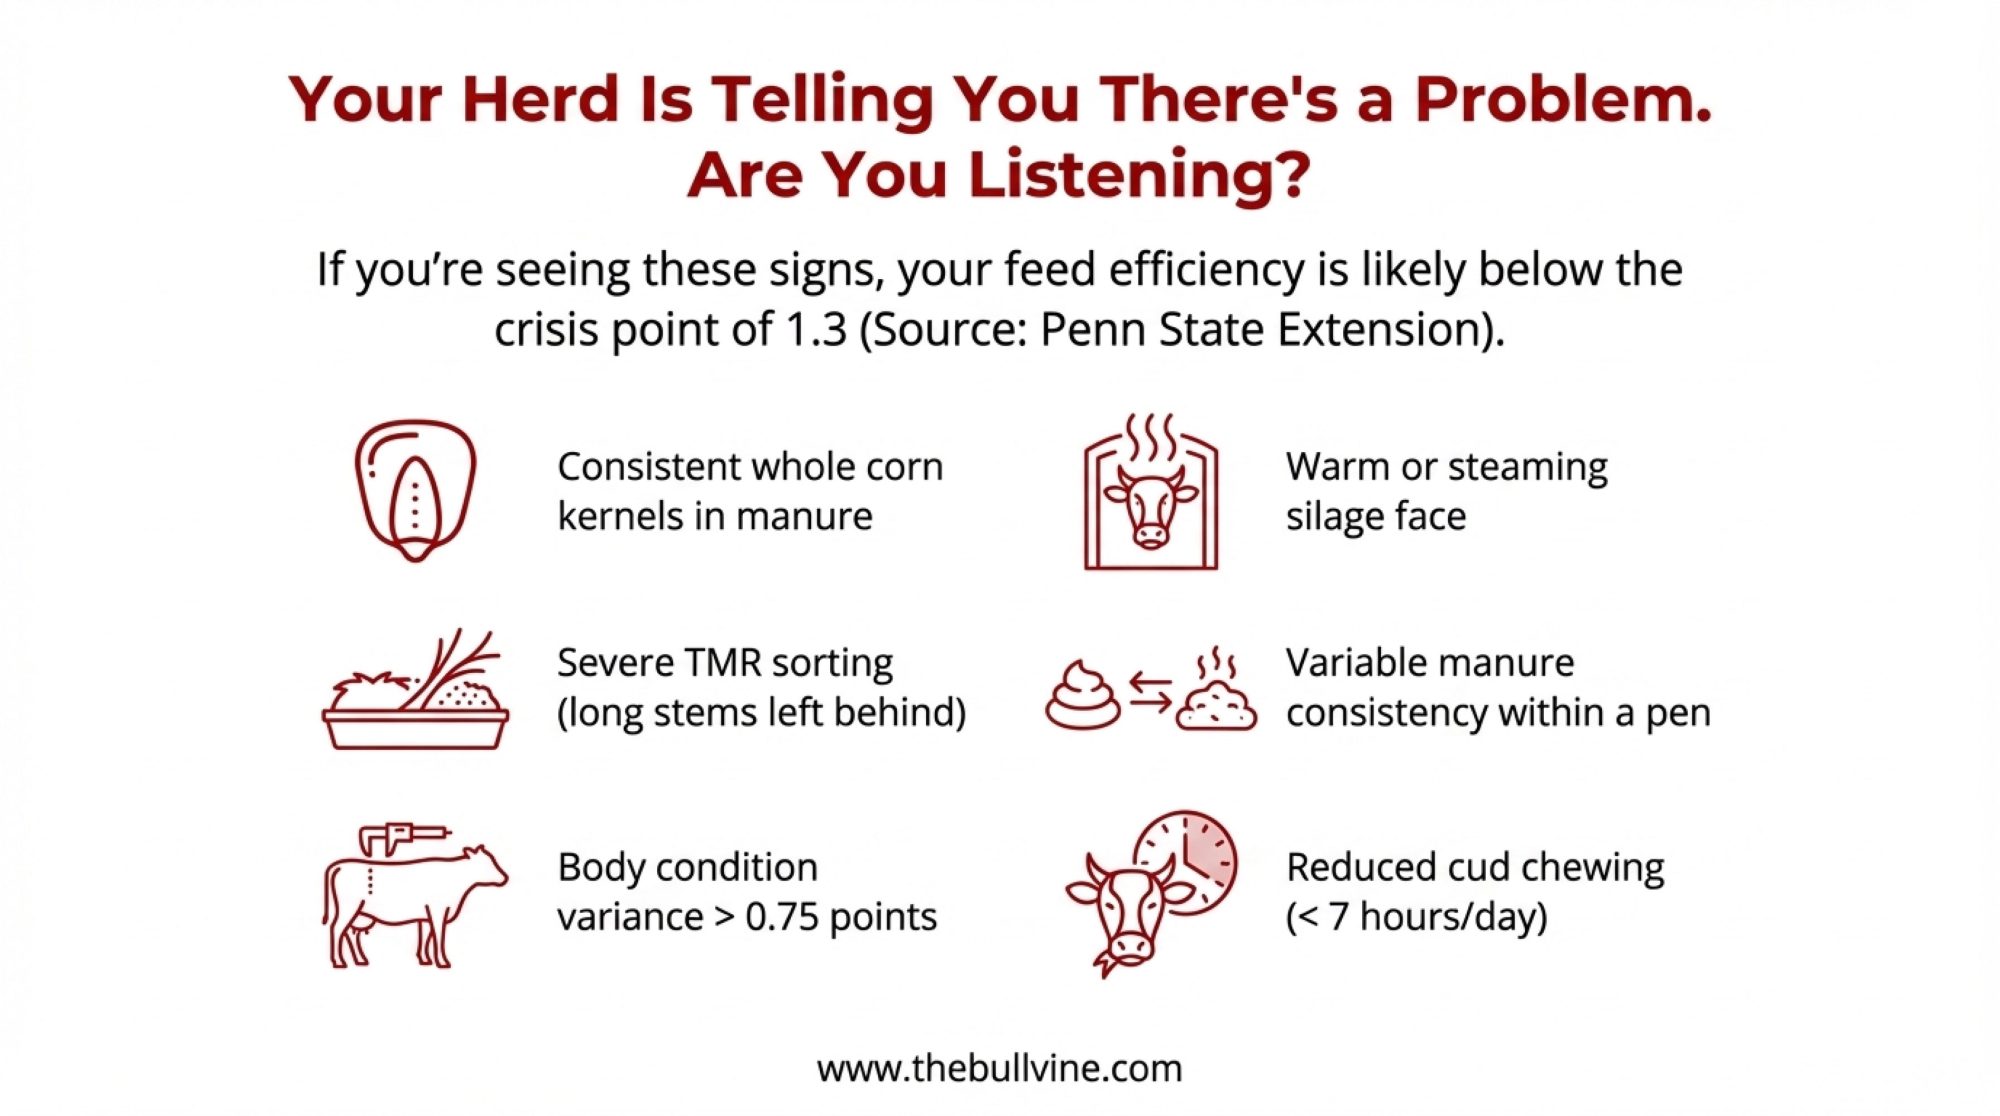
Feed management remains the largest controllable cost. Most operations run TMR consistency at 4-8% variation; top performers achieve 2% or less. Testing every cutting—rather than assuming values carry over—adjusting rations weekly based on actual components, and managing bunk dynamics… these practices can reduce feed costs by $0.30-0.50 per hundredweight according to University of Wisconsin research.
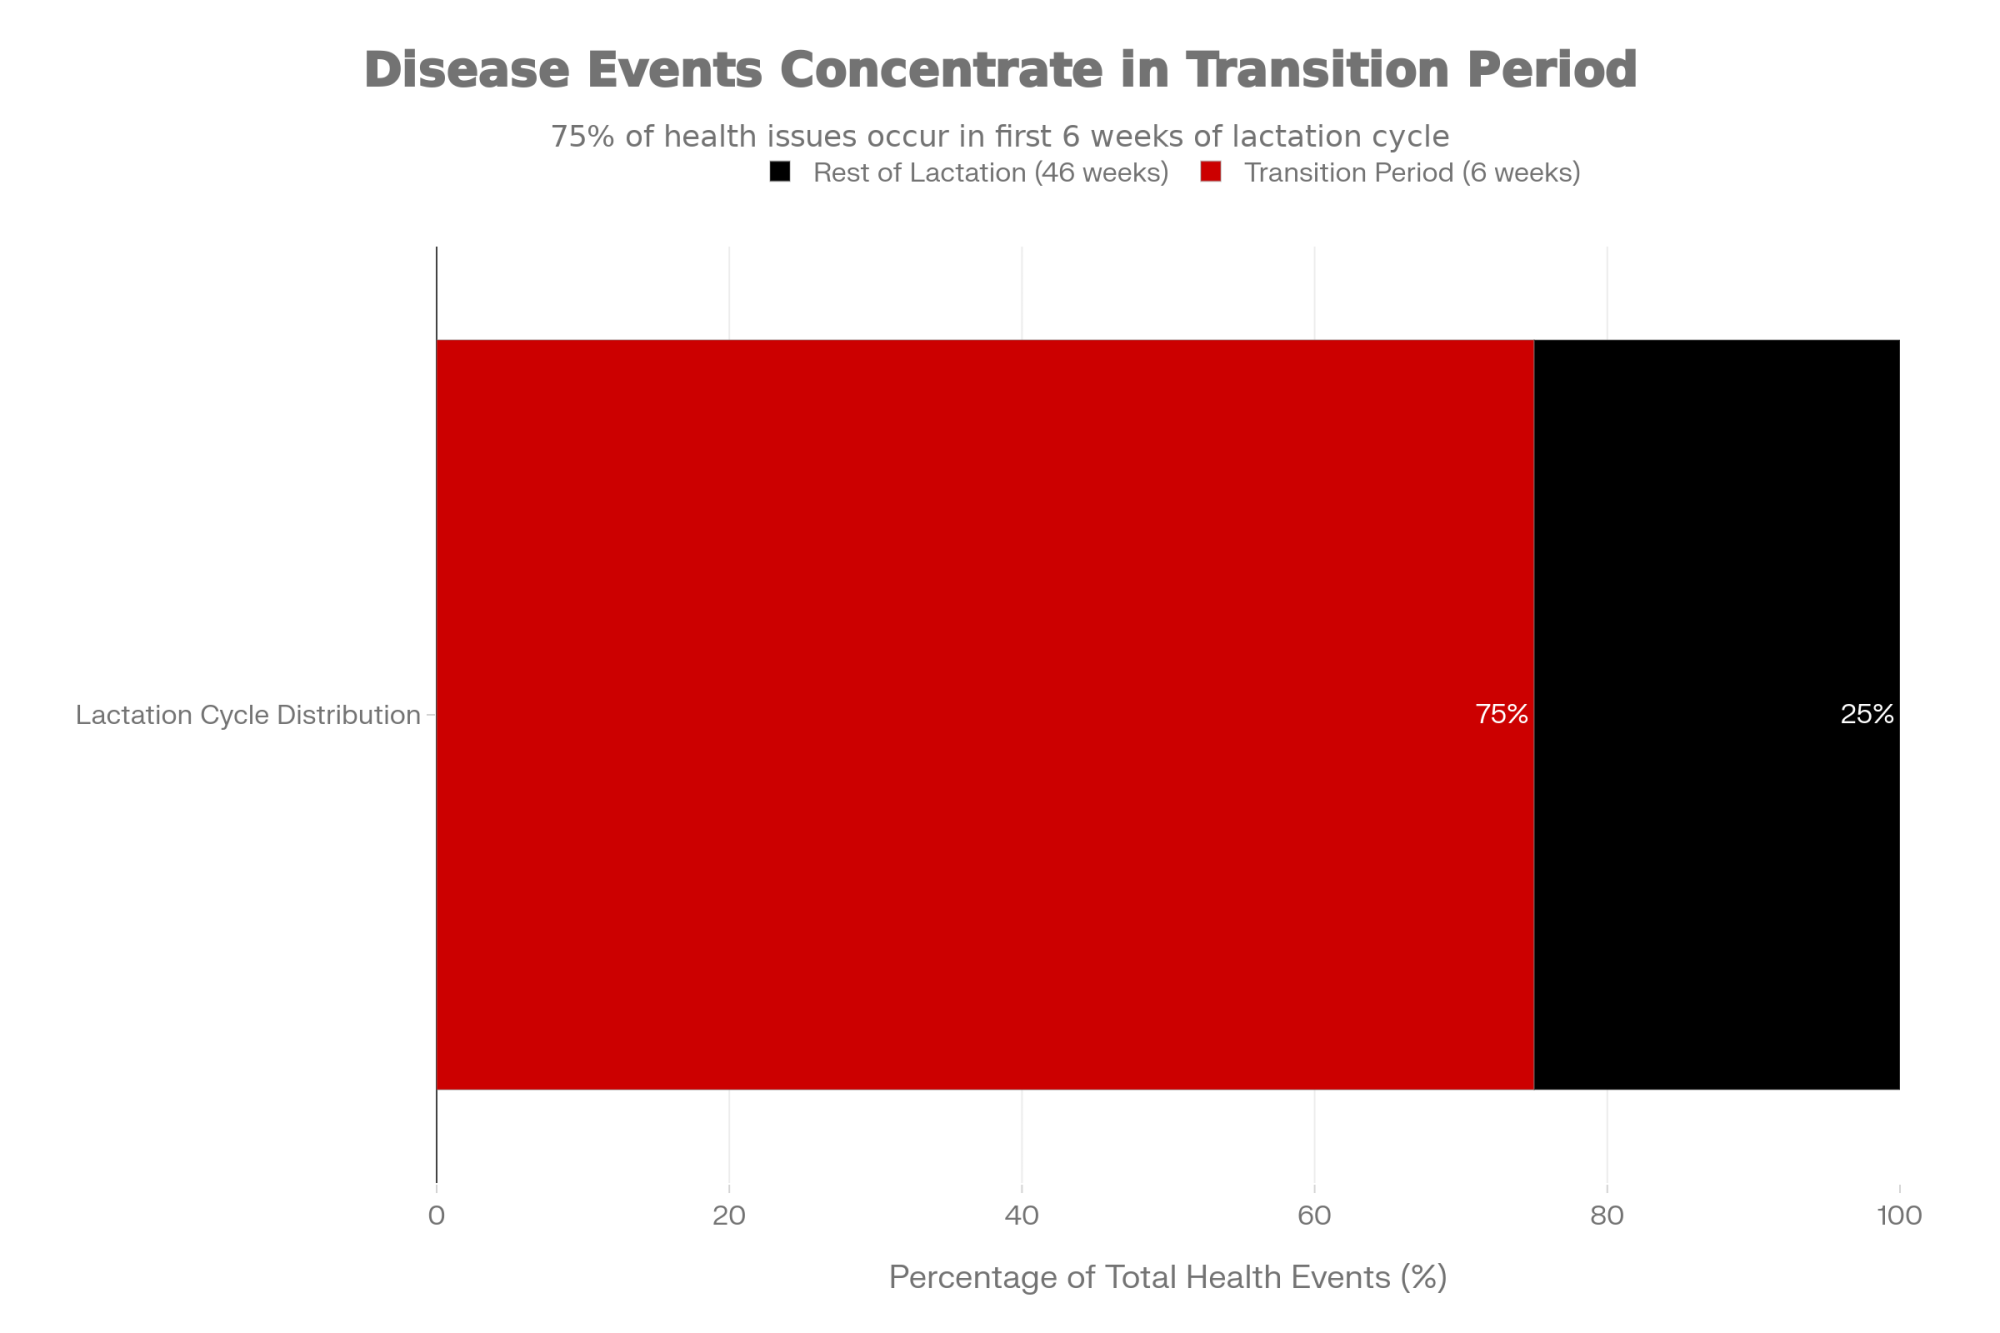
Health monitoring has advanced considerably. Rumination and activity monitoring can identify mastitis and lameness 2-3 days before visual symptoms appear. Systems from SCR, Afimilk, Lely, and others typically run $50-100 per cow for basic monitoring, with more comprehensive systems at $150-250 per cow. The payback comes through earlier intervention, reduced treatment costs, and avoided production losses—particularly during the transition period when fresh cow problems tend to cascade.
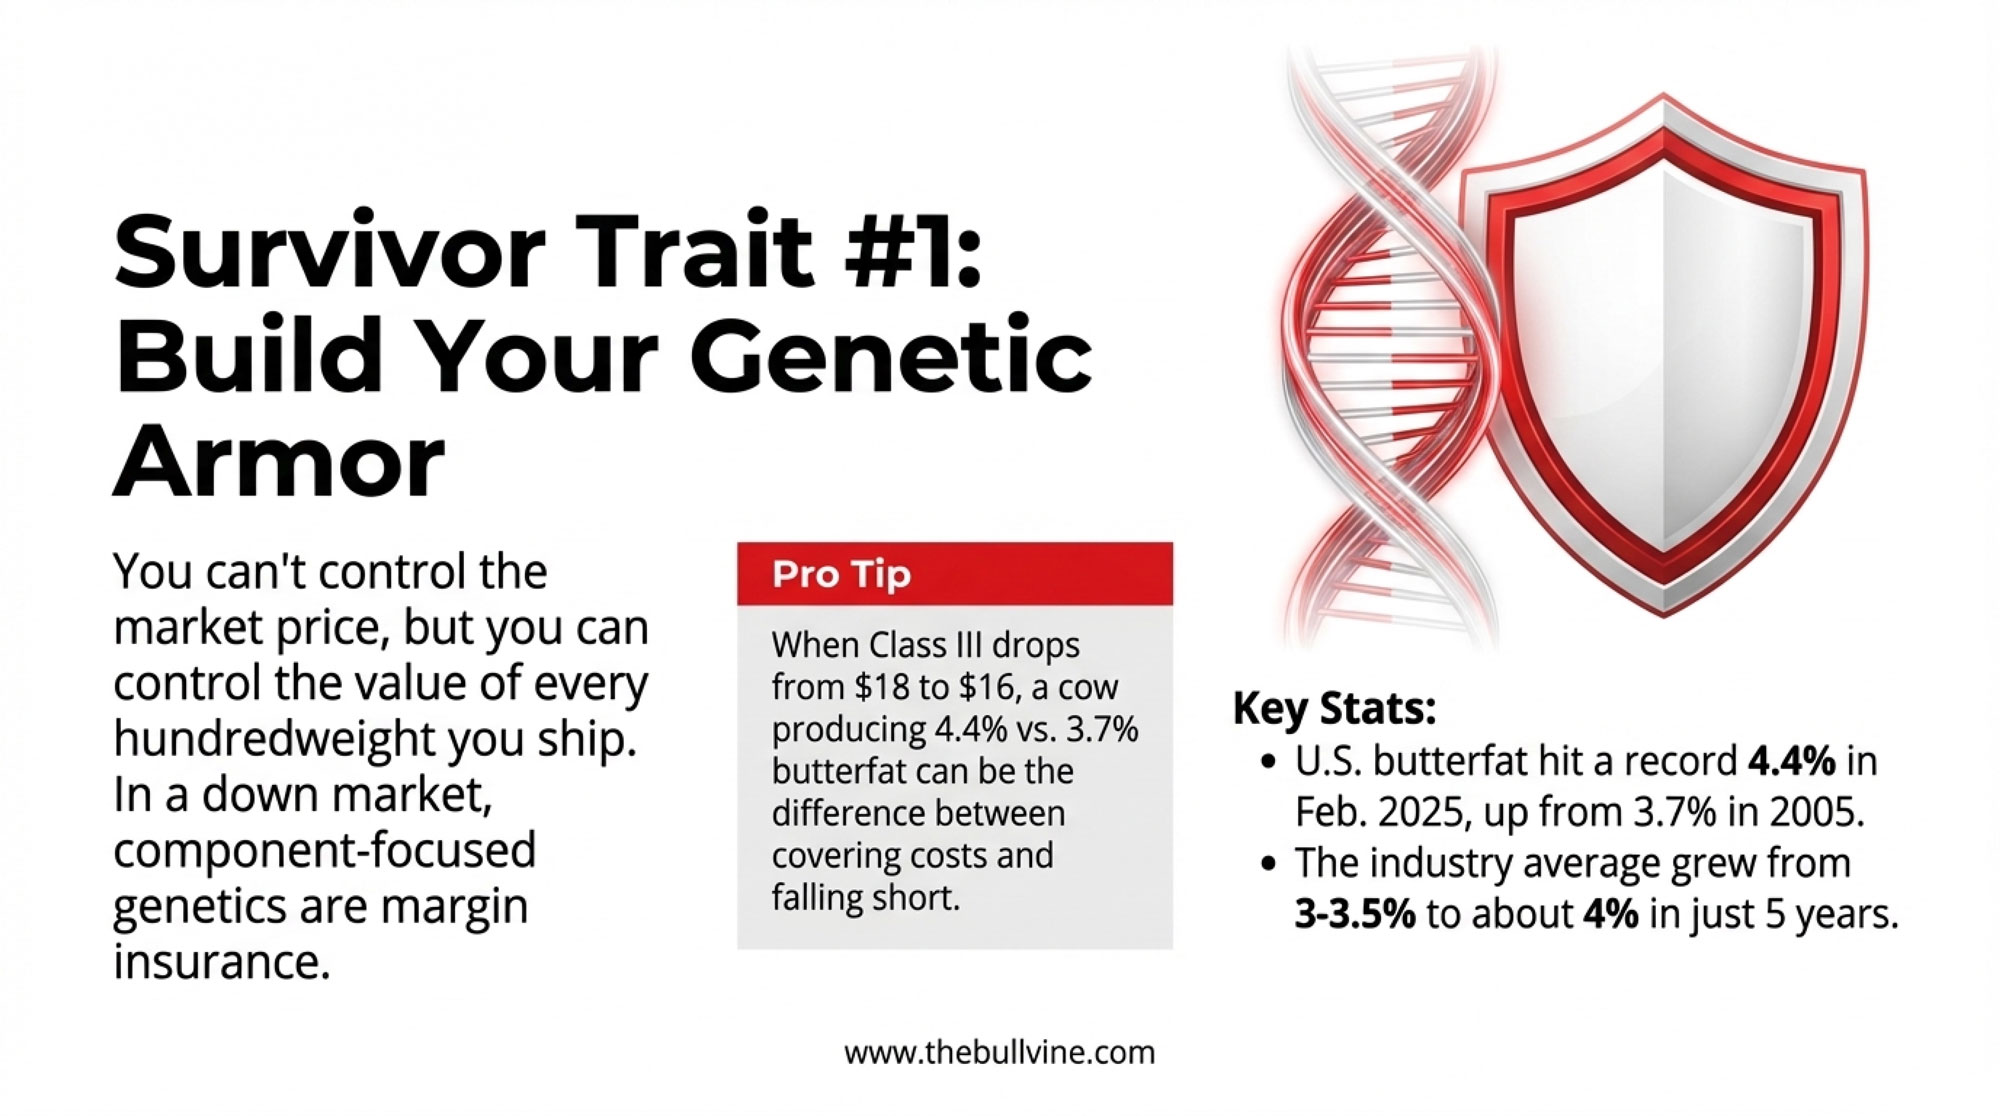
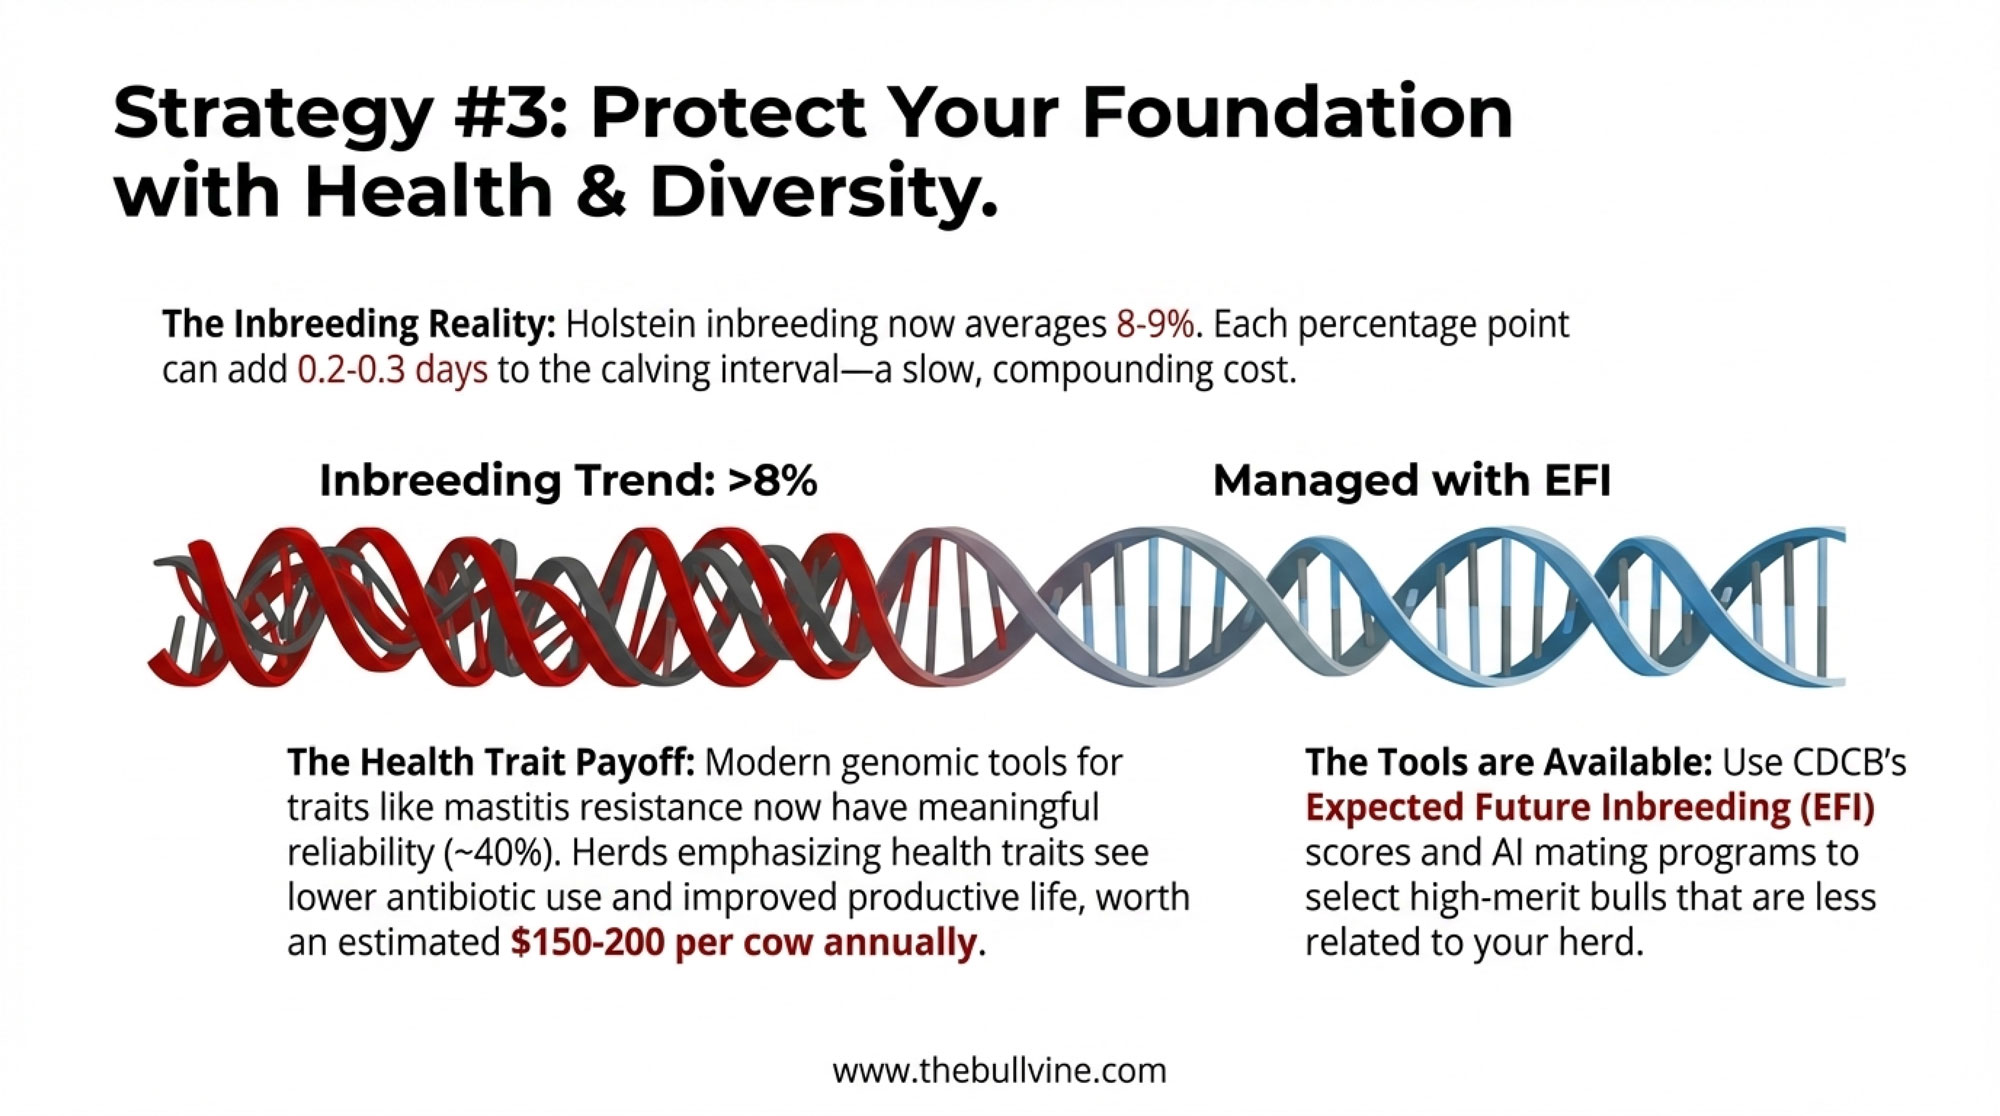
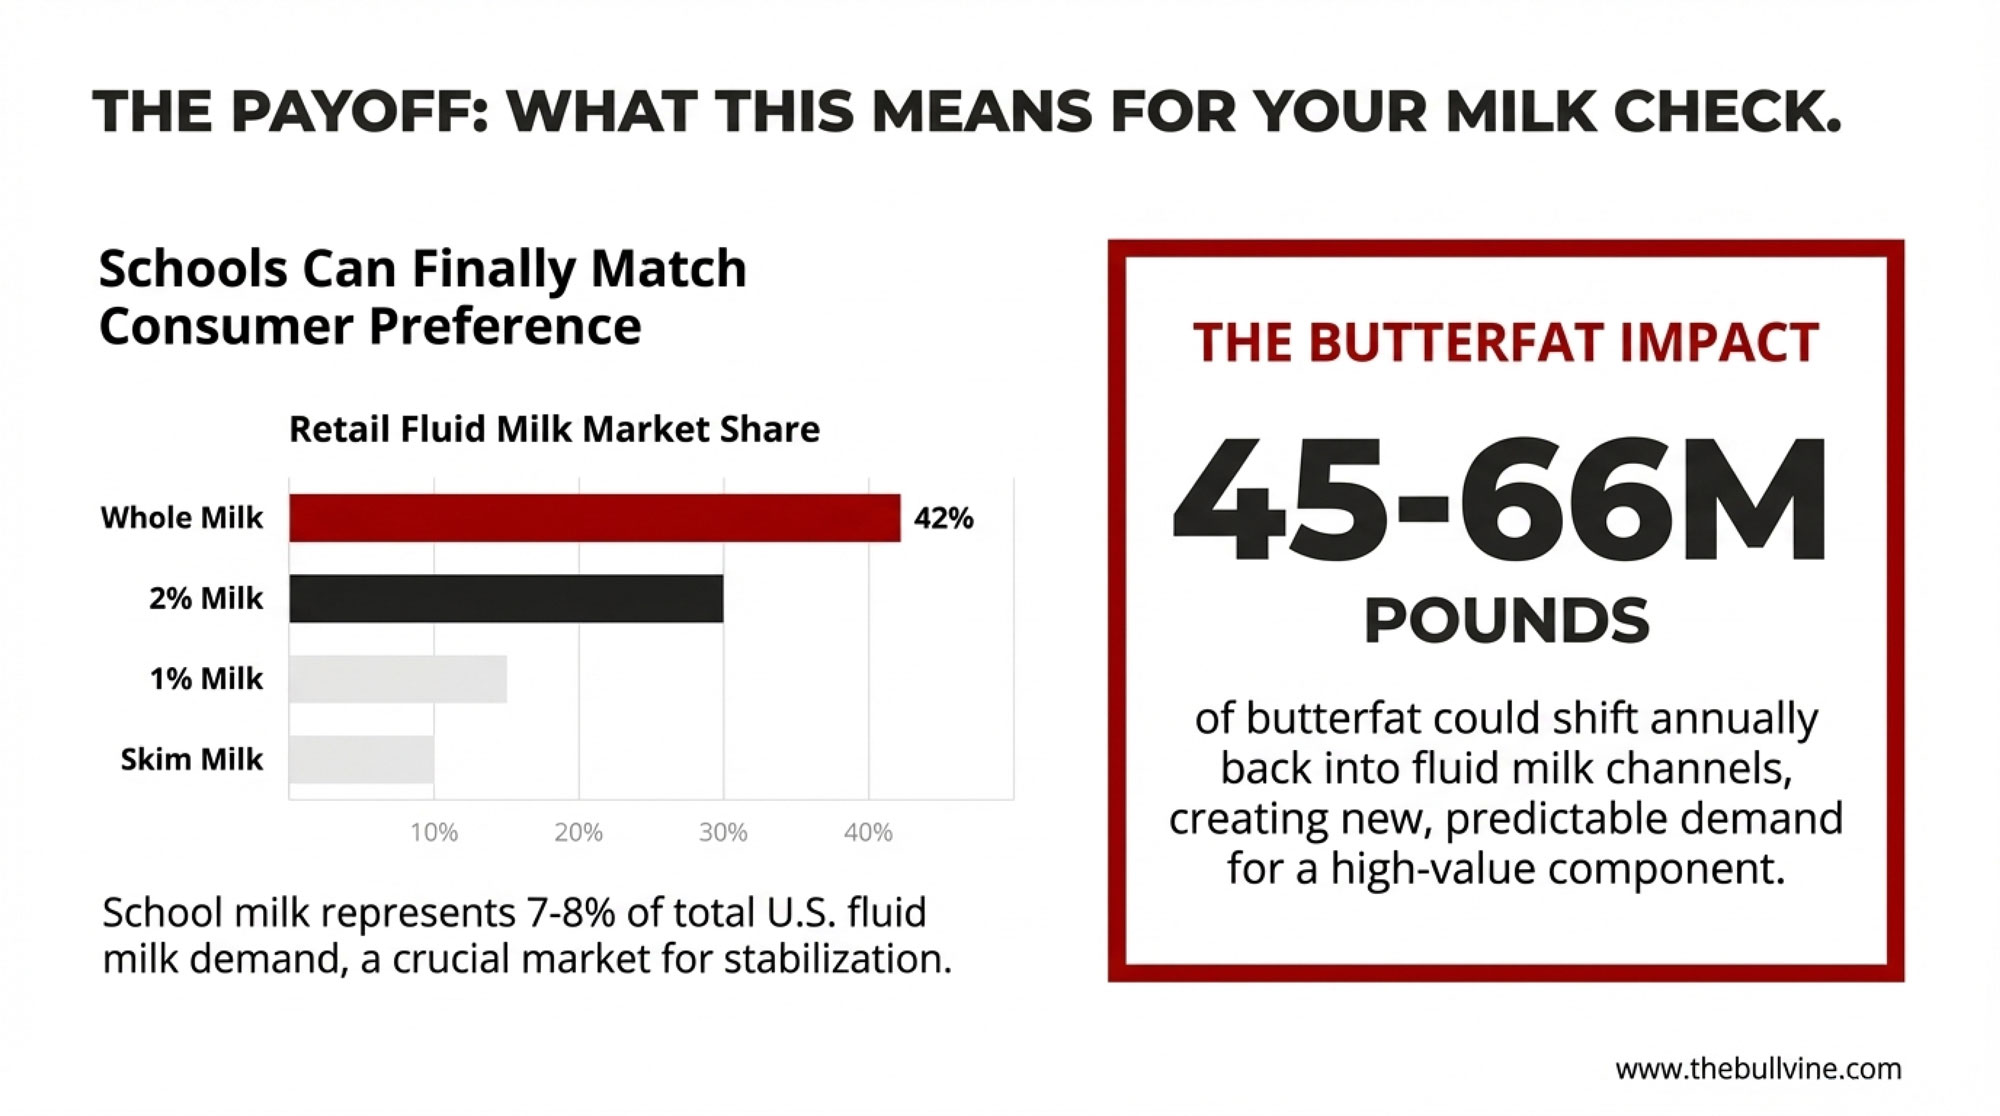
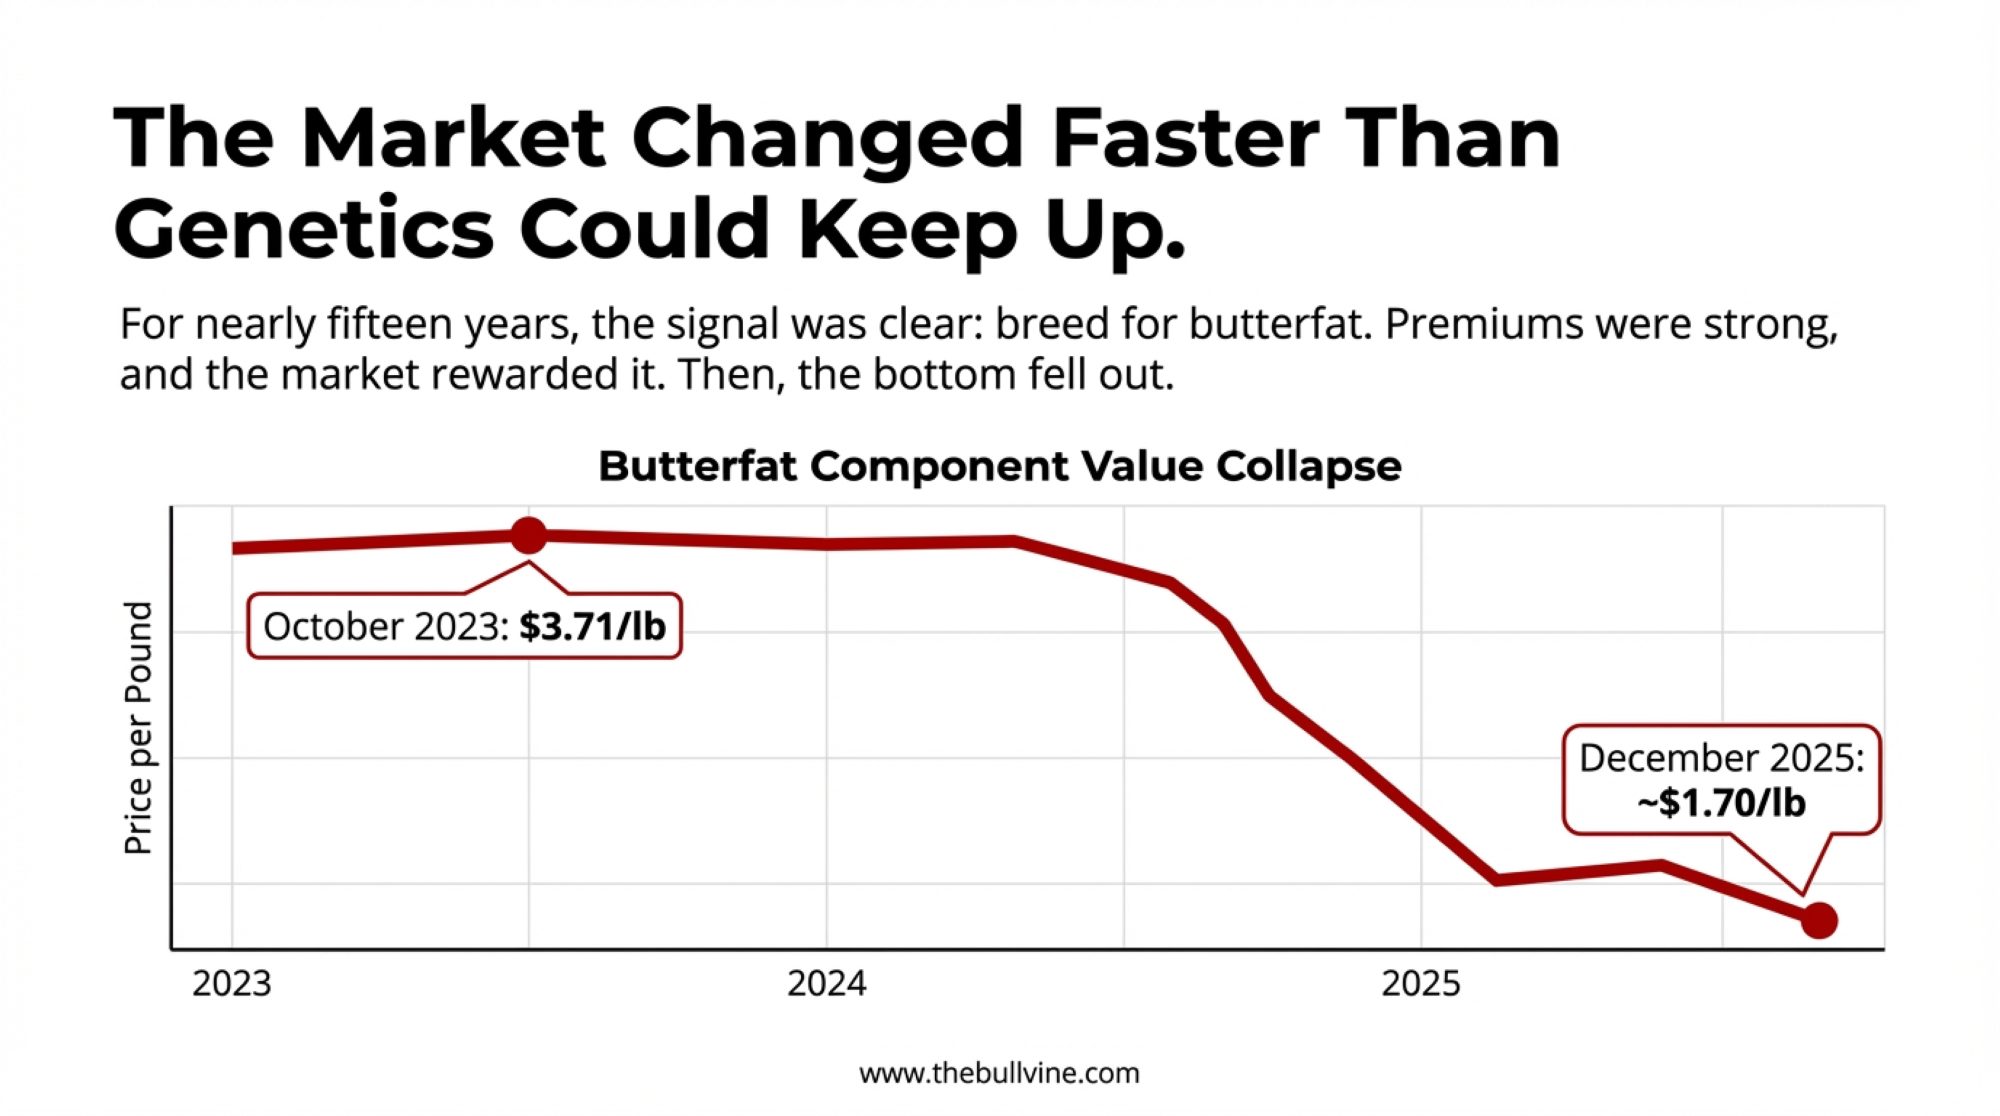
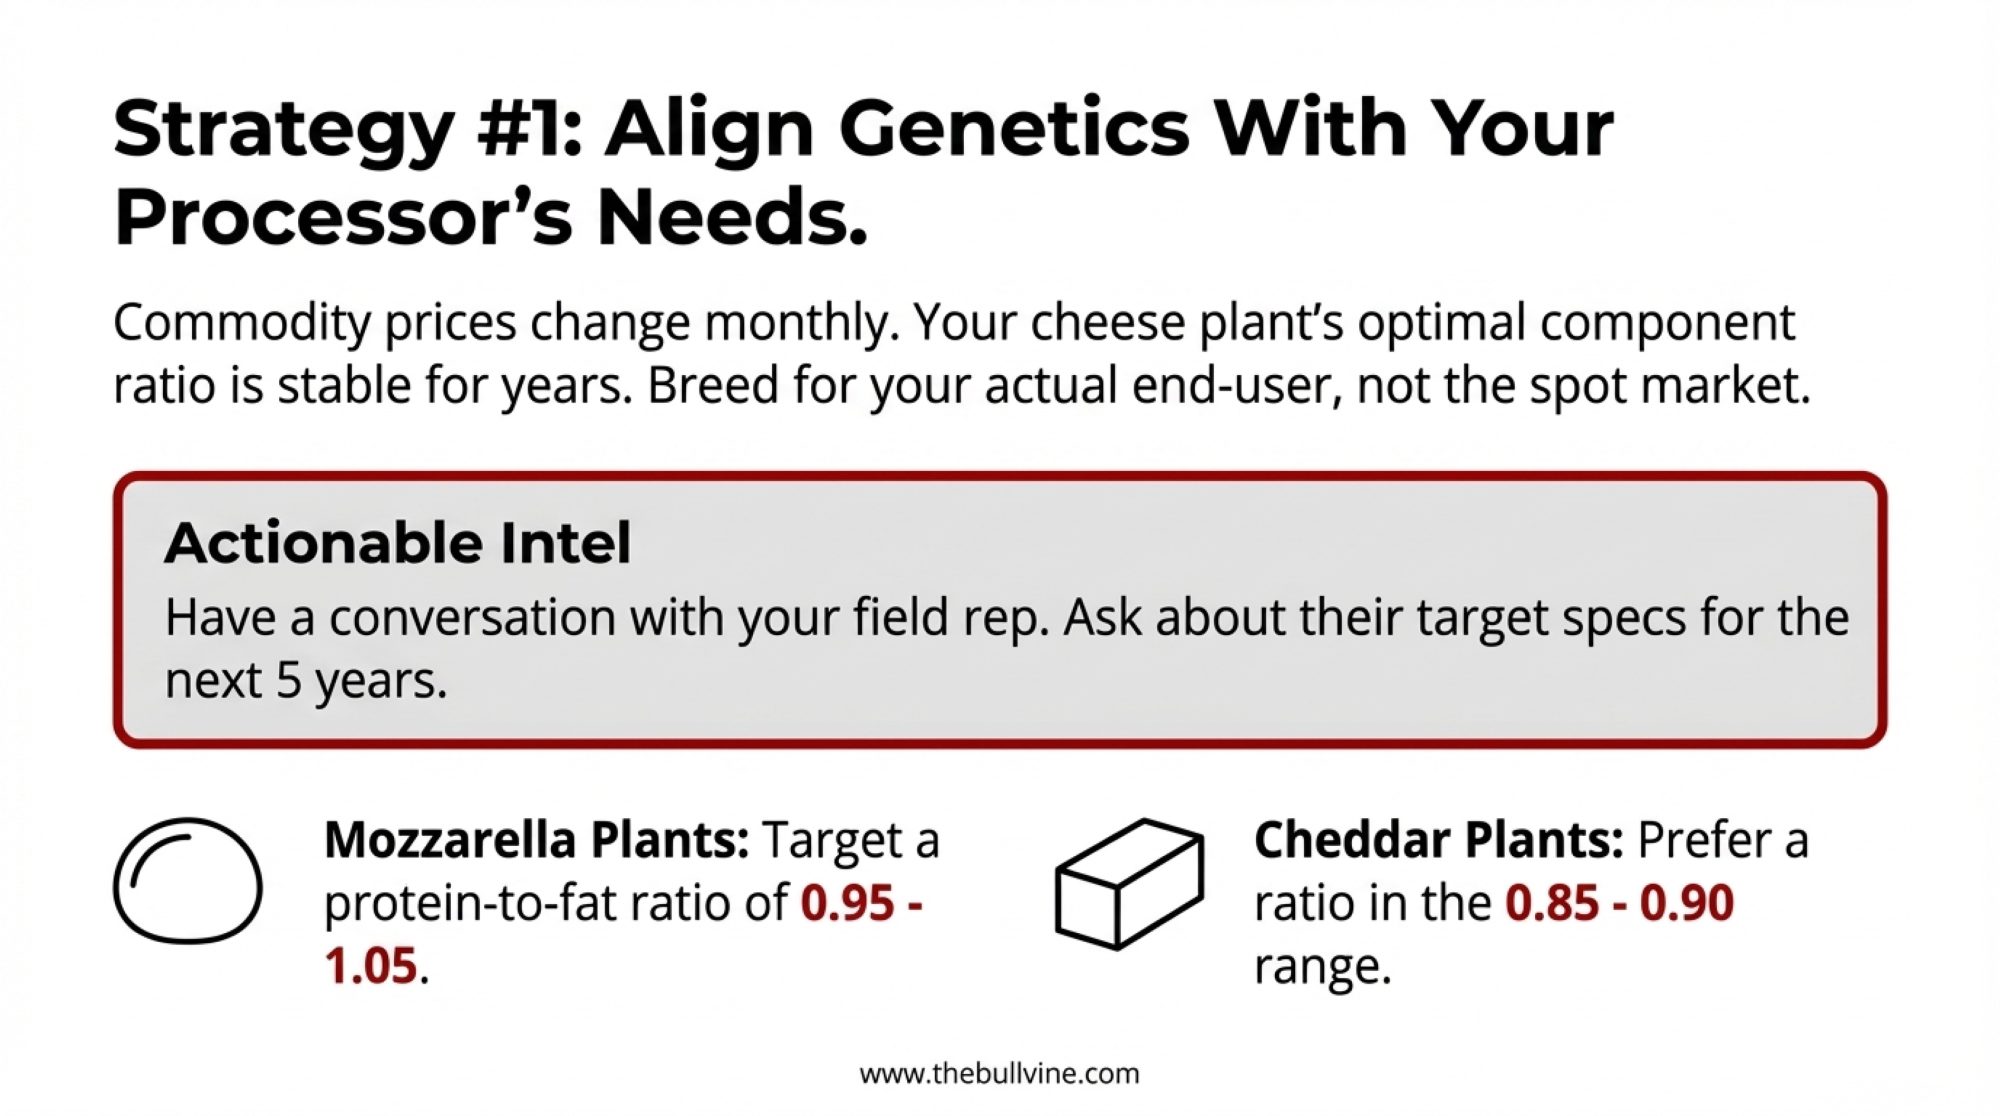
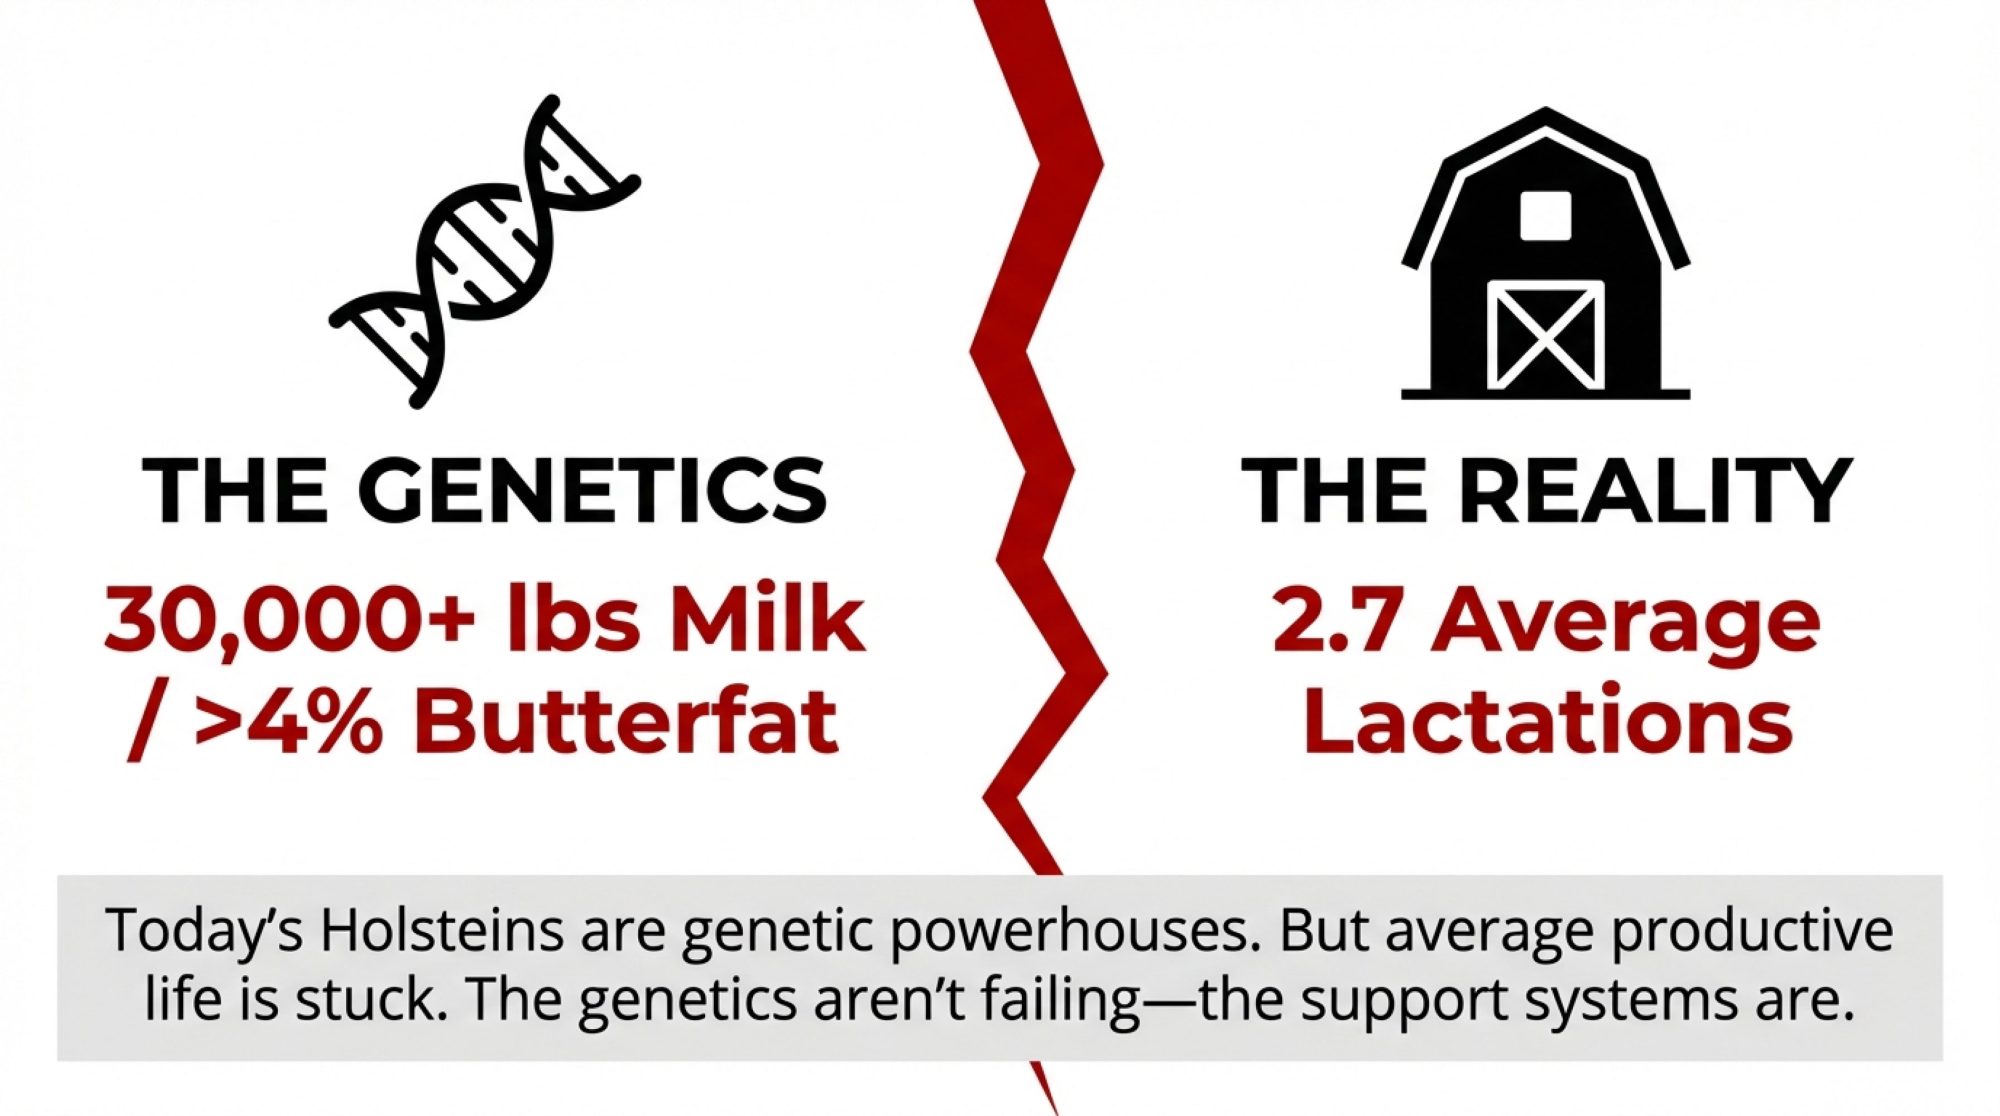
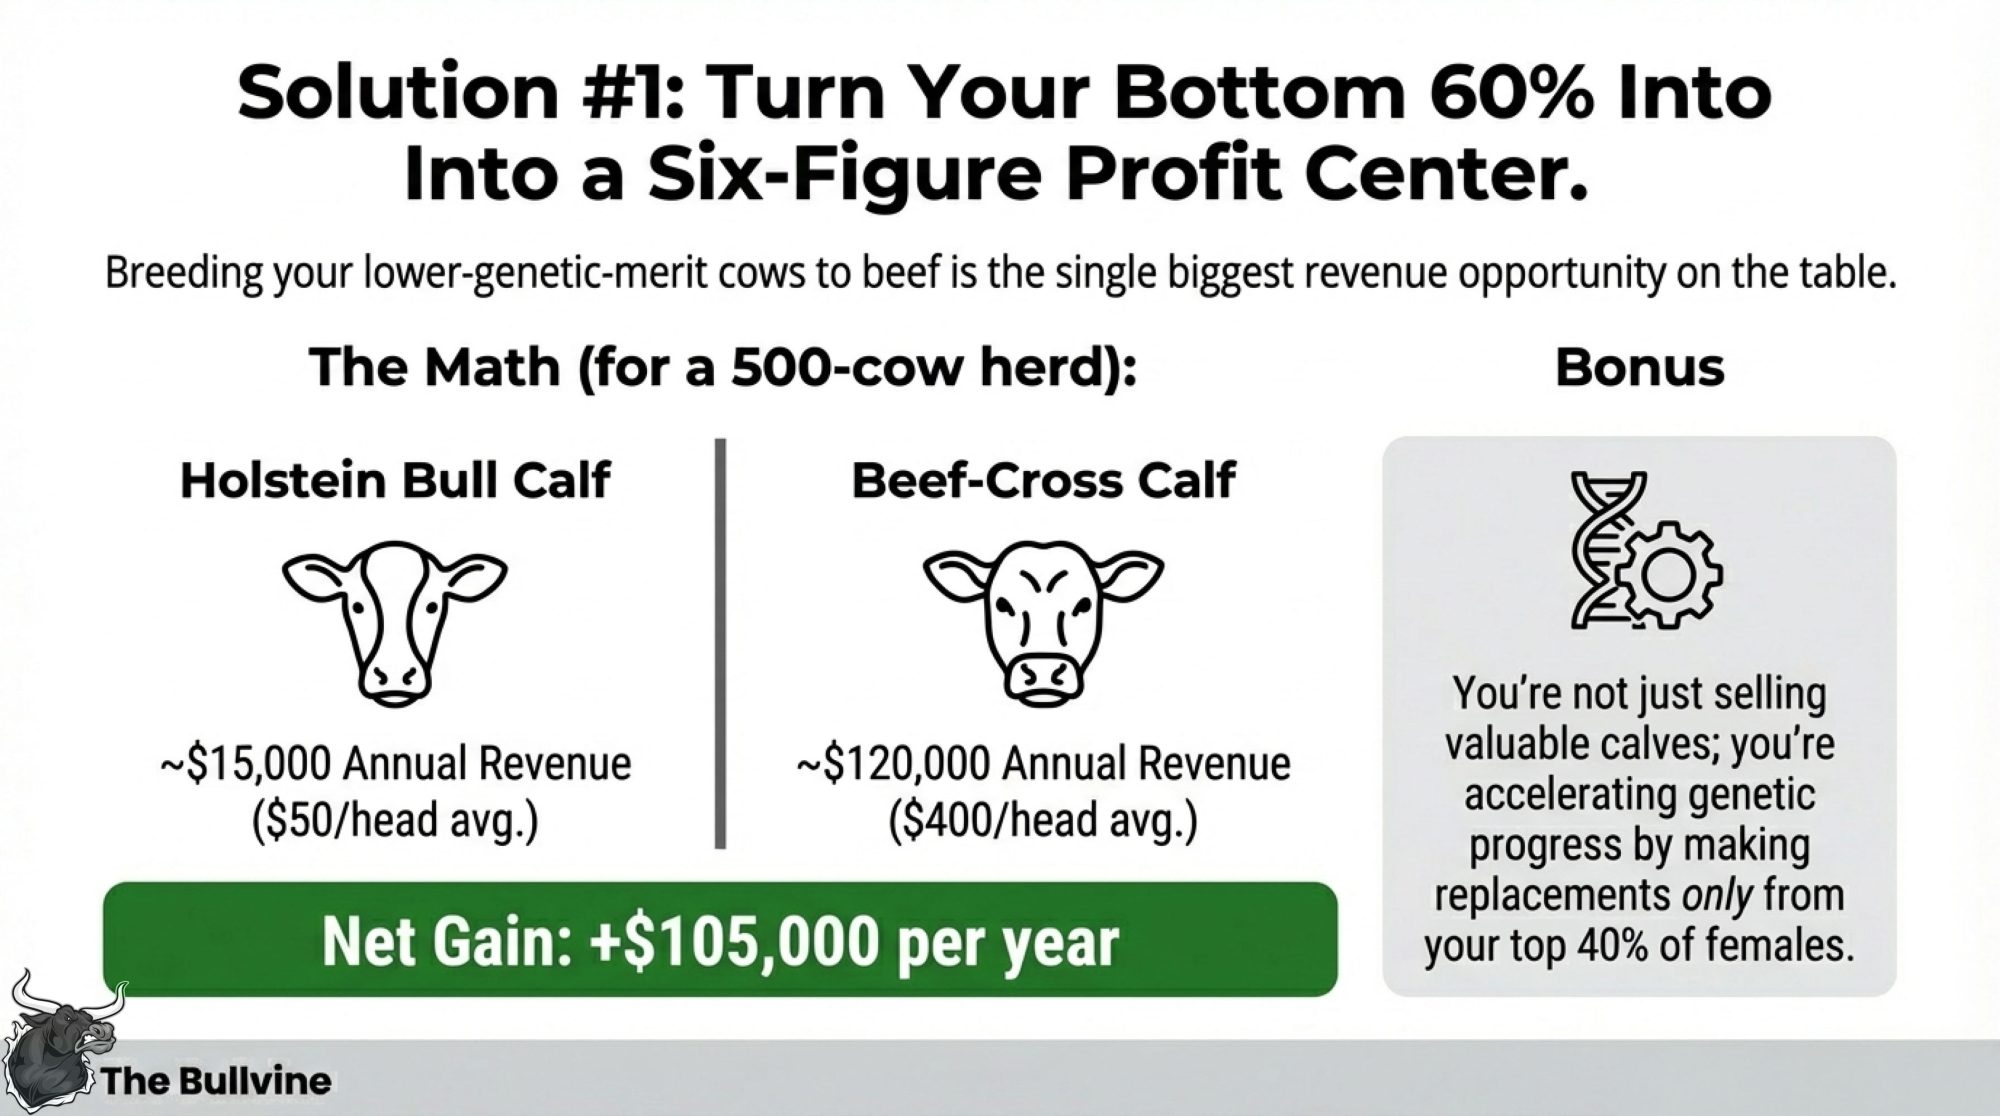
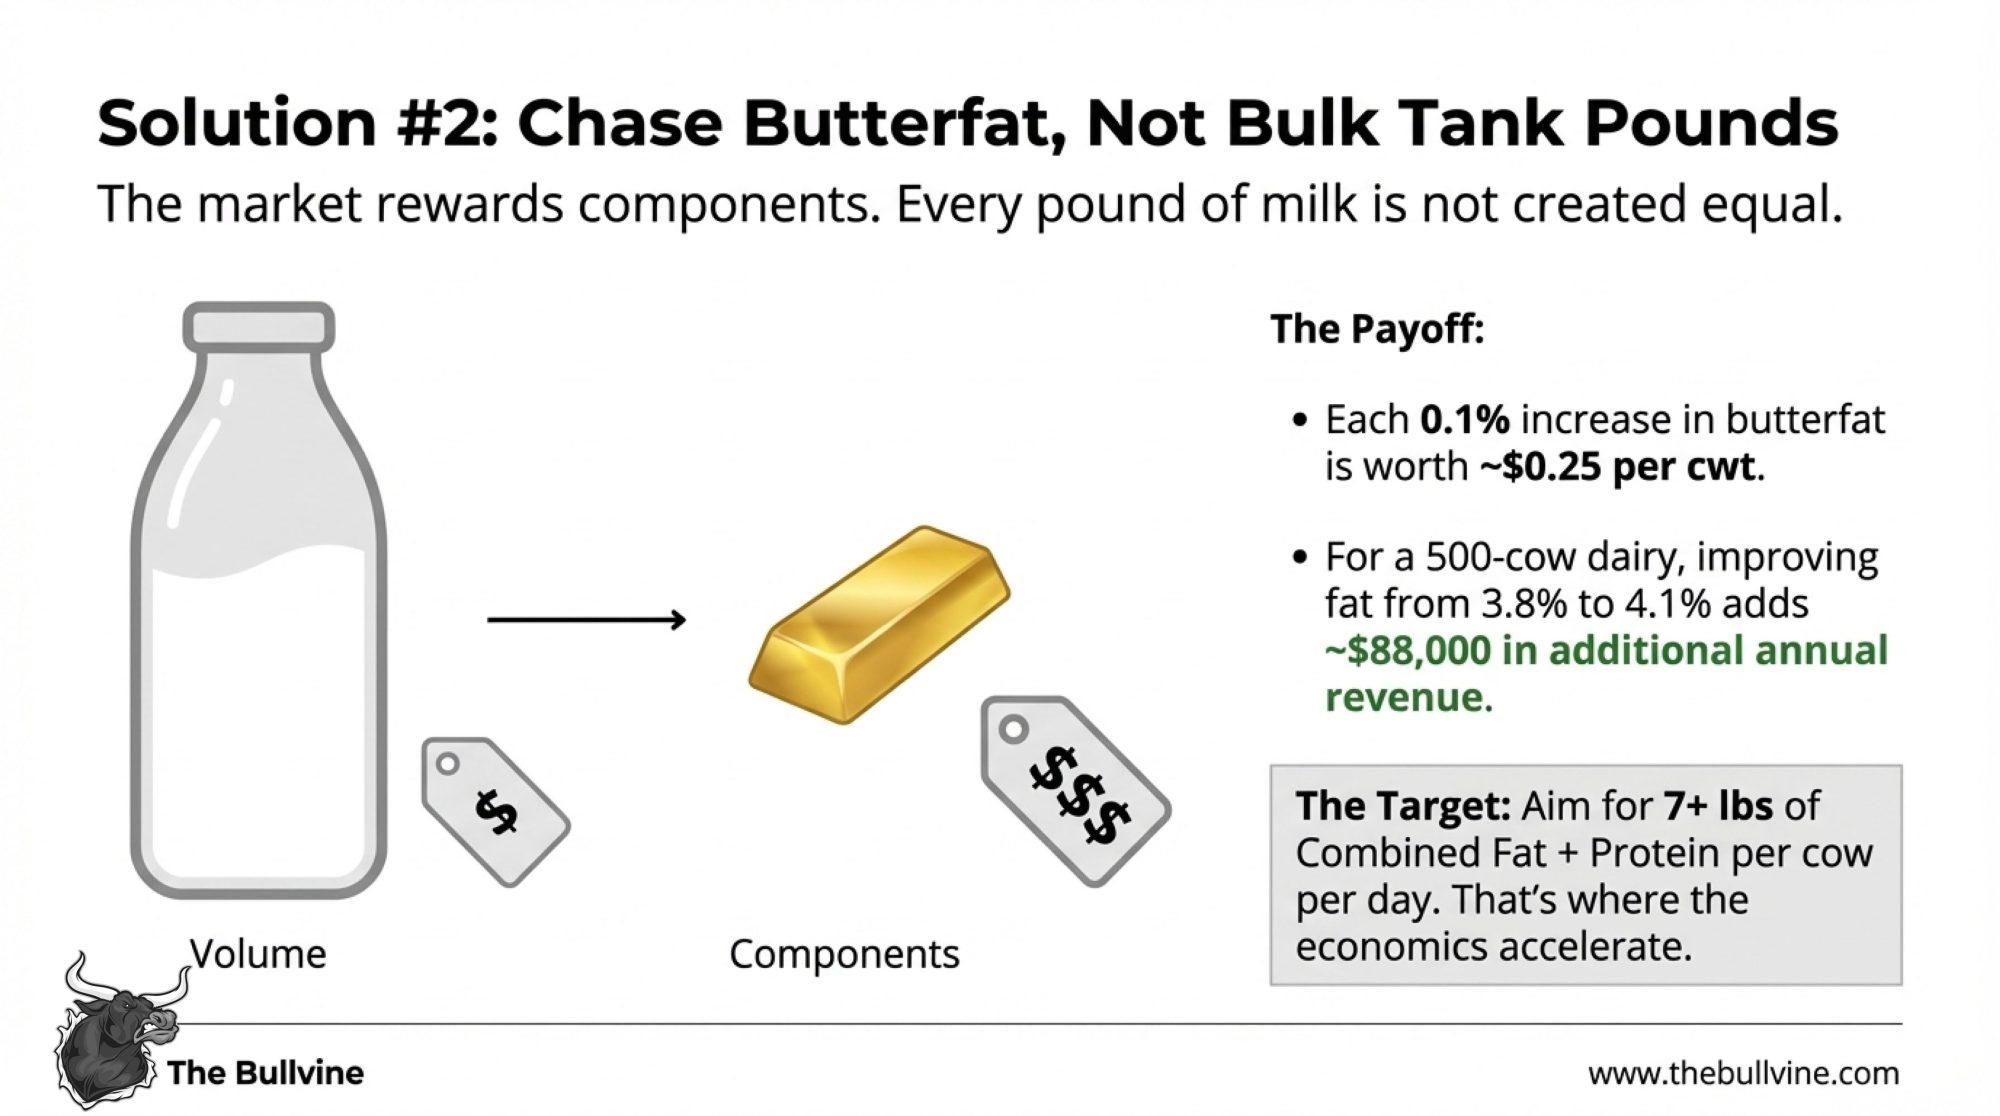
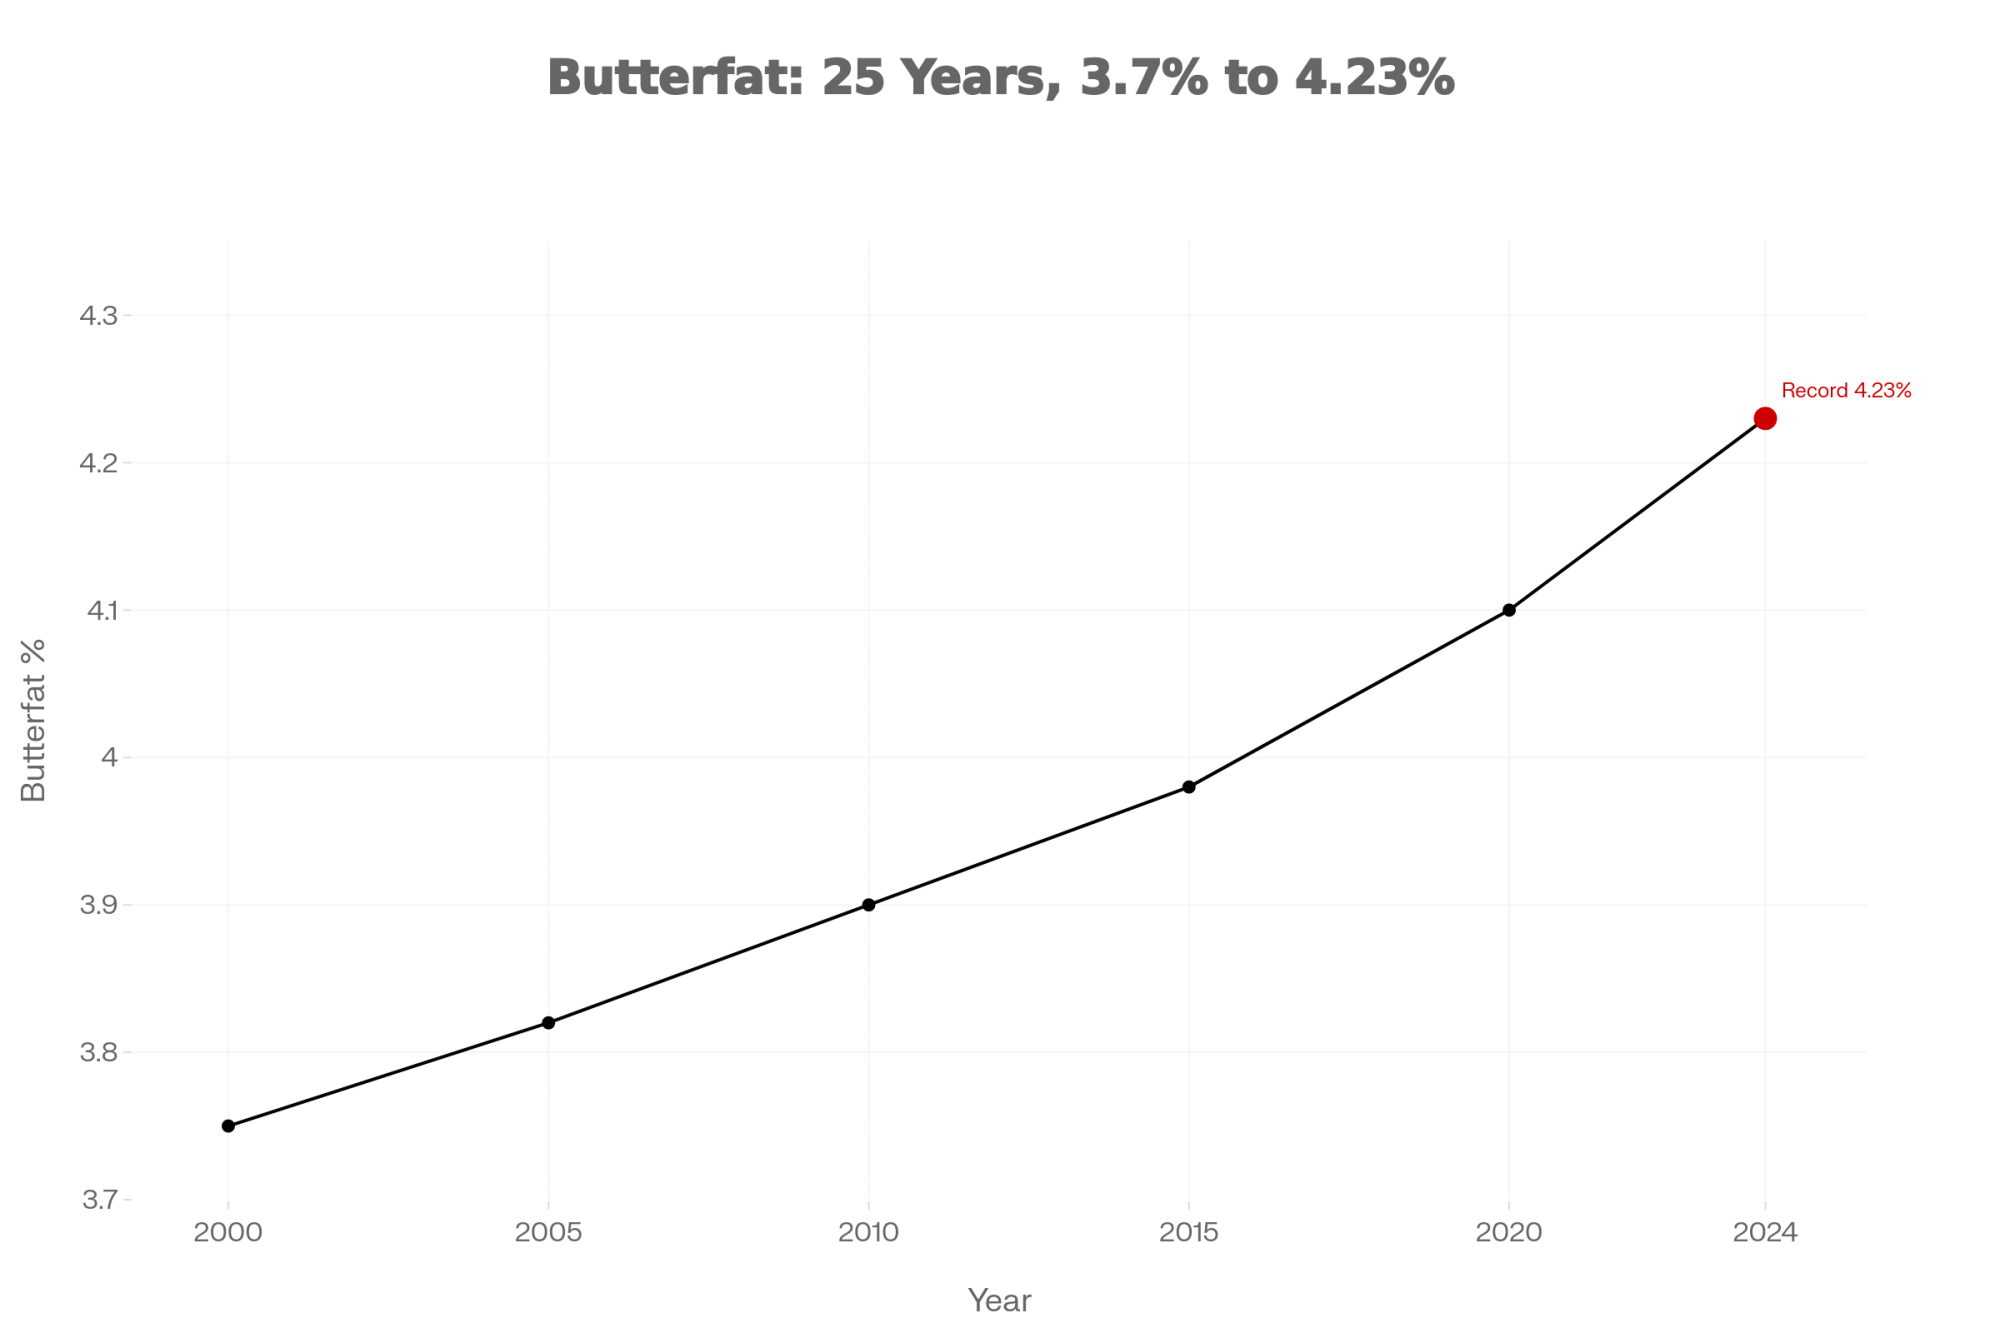
Component optimization rewards attention to genetics and nutrition. Operations targeting butterfat levels of 4.0%+ can capture meaningful premiums. Montbéliarde crosses and select Holstein families have shown strong component performance, though results vary by management system and feeding program.
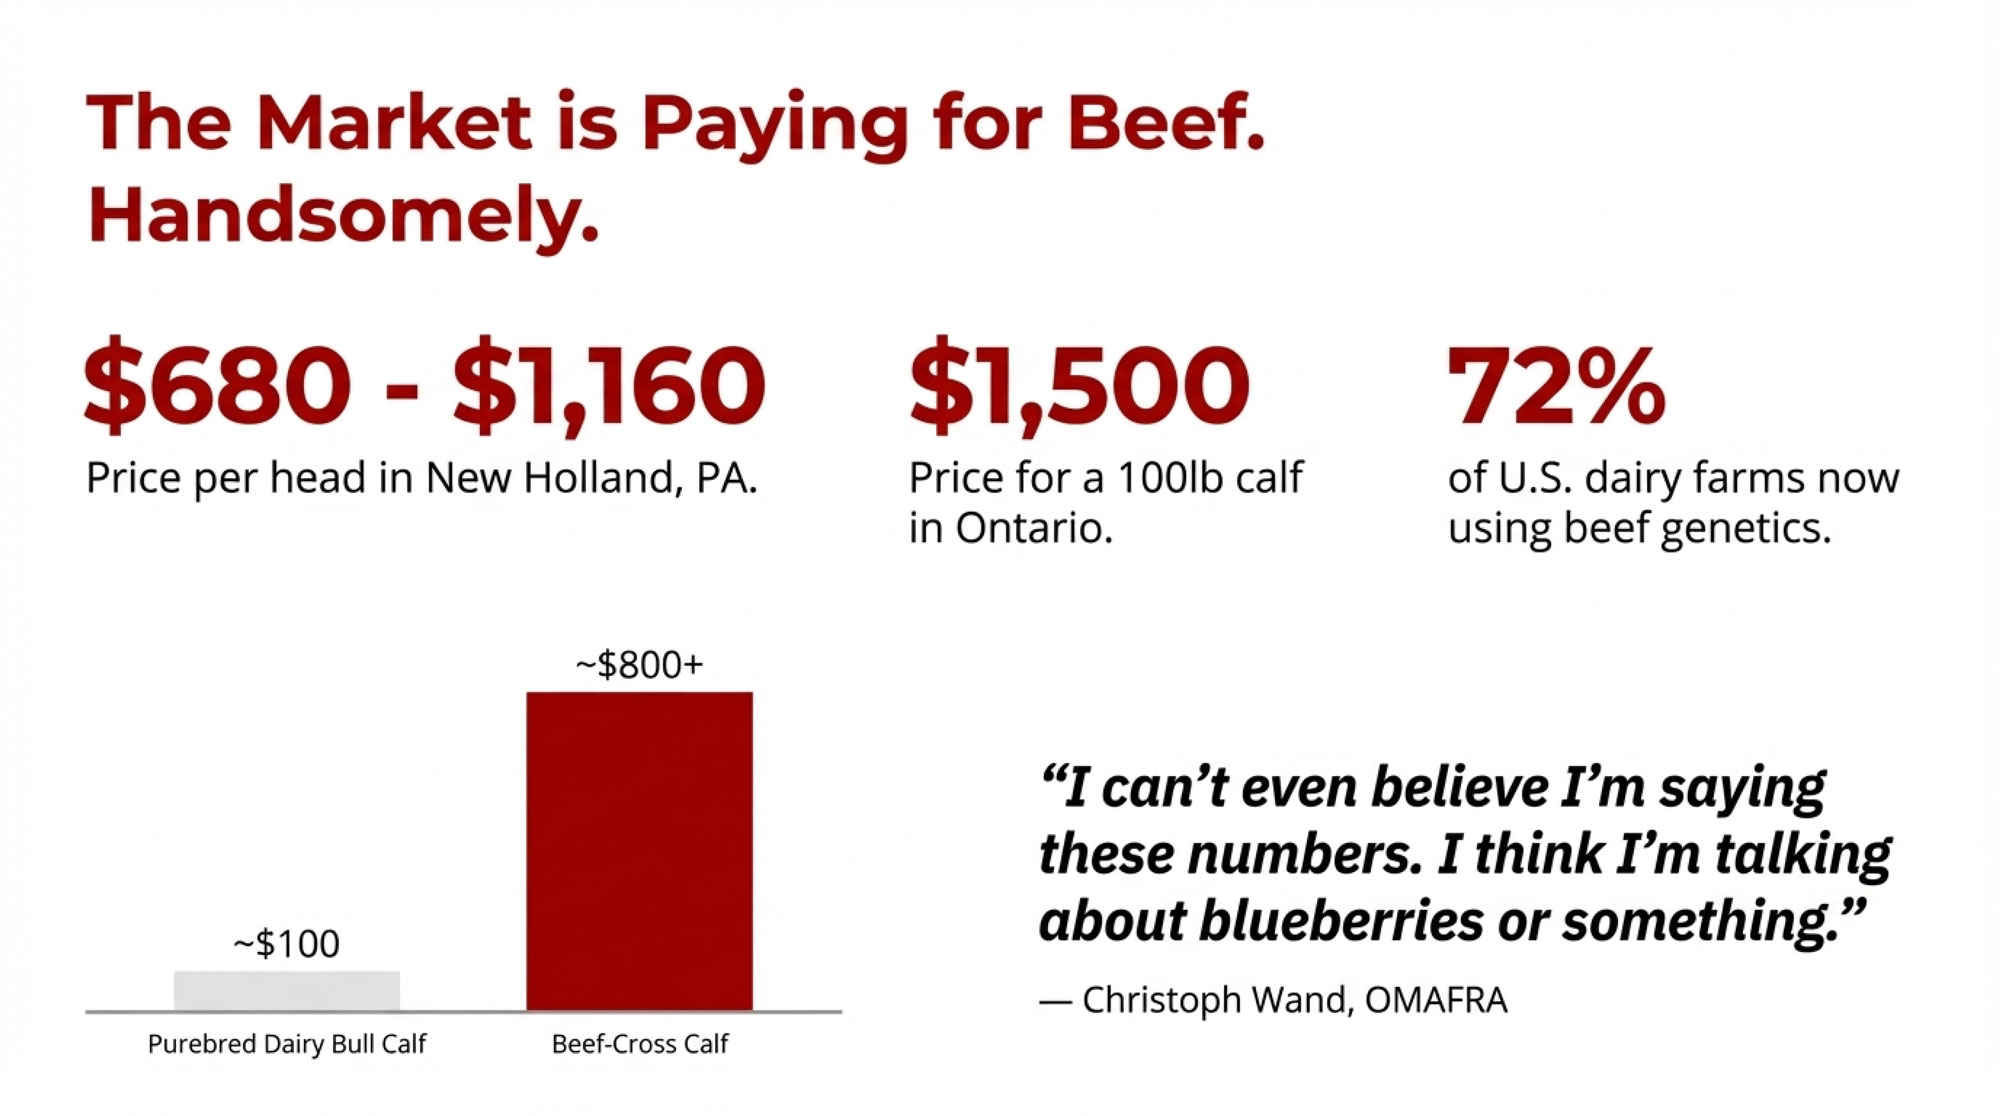
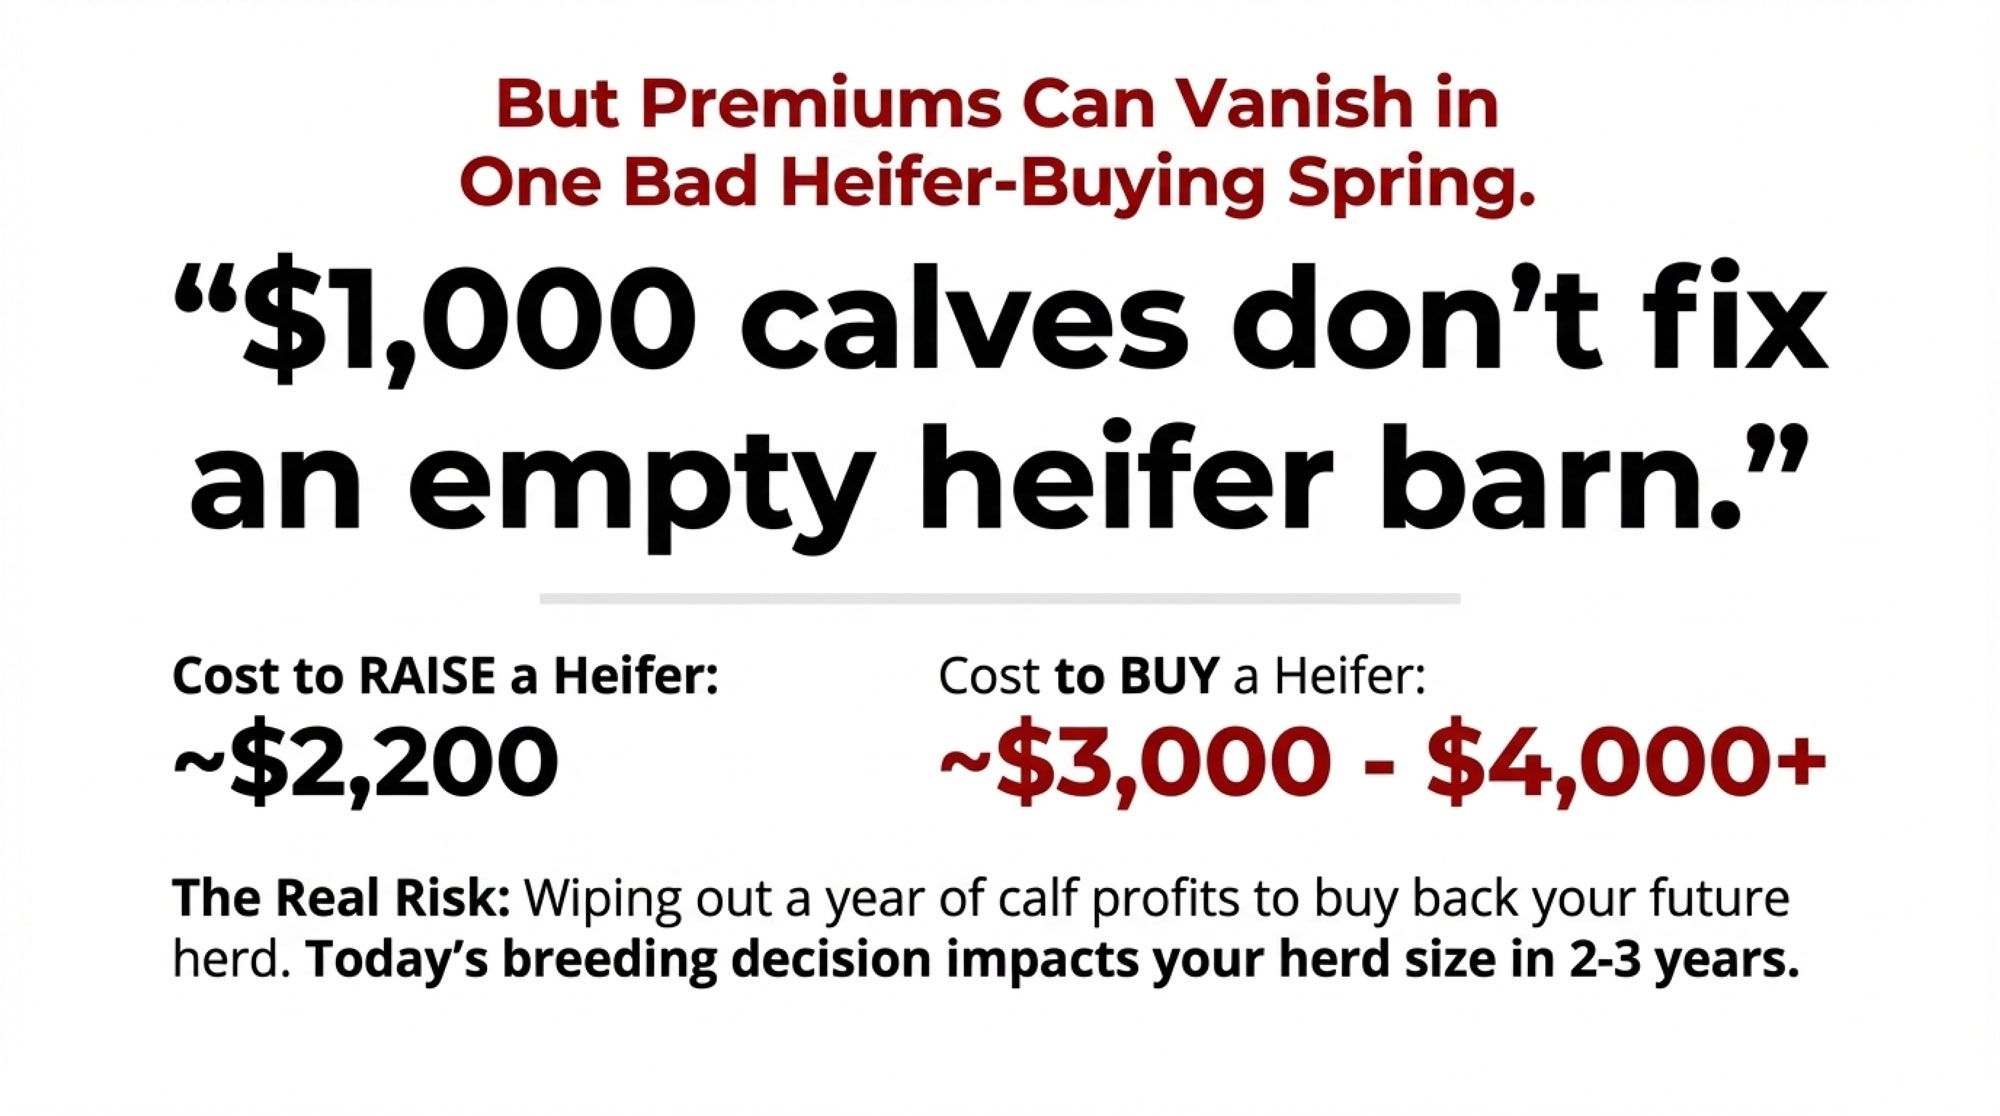
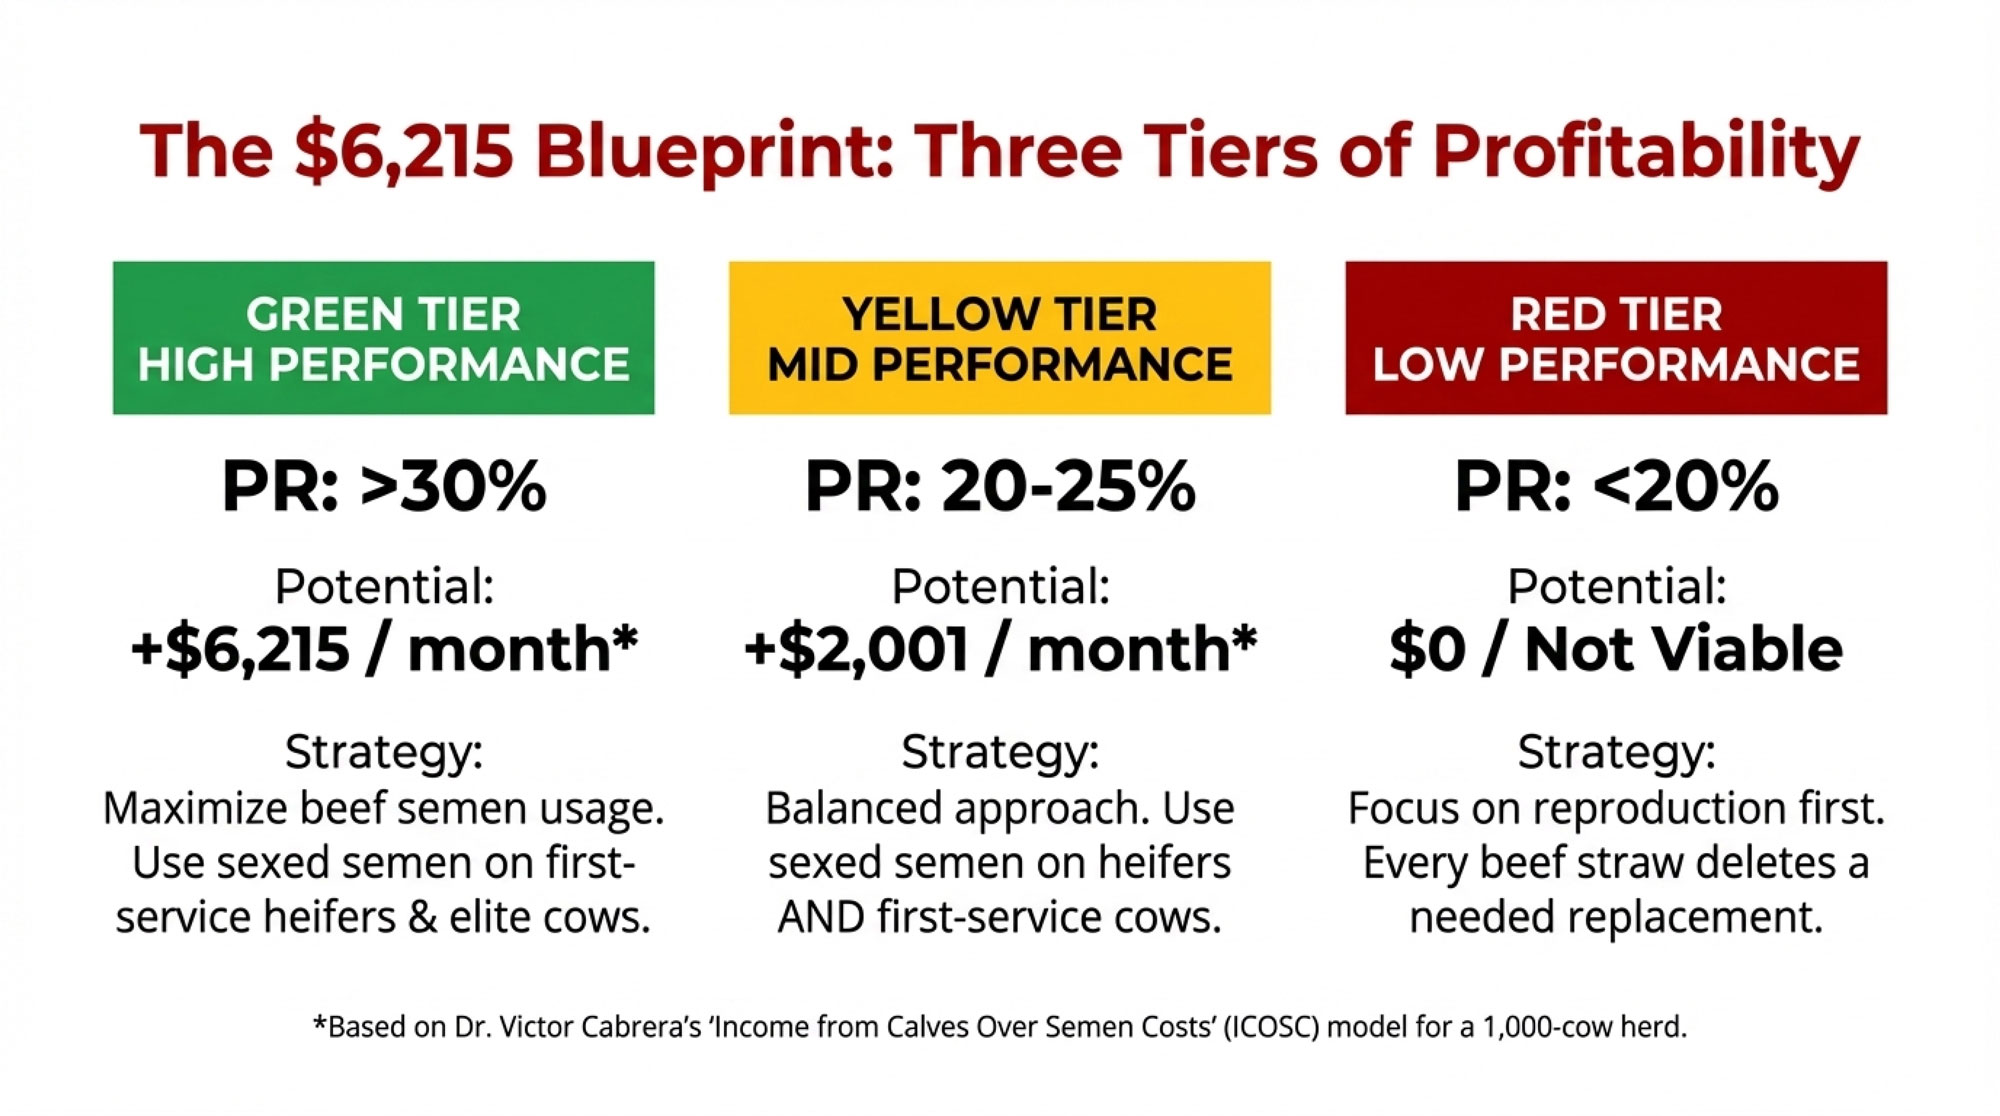
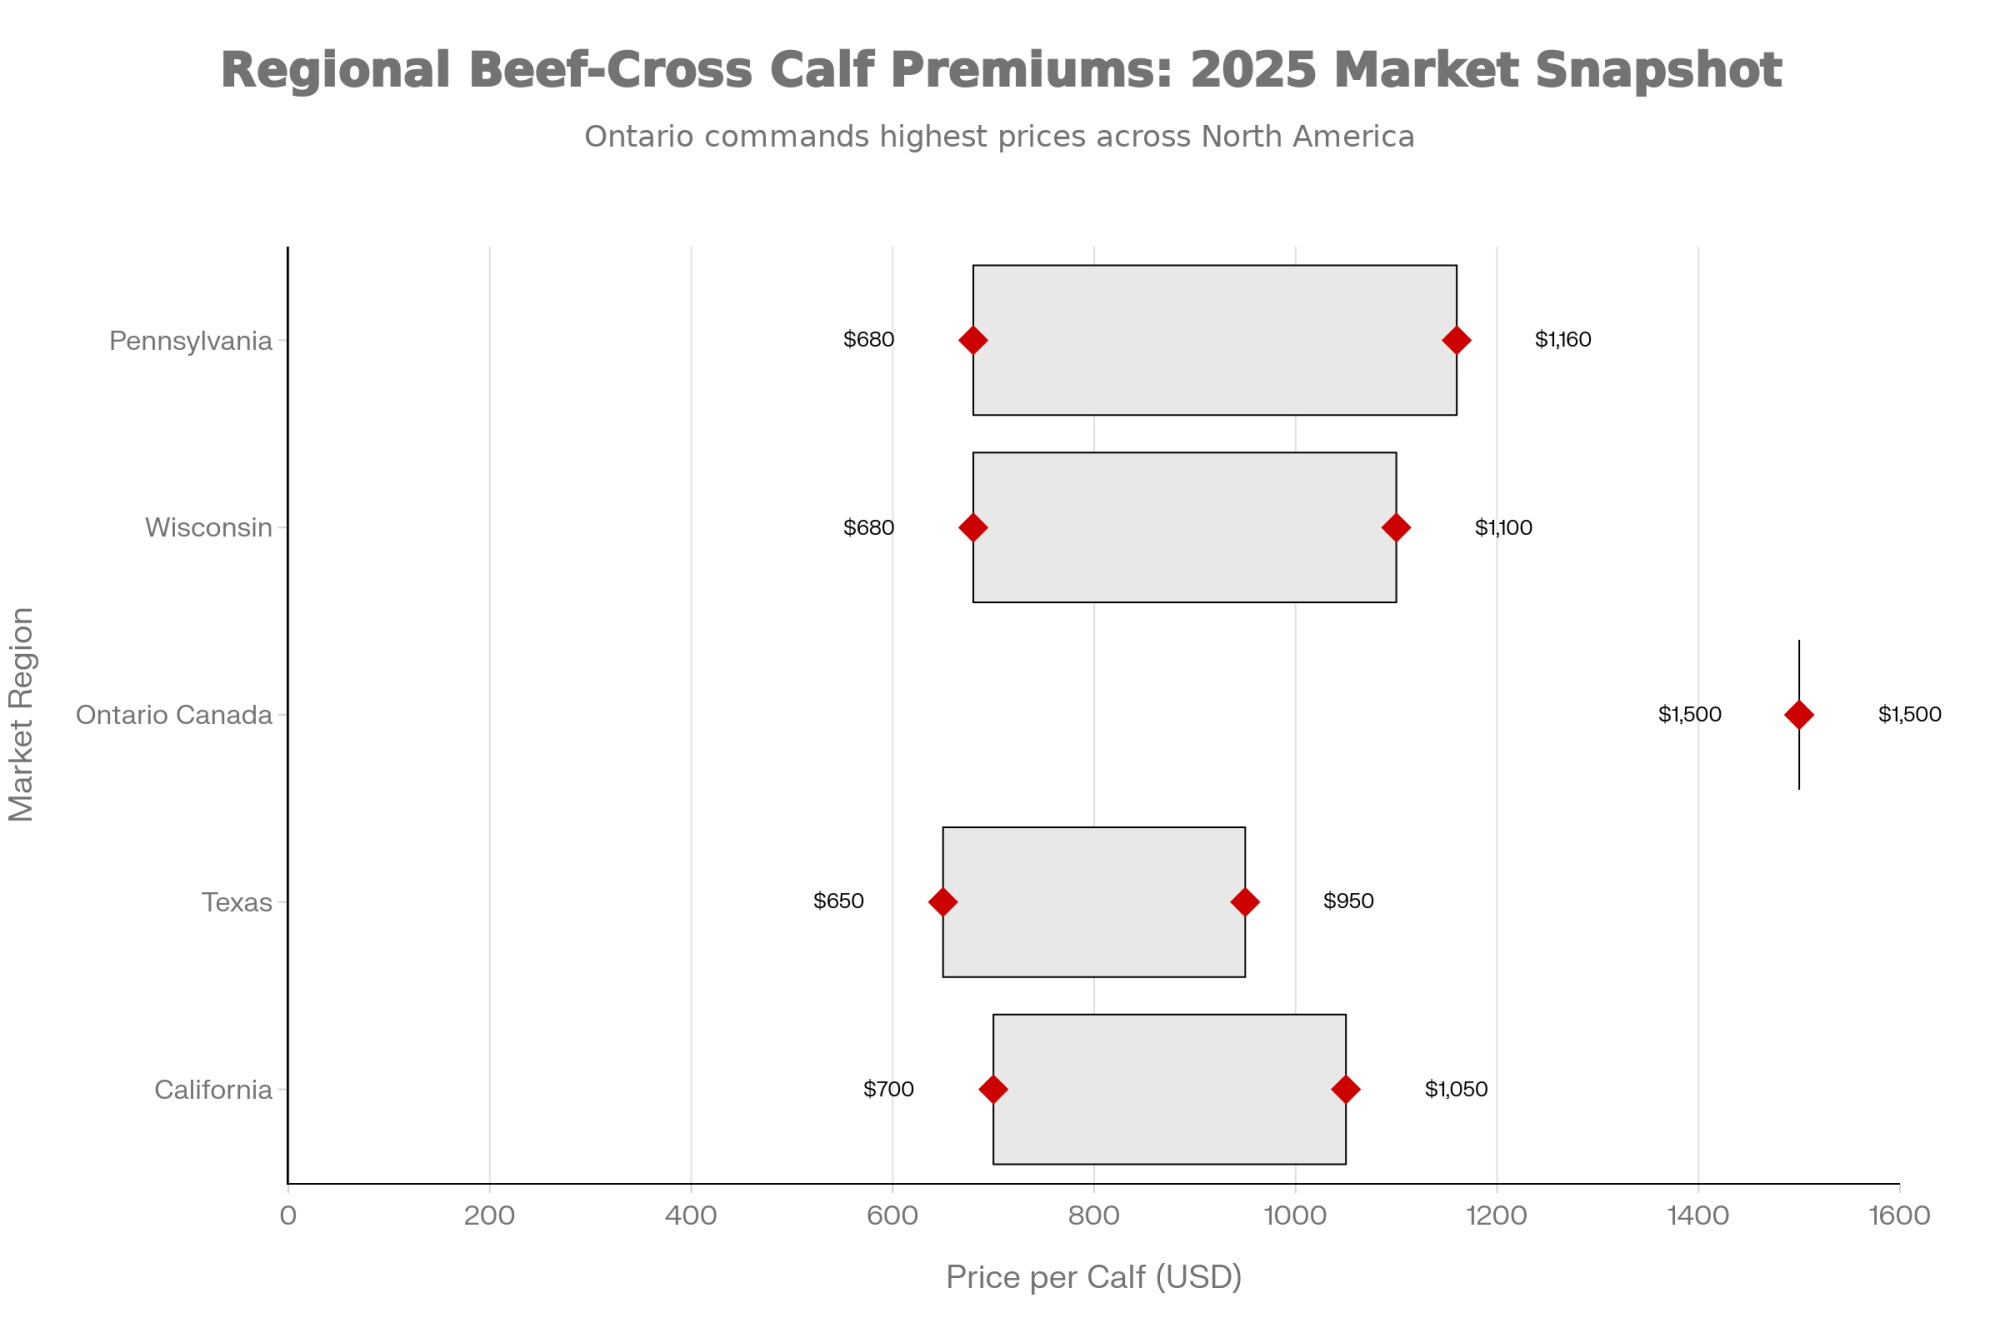
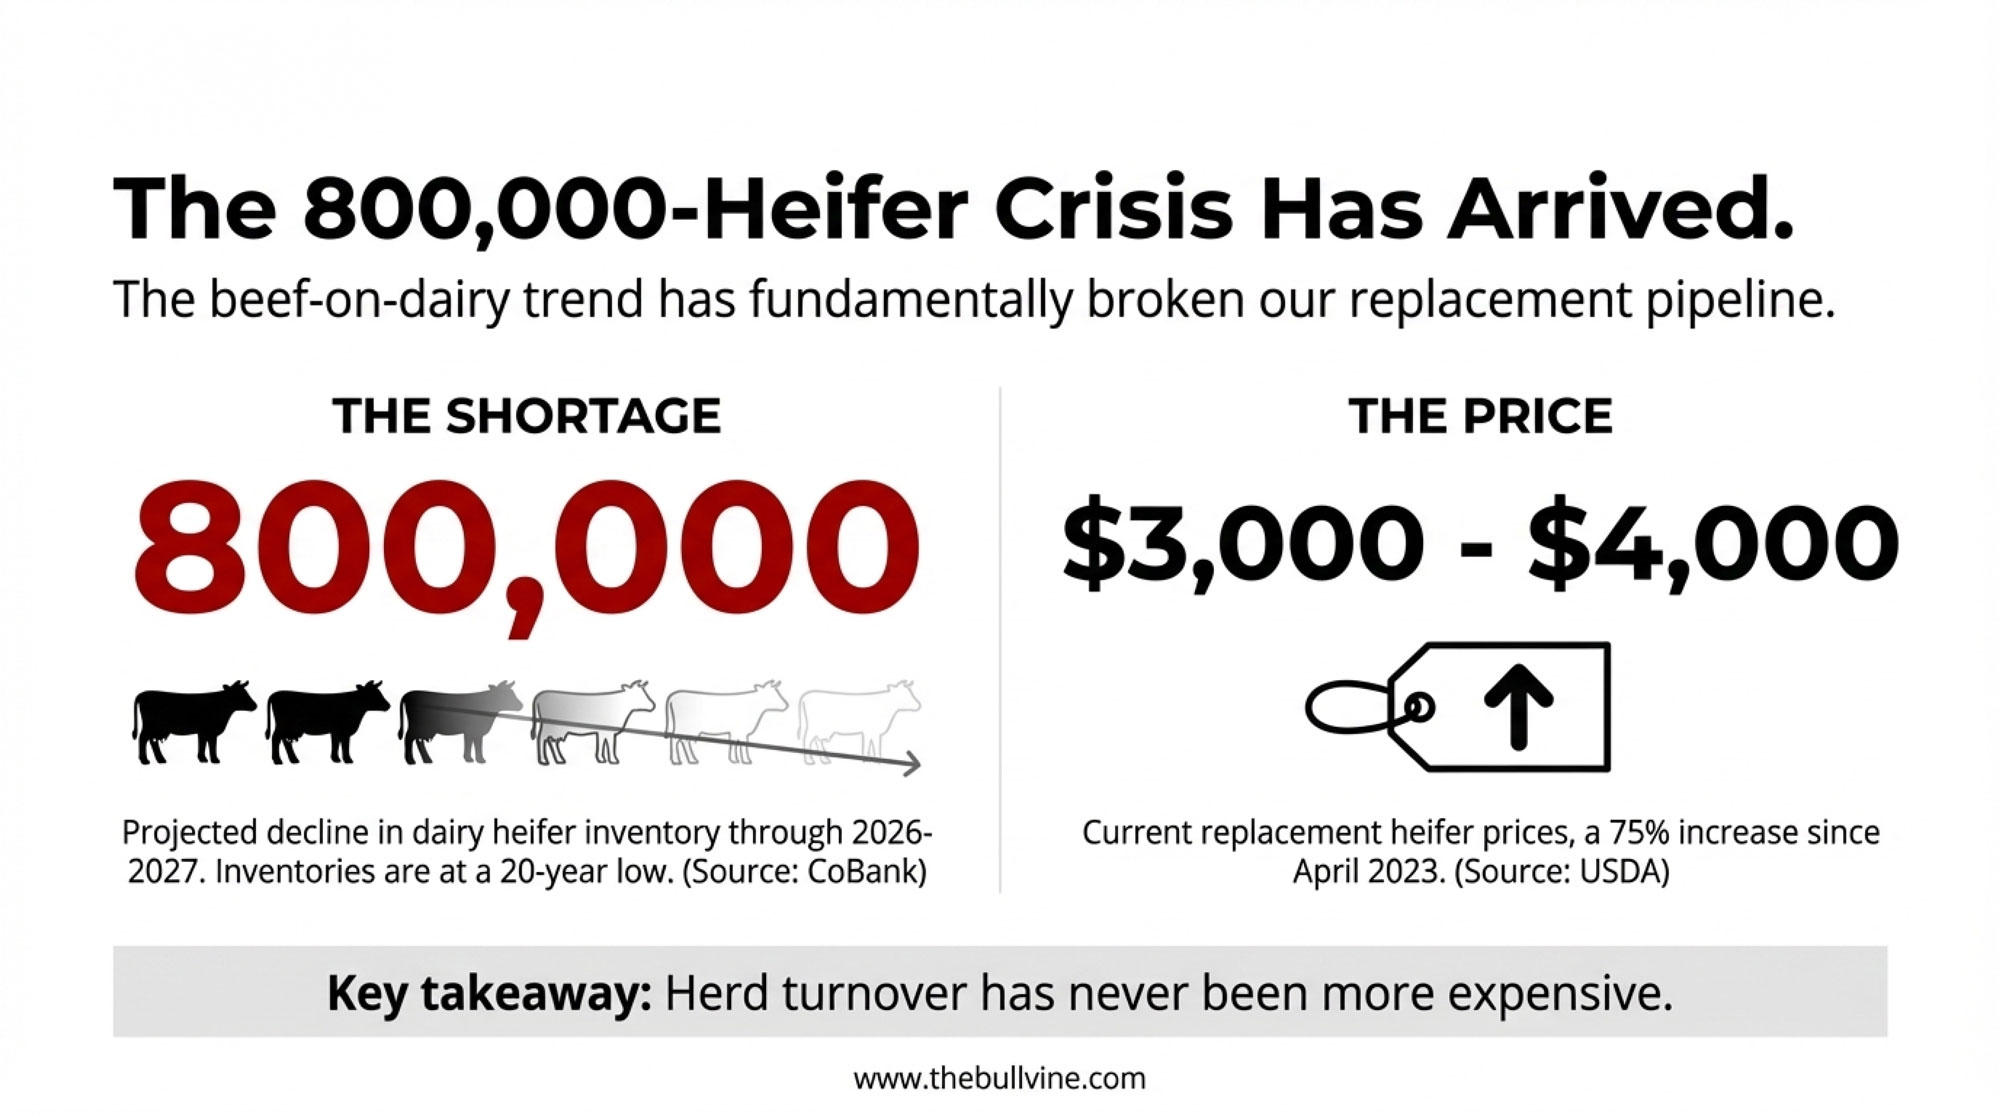
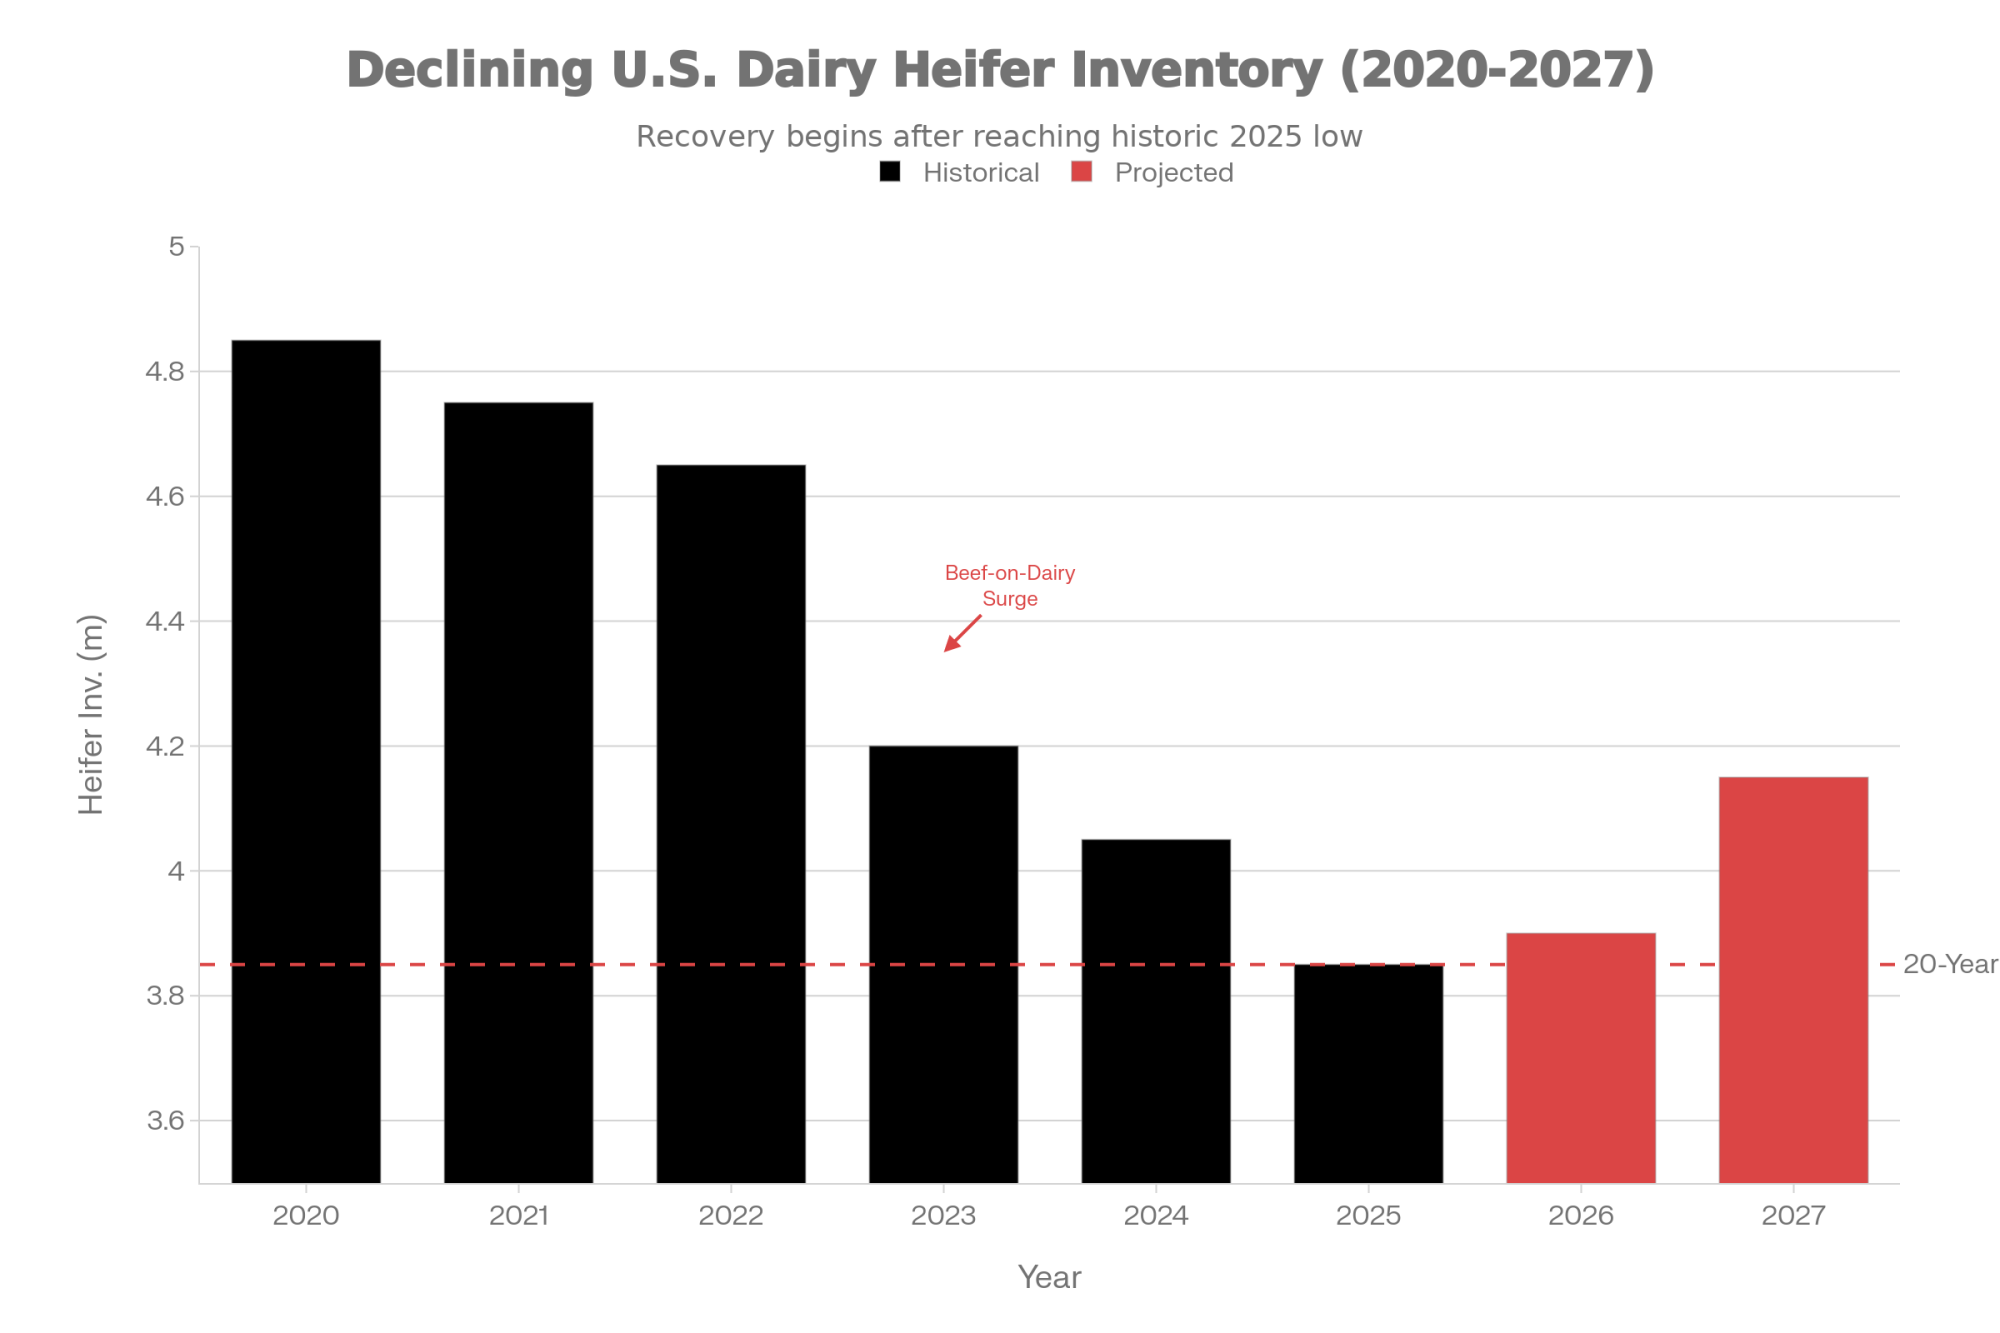
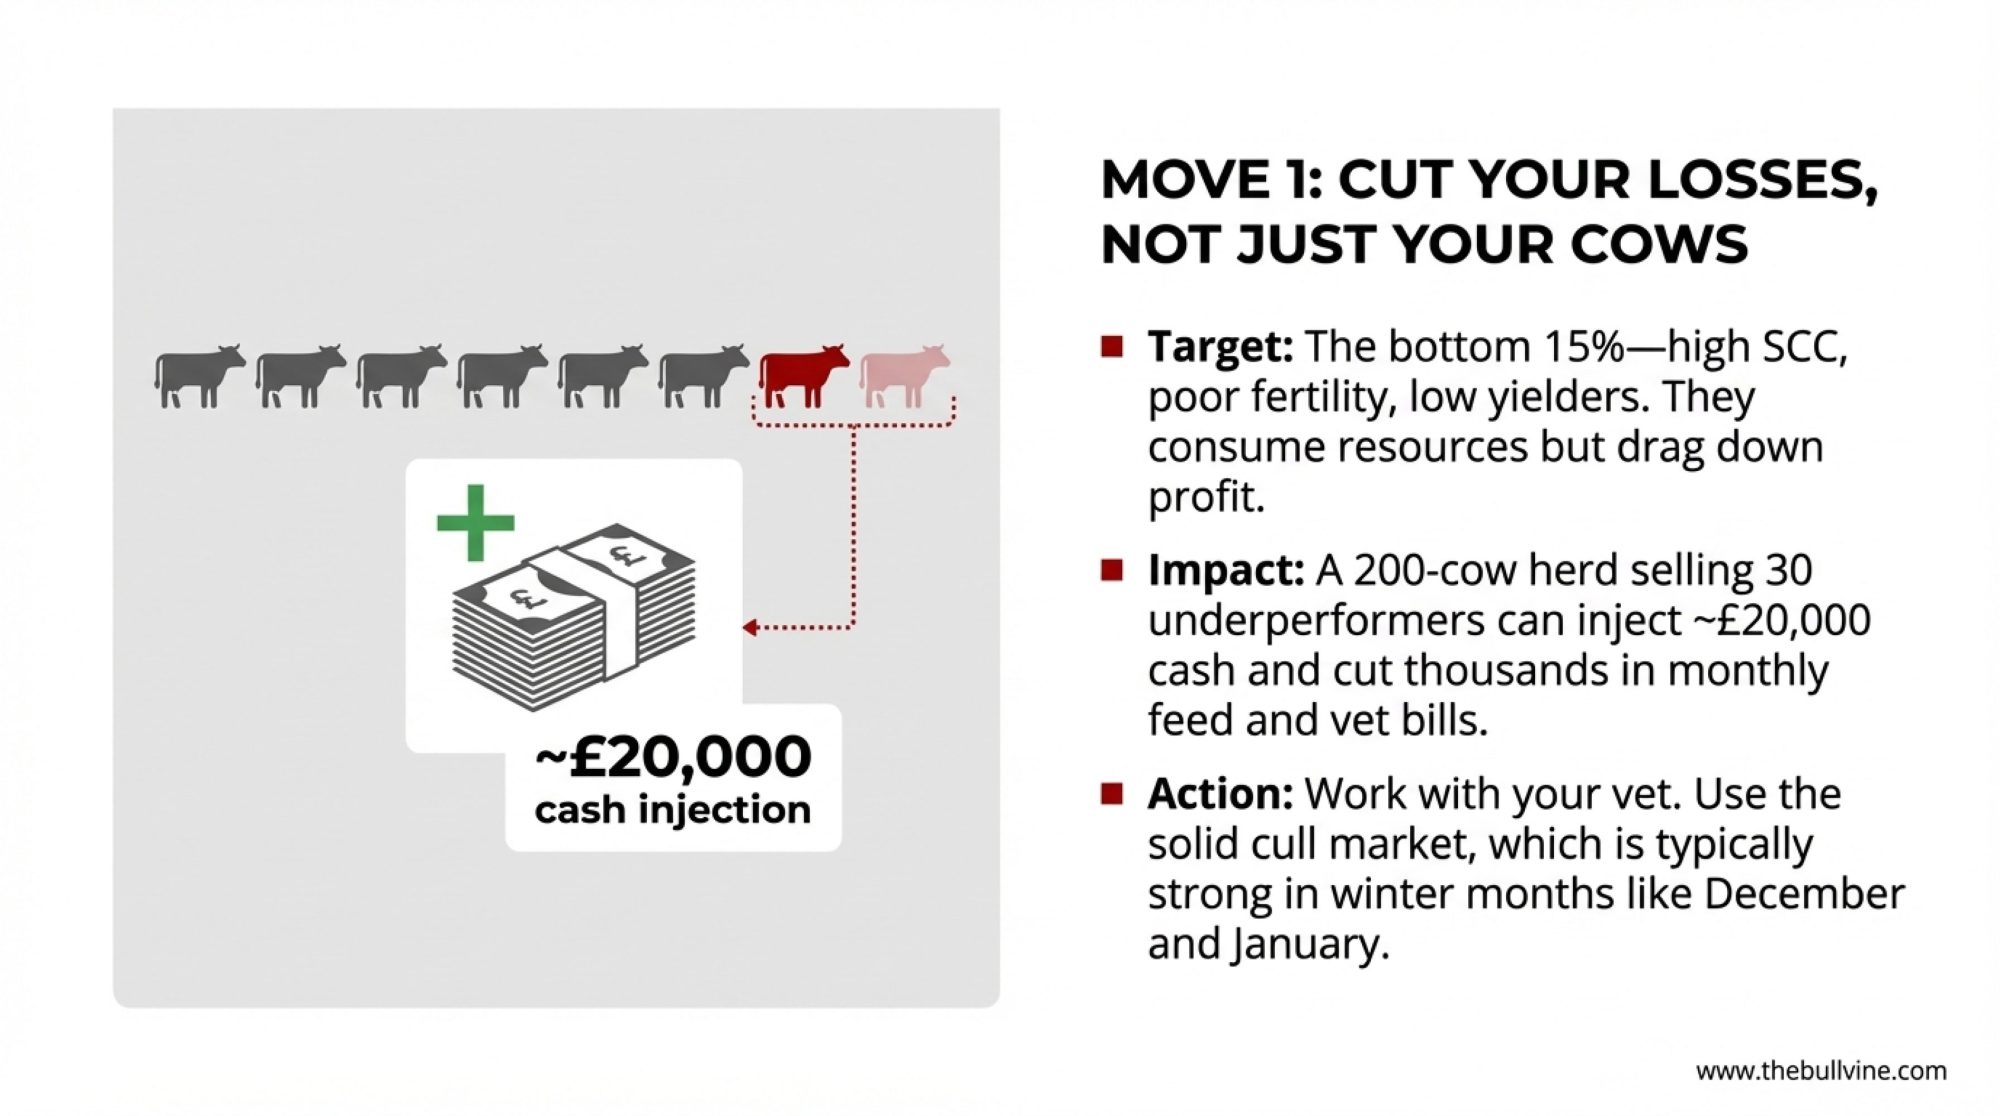
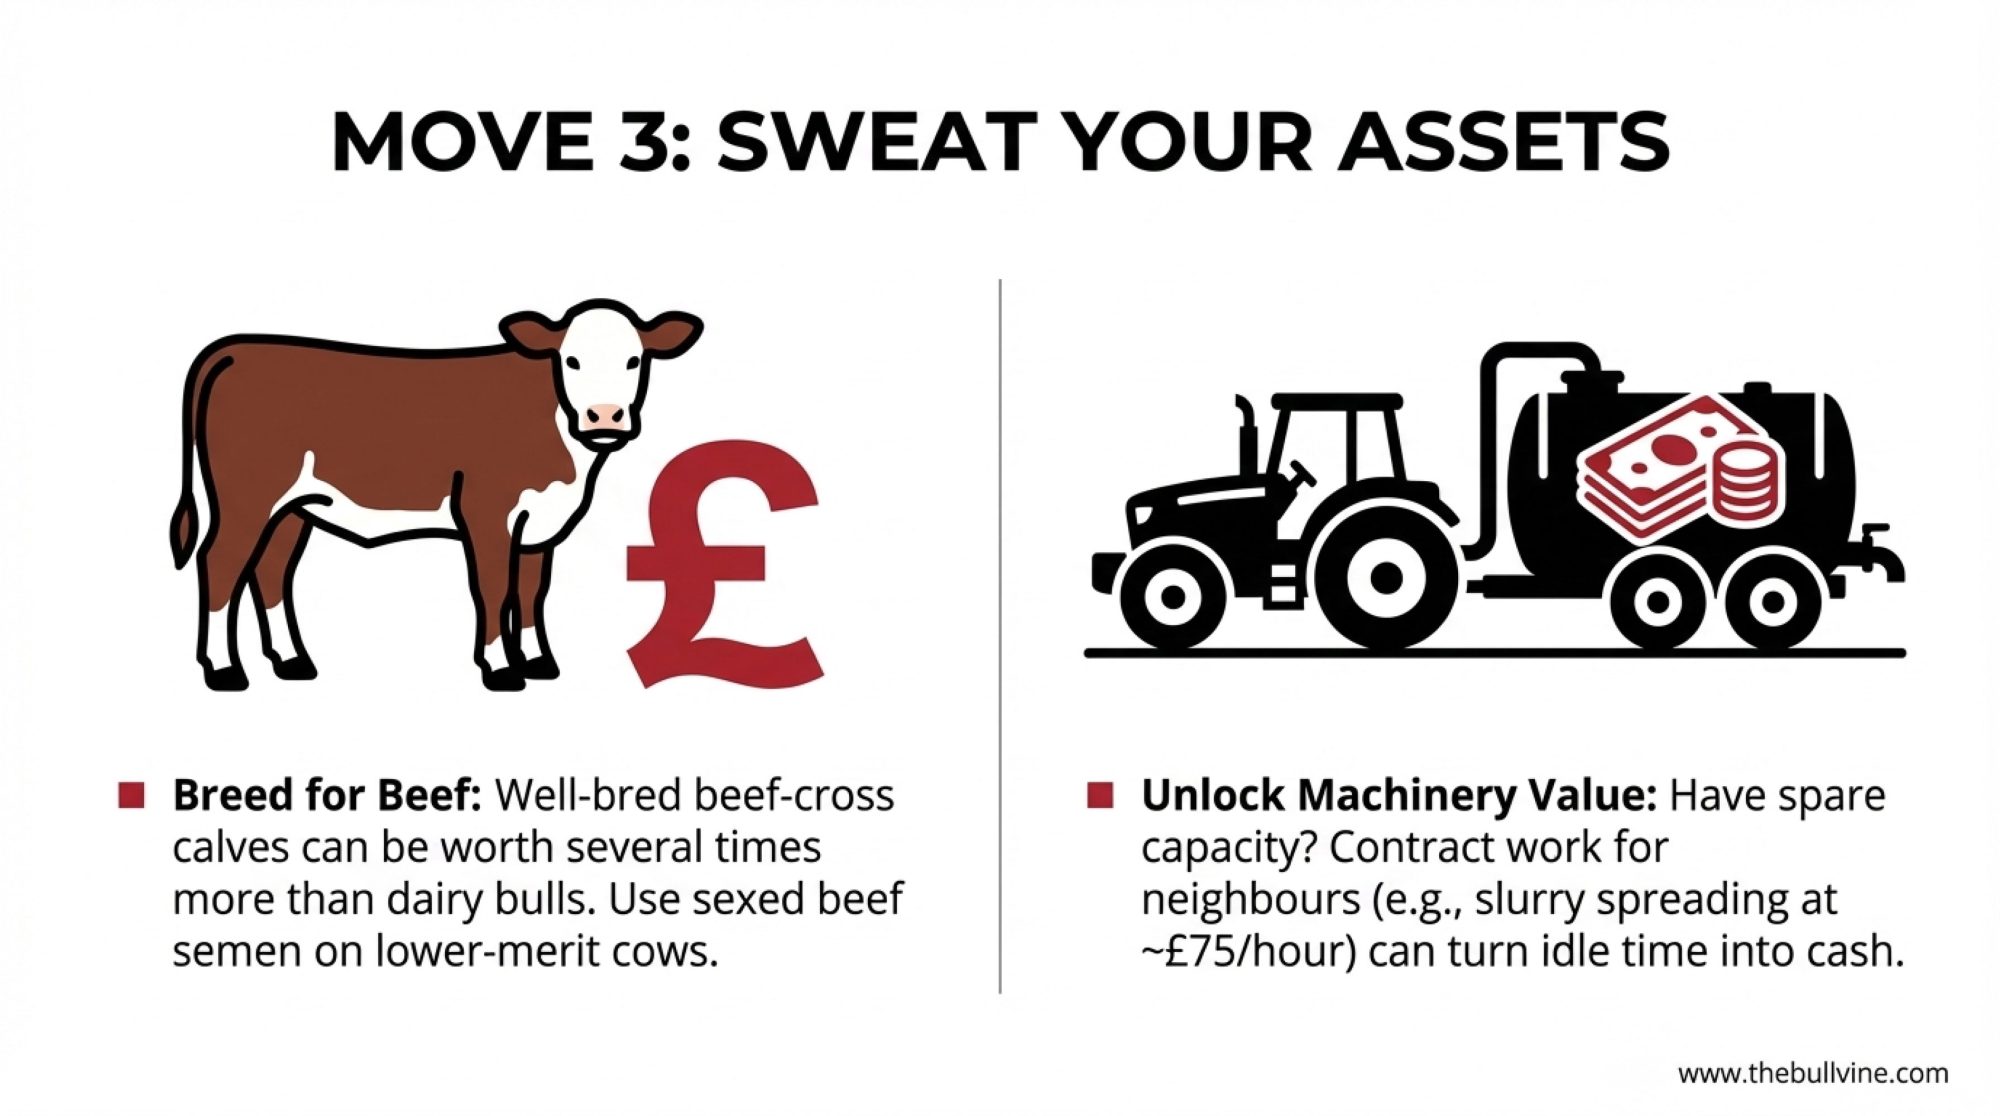
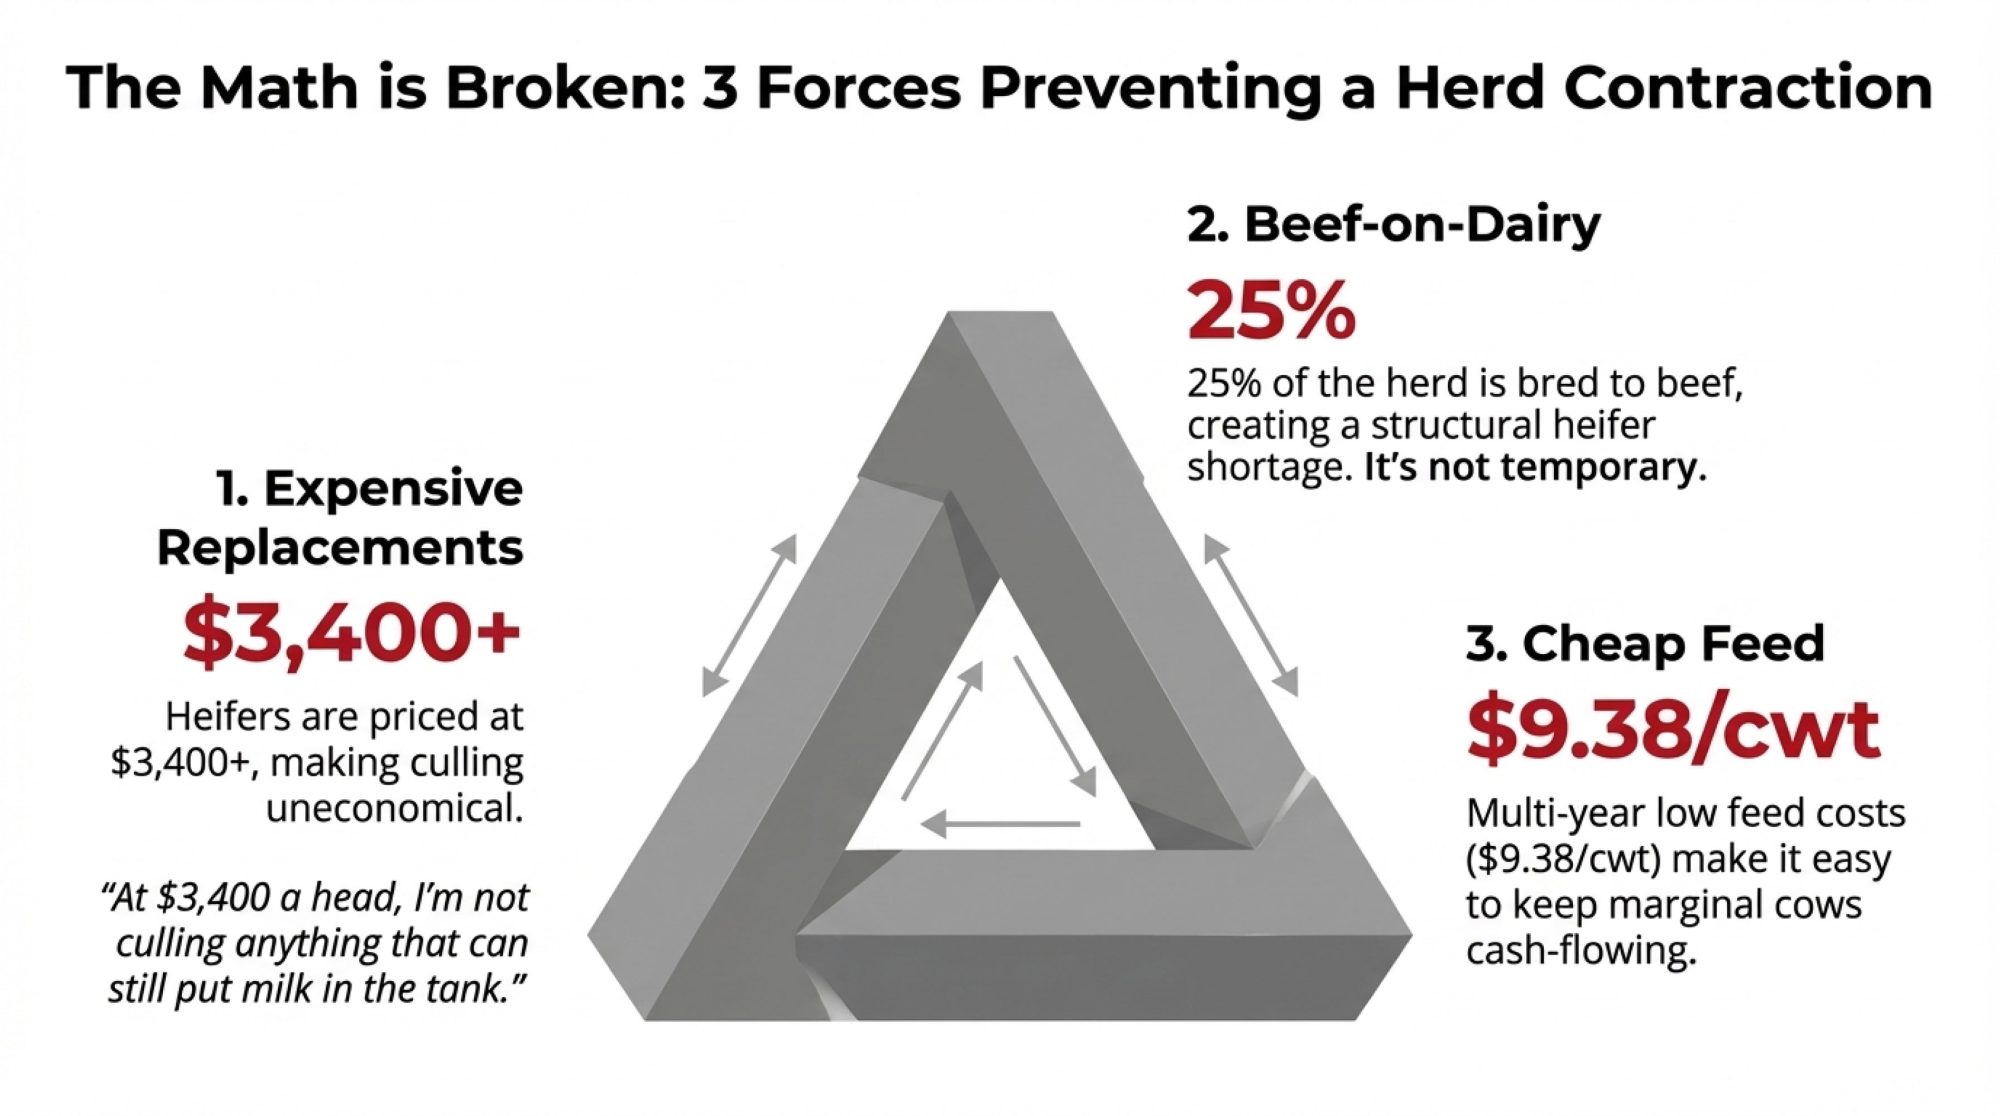
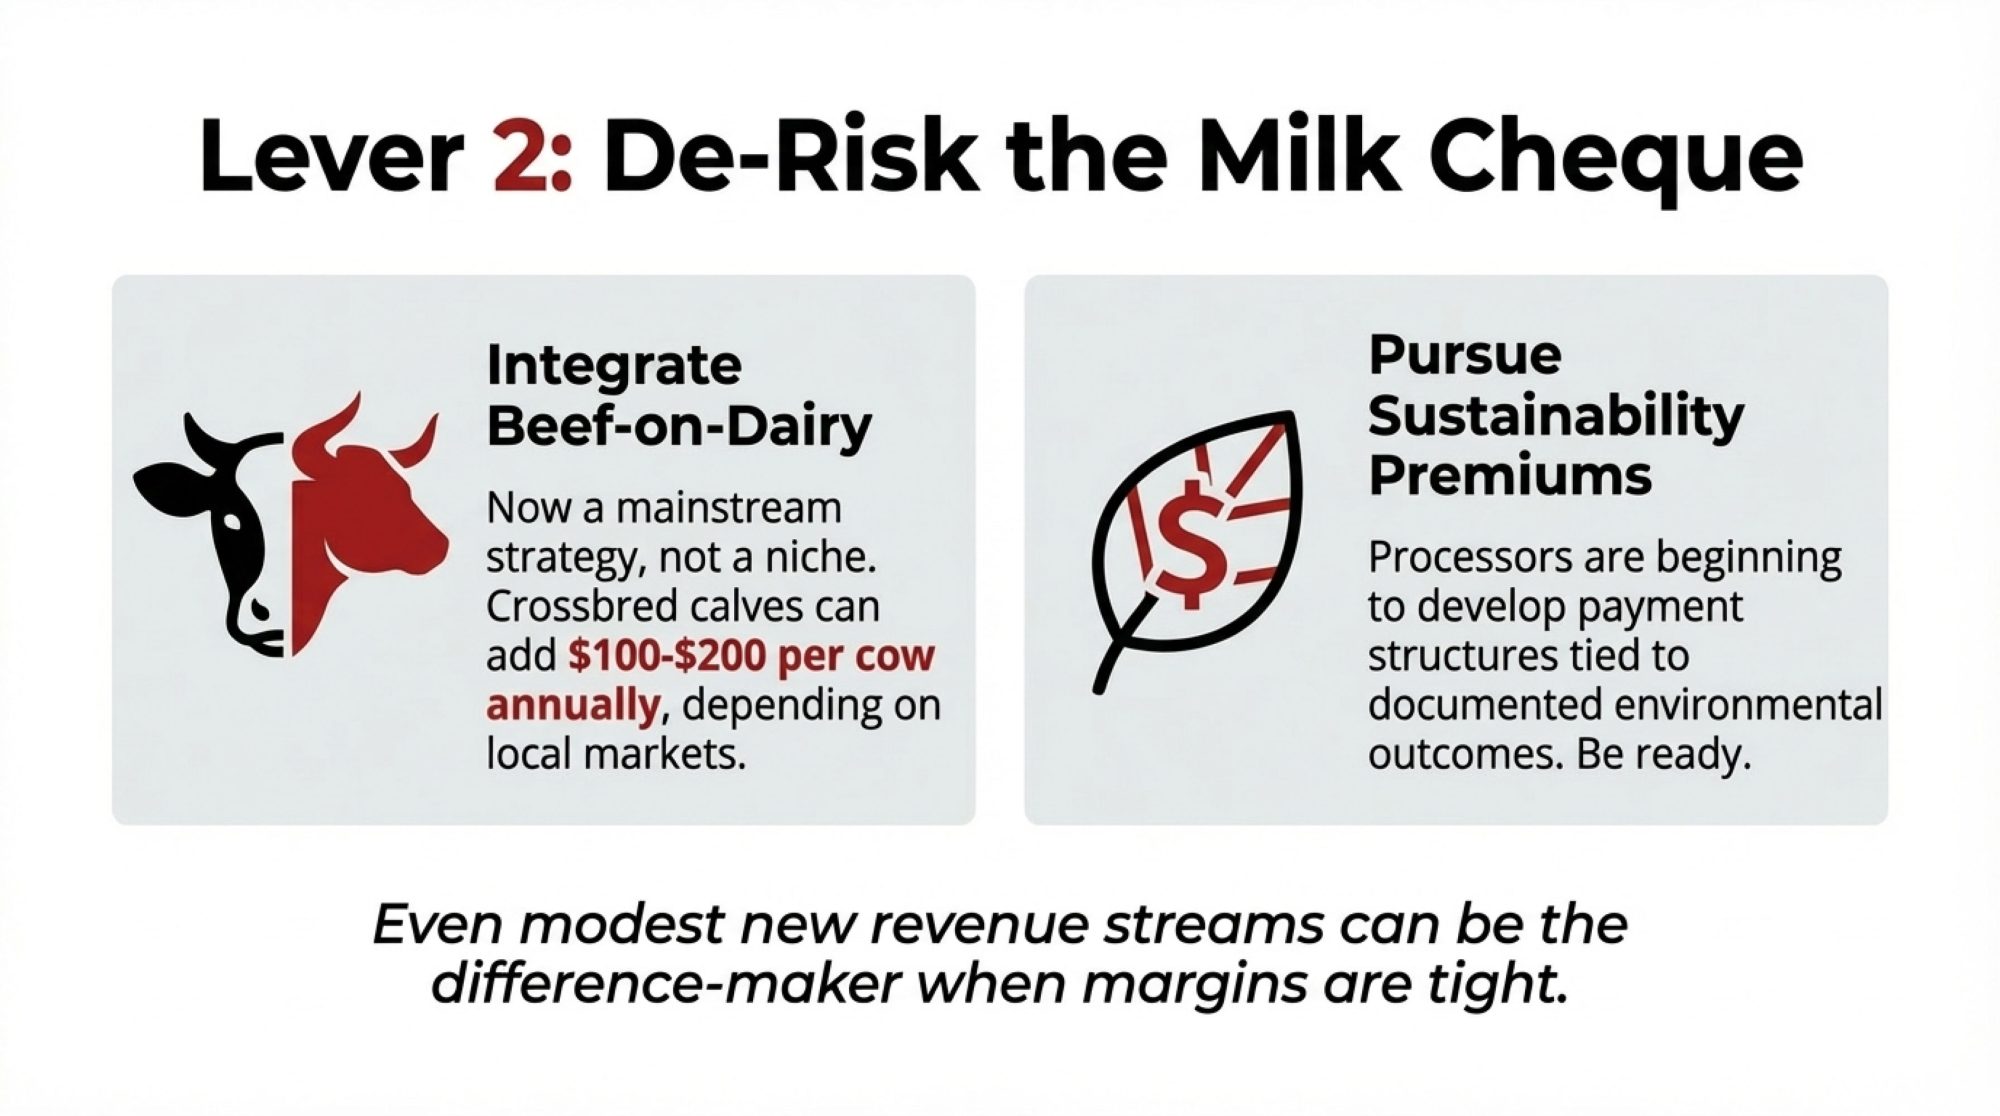
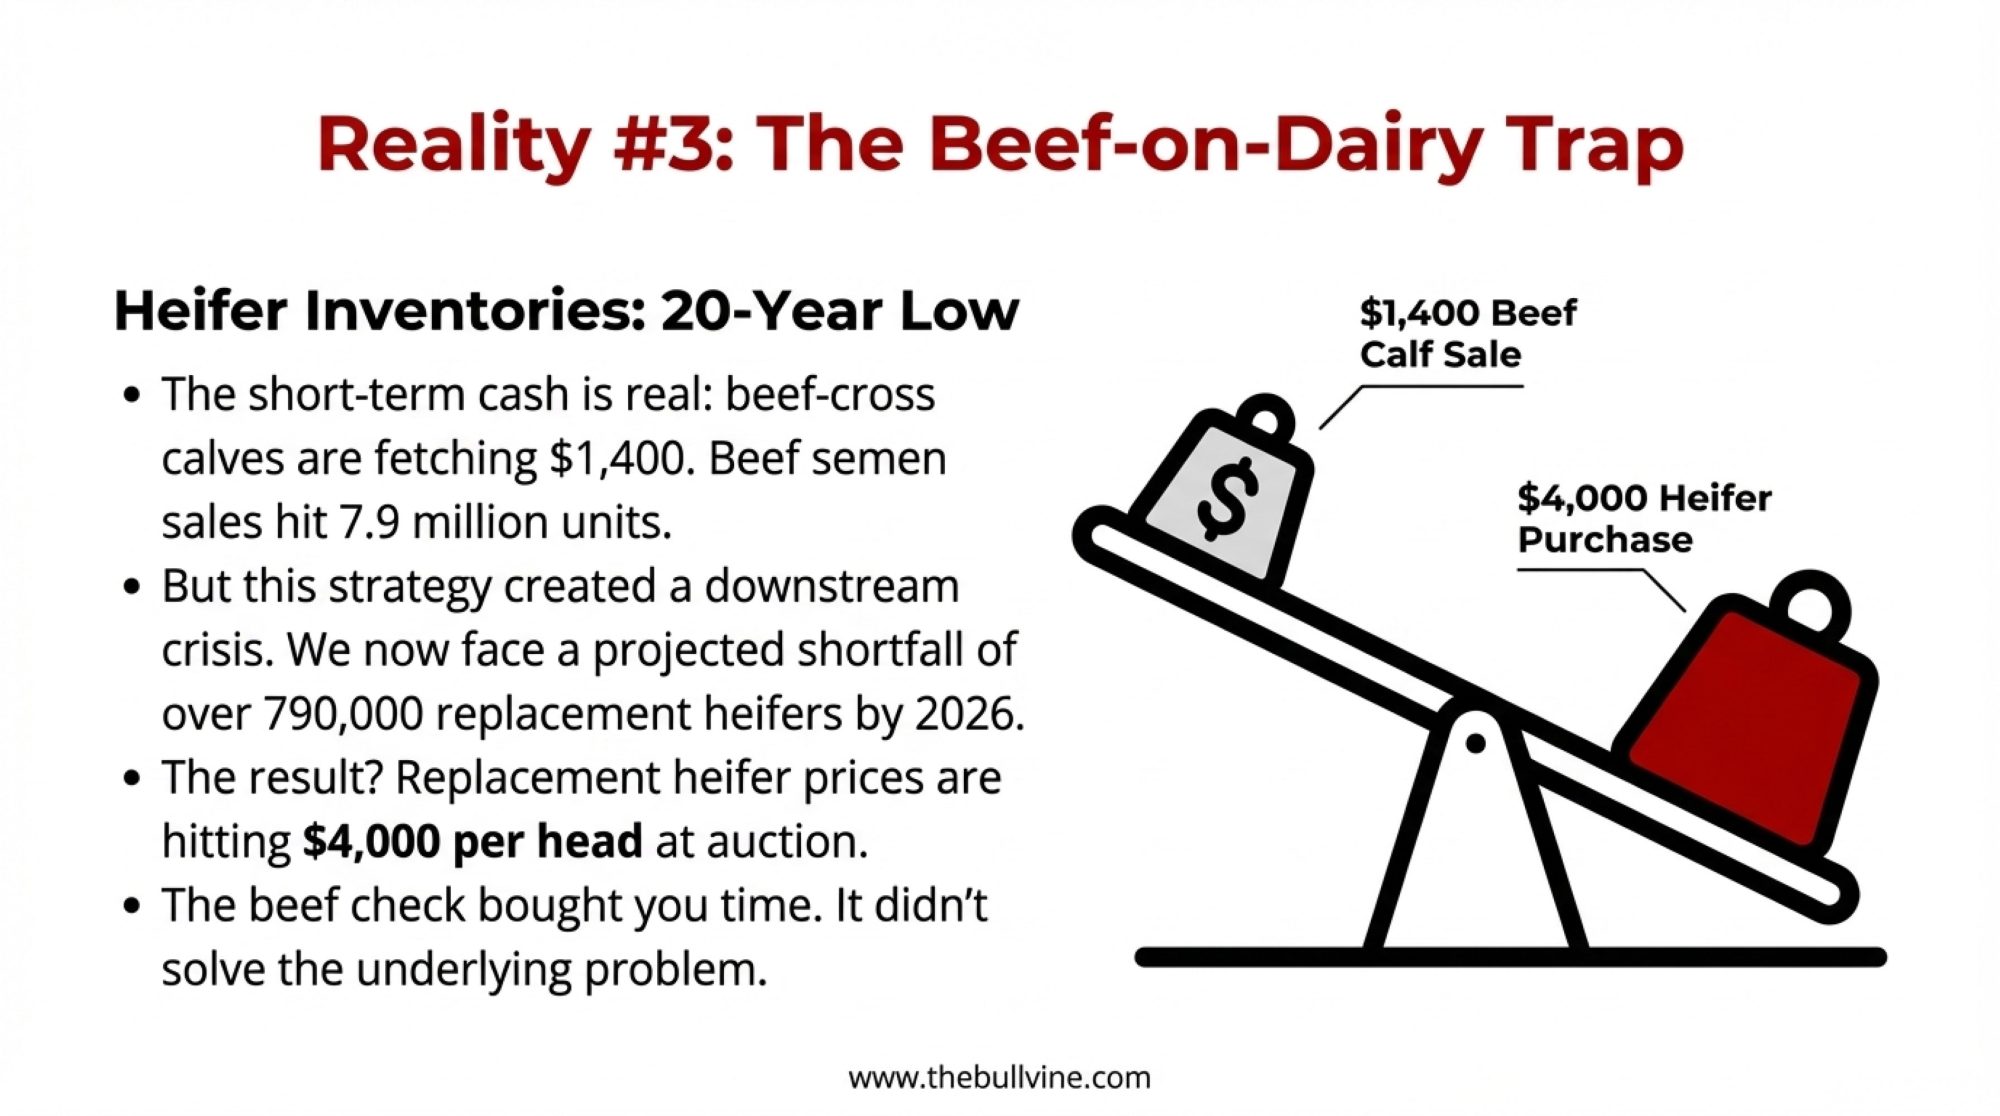
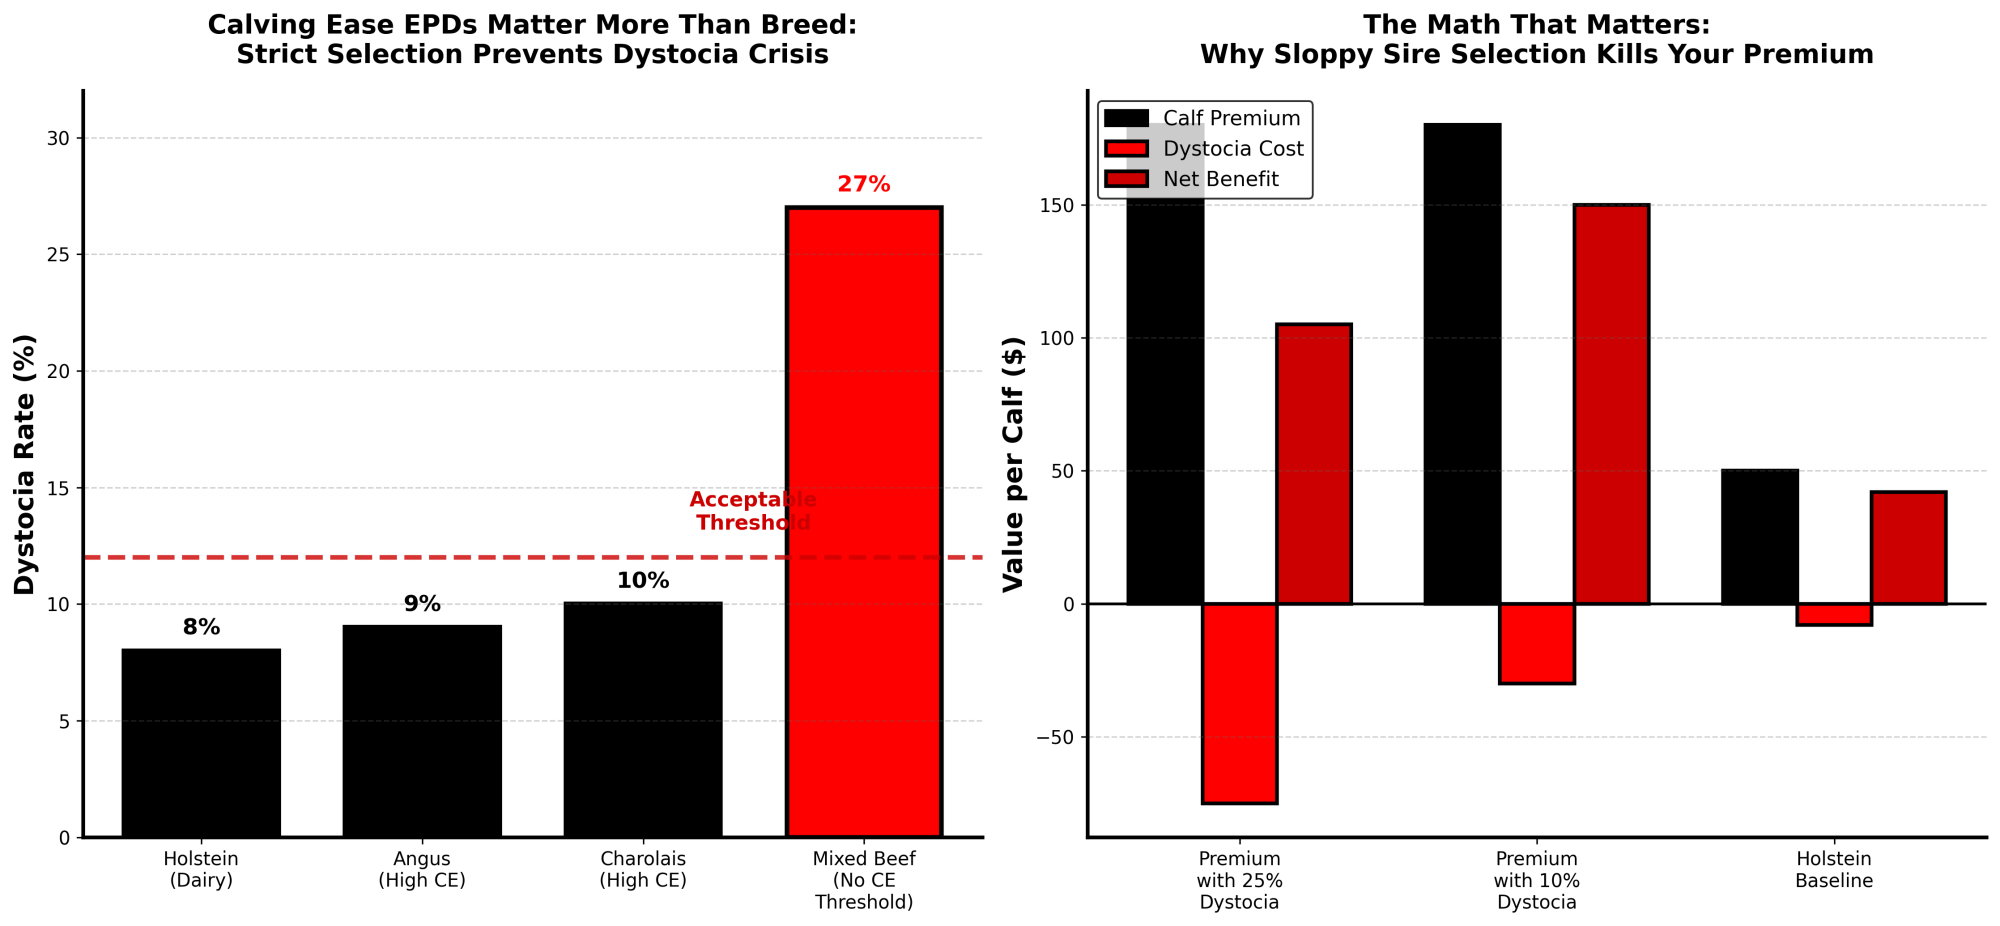
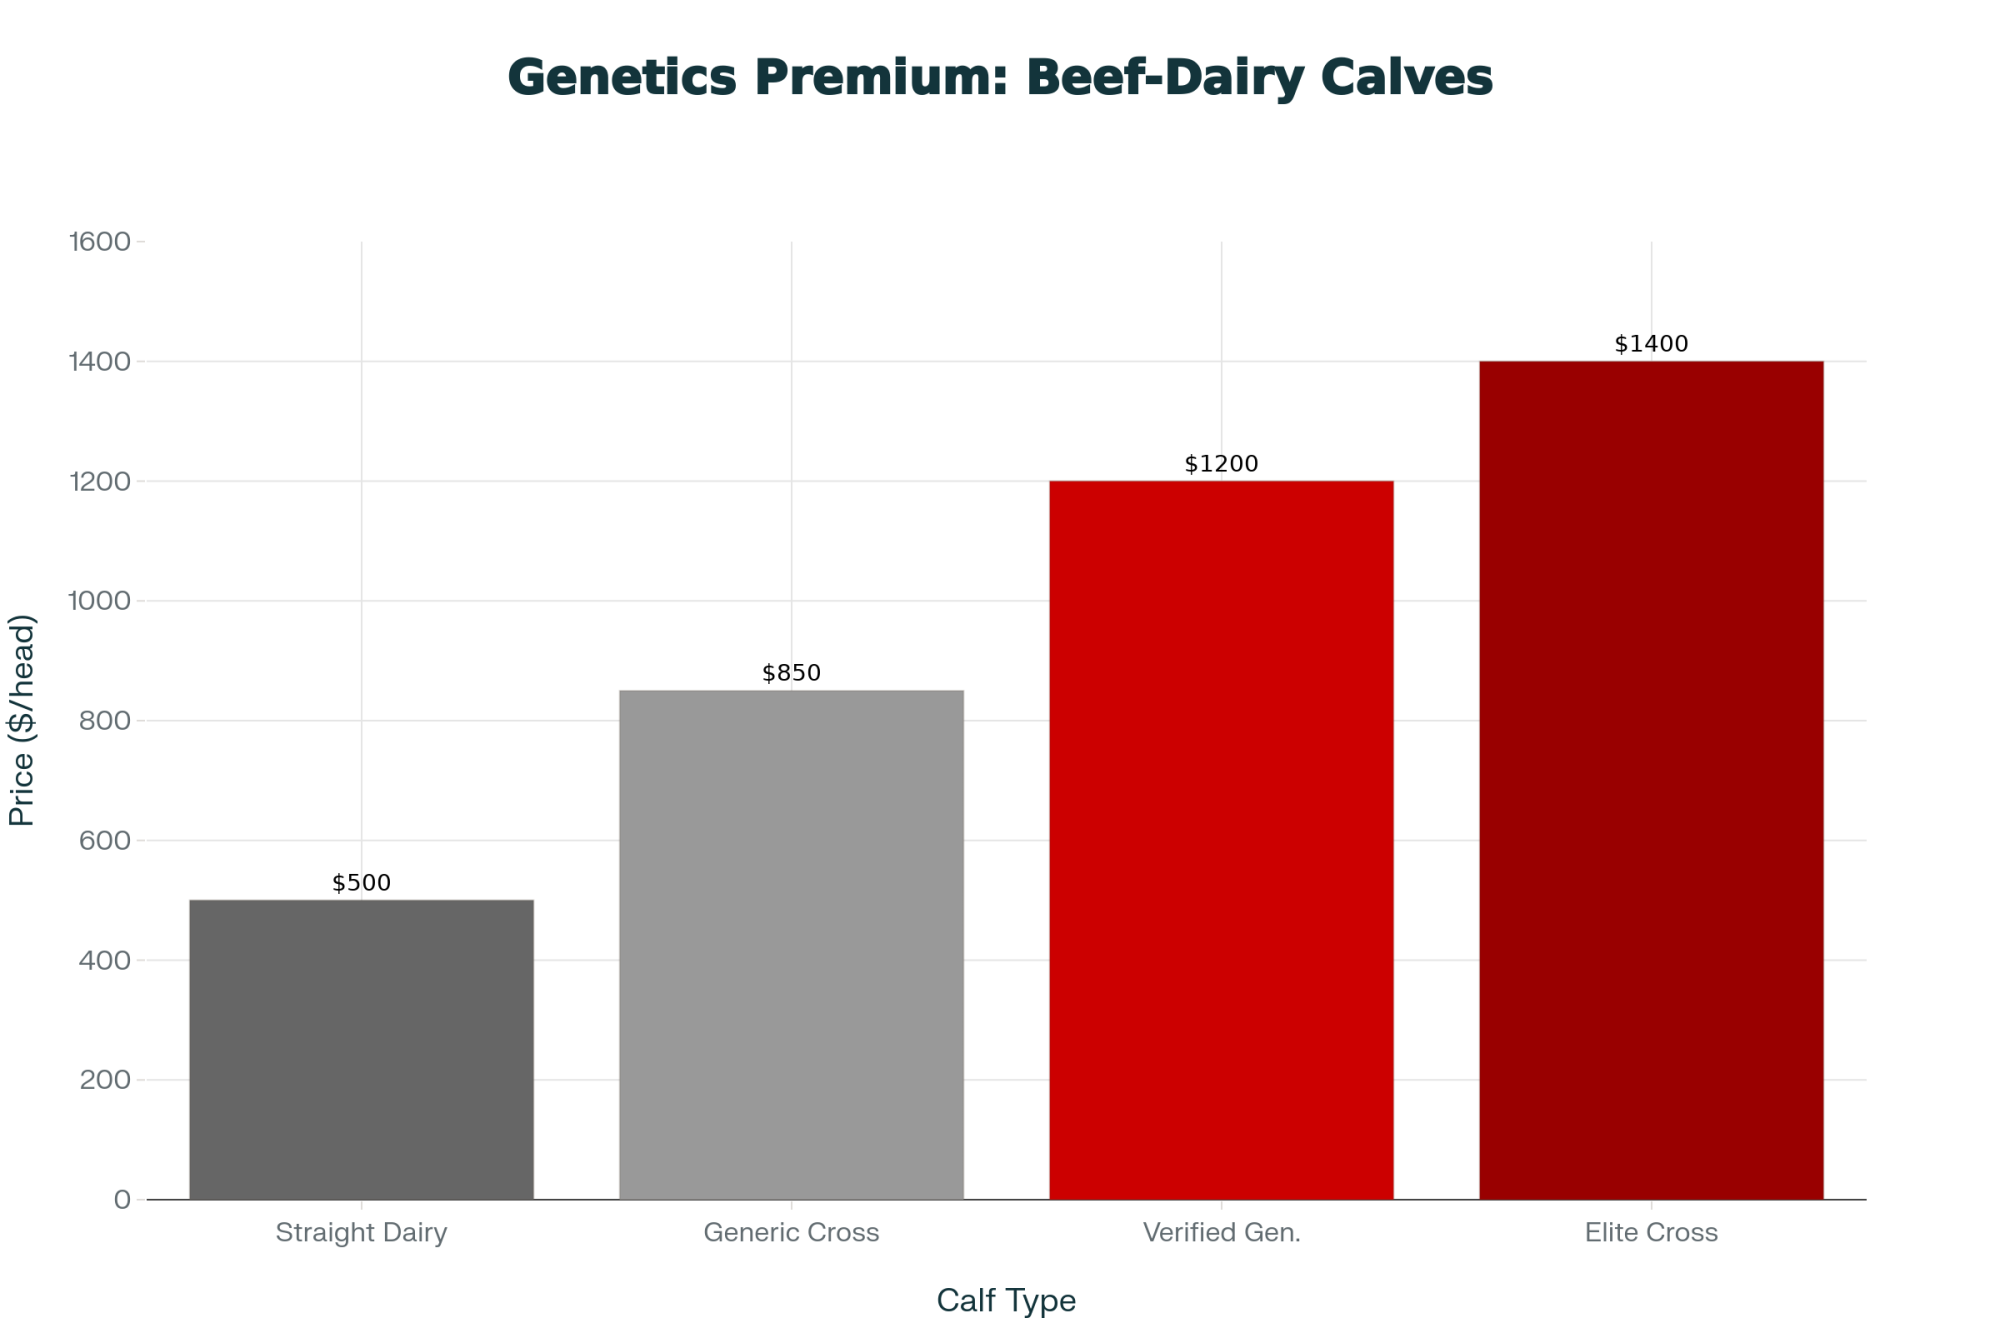
Beef-on-dairy programs have created new revenue streams that many of us didn’t have five years ago. Breeding 20-30% of the herd to beef bulls—Angus, Charolais, or Limousin, depending on your market—produces crossbred calves selling at $350-400 versus $80-100 for dairy bull calves. That’s meaningful additional revenue for operations with solid reproductive management.
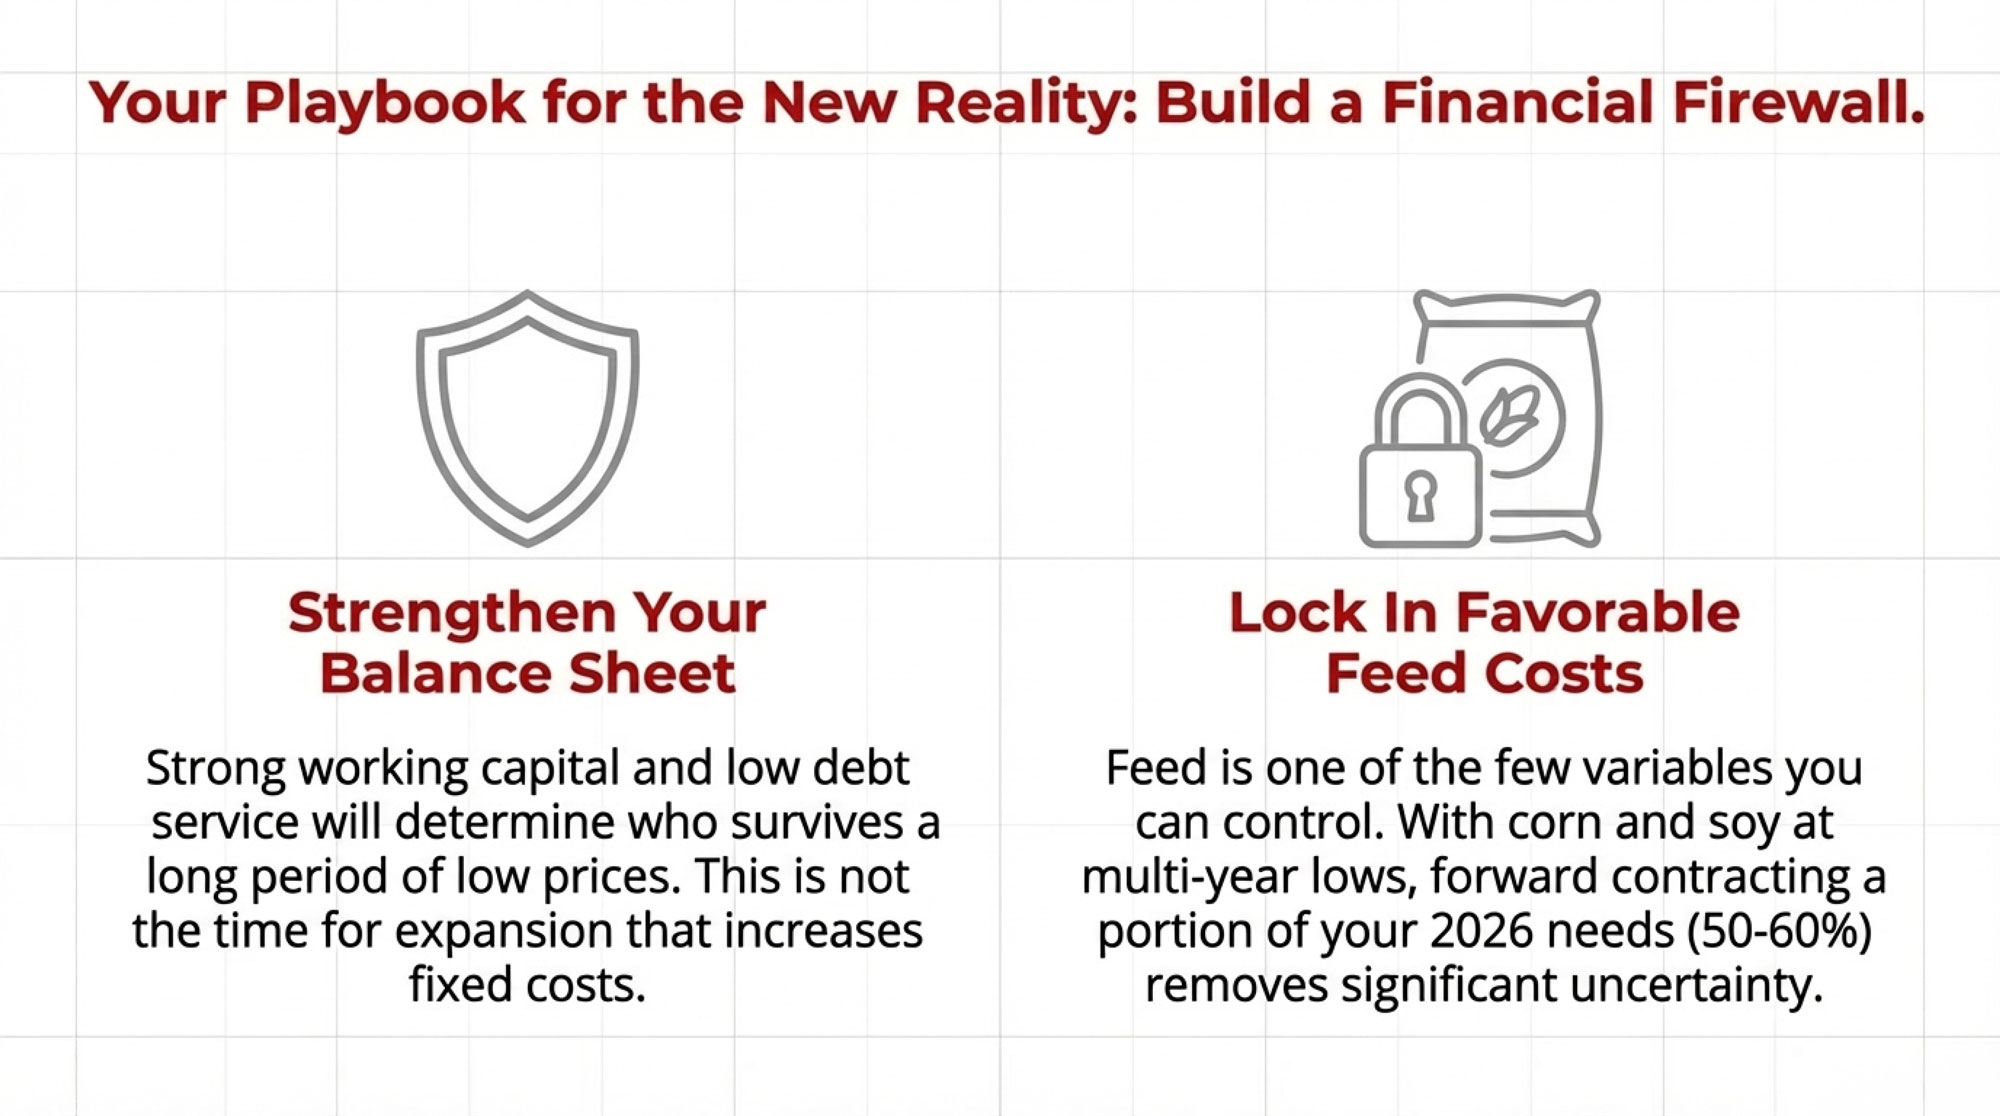
This path suits operations with manageable debt, adequate working capital, and a genuine interest in data-driven management.
💡 BULLVINE INSIDER TIP: Efficiency Optimization
Based on what producers are actually seeing in 2025, here’s where the fastest returns are coming from:
What’s working right now:
- AI-powered ration optimization software — Early adopters are reporting 5-10% feed cost reduction with ROI within 7-8 months, according to Lactanet’s herd analytics data. On a 500-cow dairy, that’s $50,000-100,000 annually to your bottom line.
- Integrated health monitoring (not standalone sensors) — Systems that combine rumination, activity, and temperature data outperform single-metric monitors. Look for platforms that integrate with your existing herd management software rather than creating another data silo.
- Smart calf monitoring — Operations using automated calf health systems are seeing significant reductions in mortality. One Dutch dairy documented a 19% improvement in calf survival within a single lactation cycle, with wearable sensors detecting illness 12+ hours before visual symptoms appeared. Payback typically runs under 12 months.
What to skip for now: Standalone activity monitors without integration capability. False-positive rates often create more work than they’re worth.
Path Two: Scale Expansion
Some operations have the capital position and management depth to expand to the scales preferred by new processing facilities. And I want to be honest about what this actually requires.
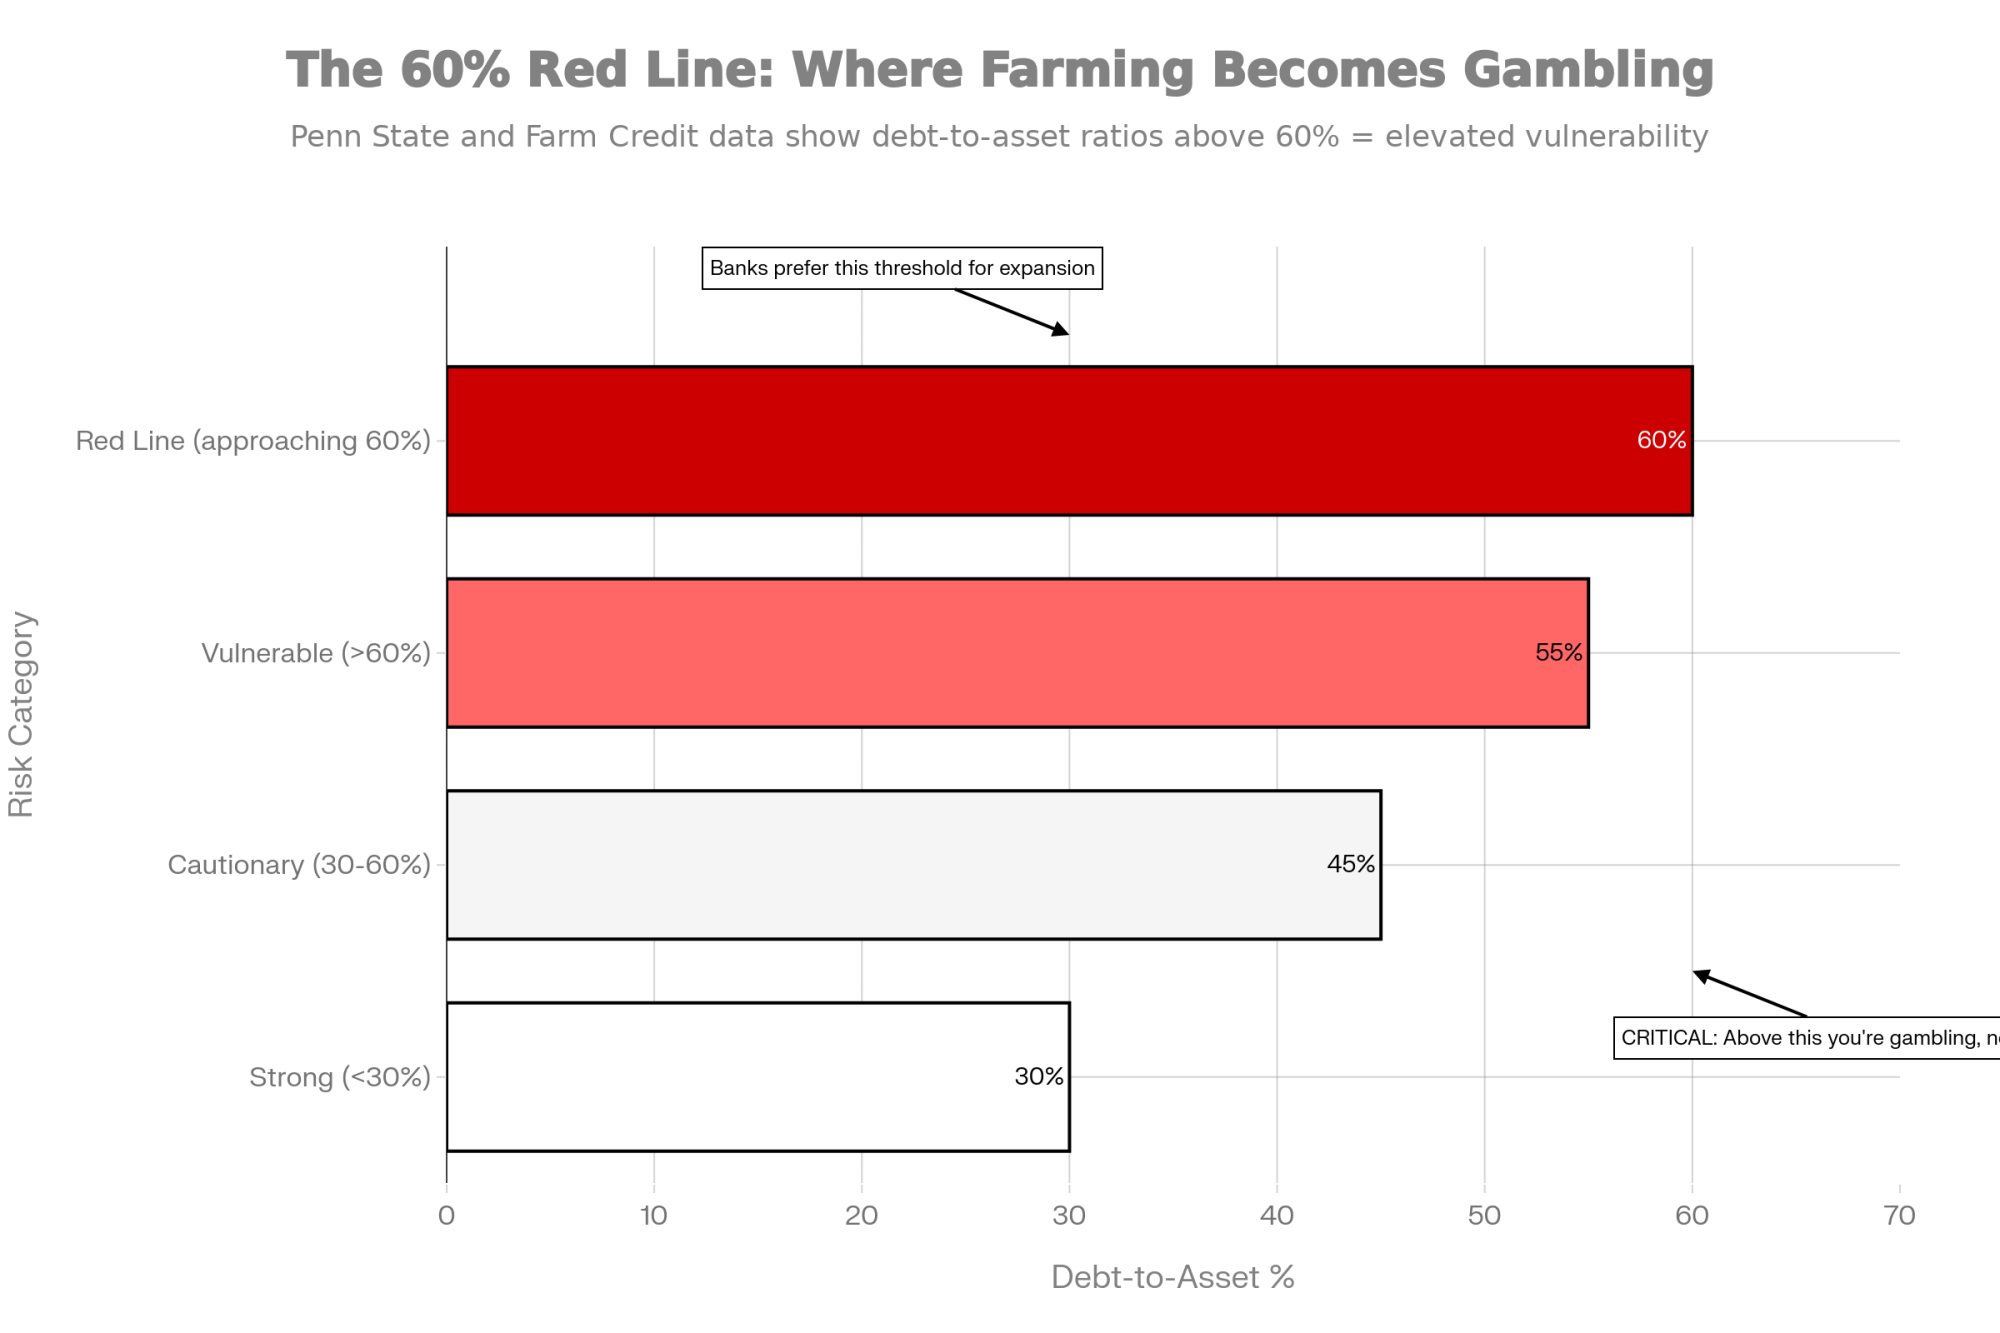
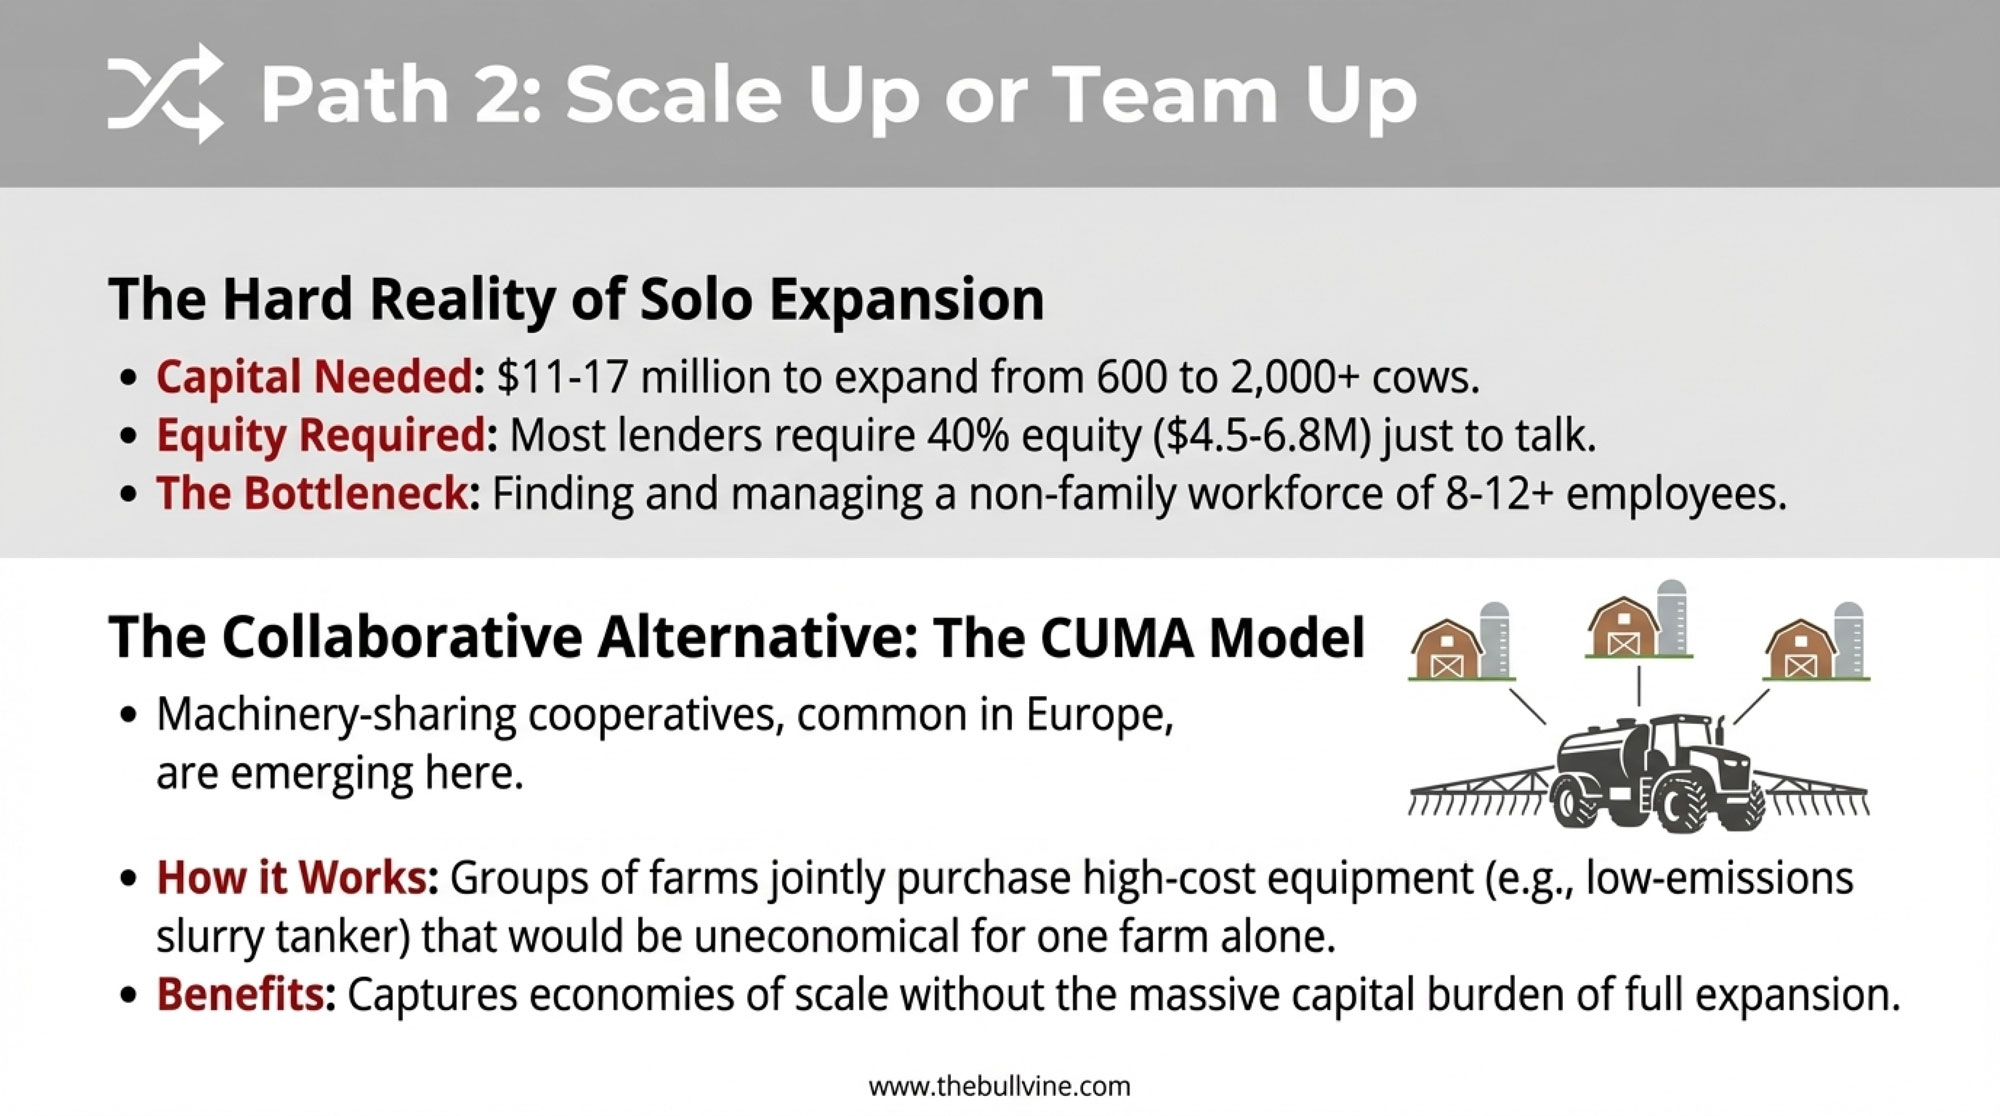
The economics are demanding. Expansion from 600 to 2,000+ cows typically requires $8,000-12,000 per cow in capital investment. For a 1,400-cow expansion, that’s $11-17 million. Most lenders currently require around 40% equity for dairy expansion—meaning $4.5-6.8 million just to reach the financing table.
When the numbers work, larger operations do show profitability advantages. University of Minnesota FINBIN data consistently shows per-cow returns increase with scale, all else equal.
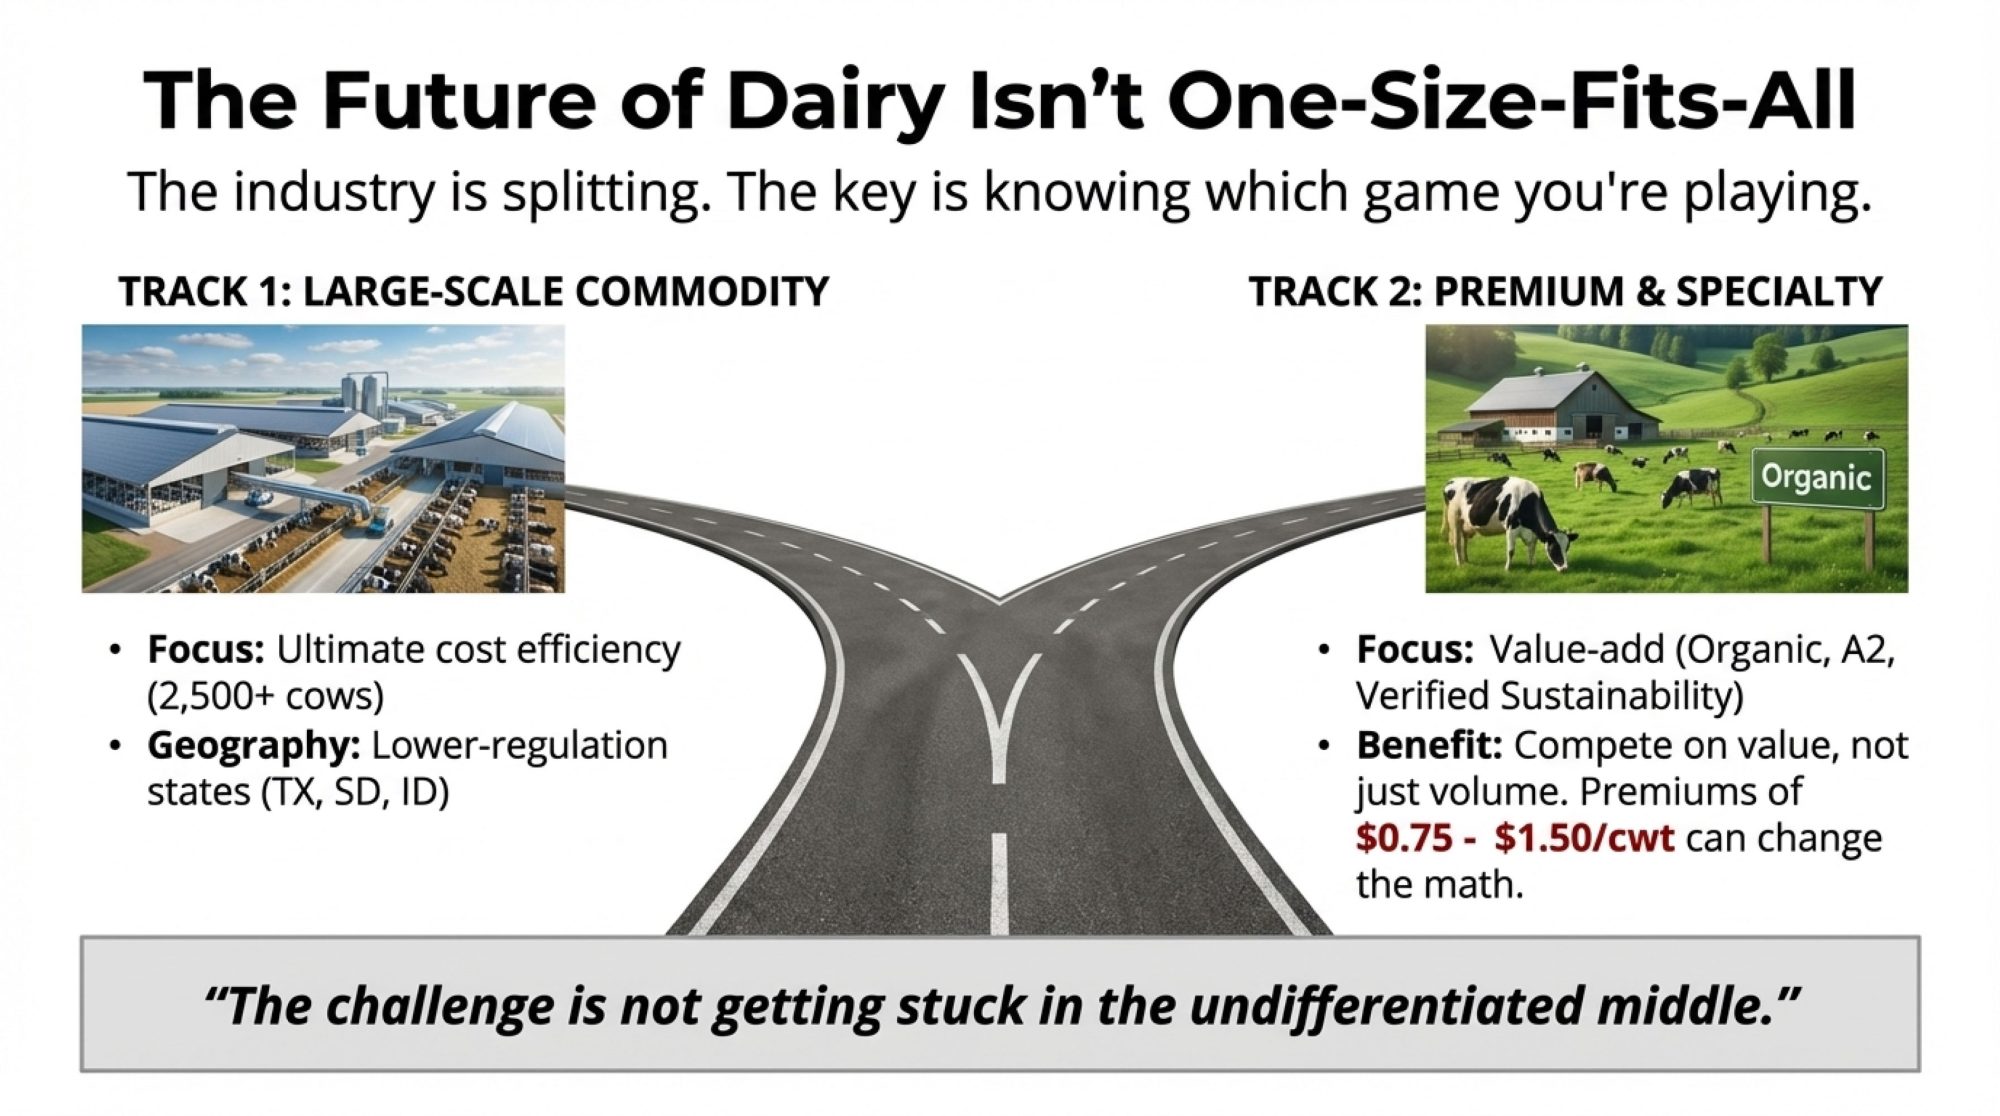
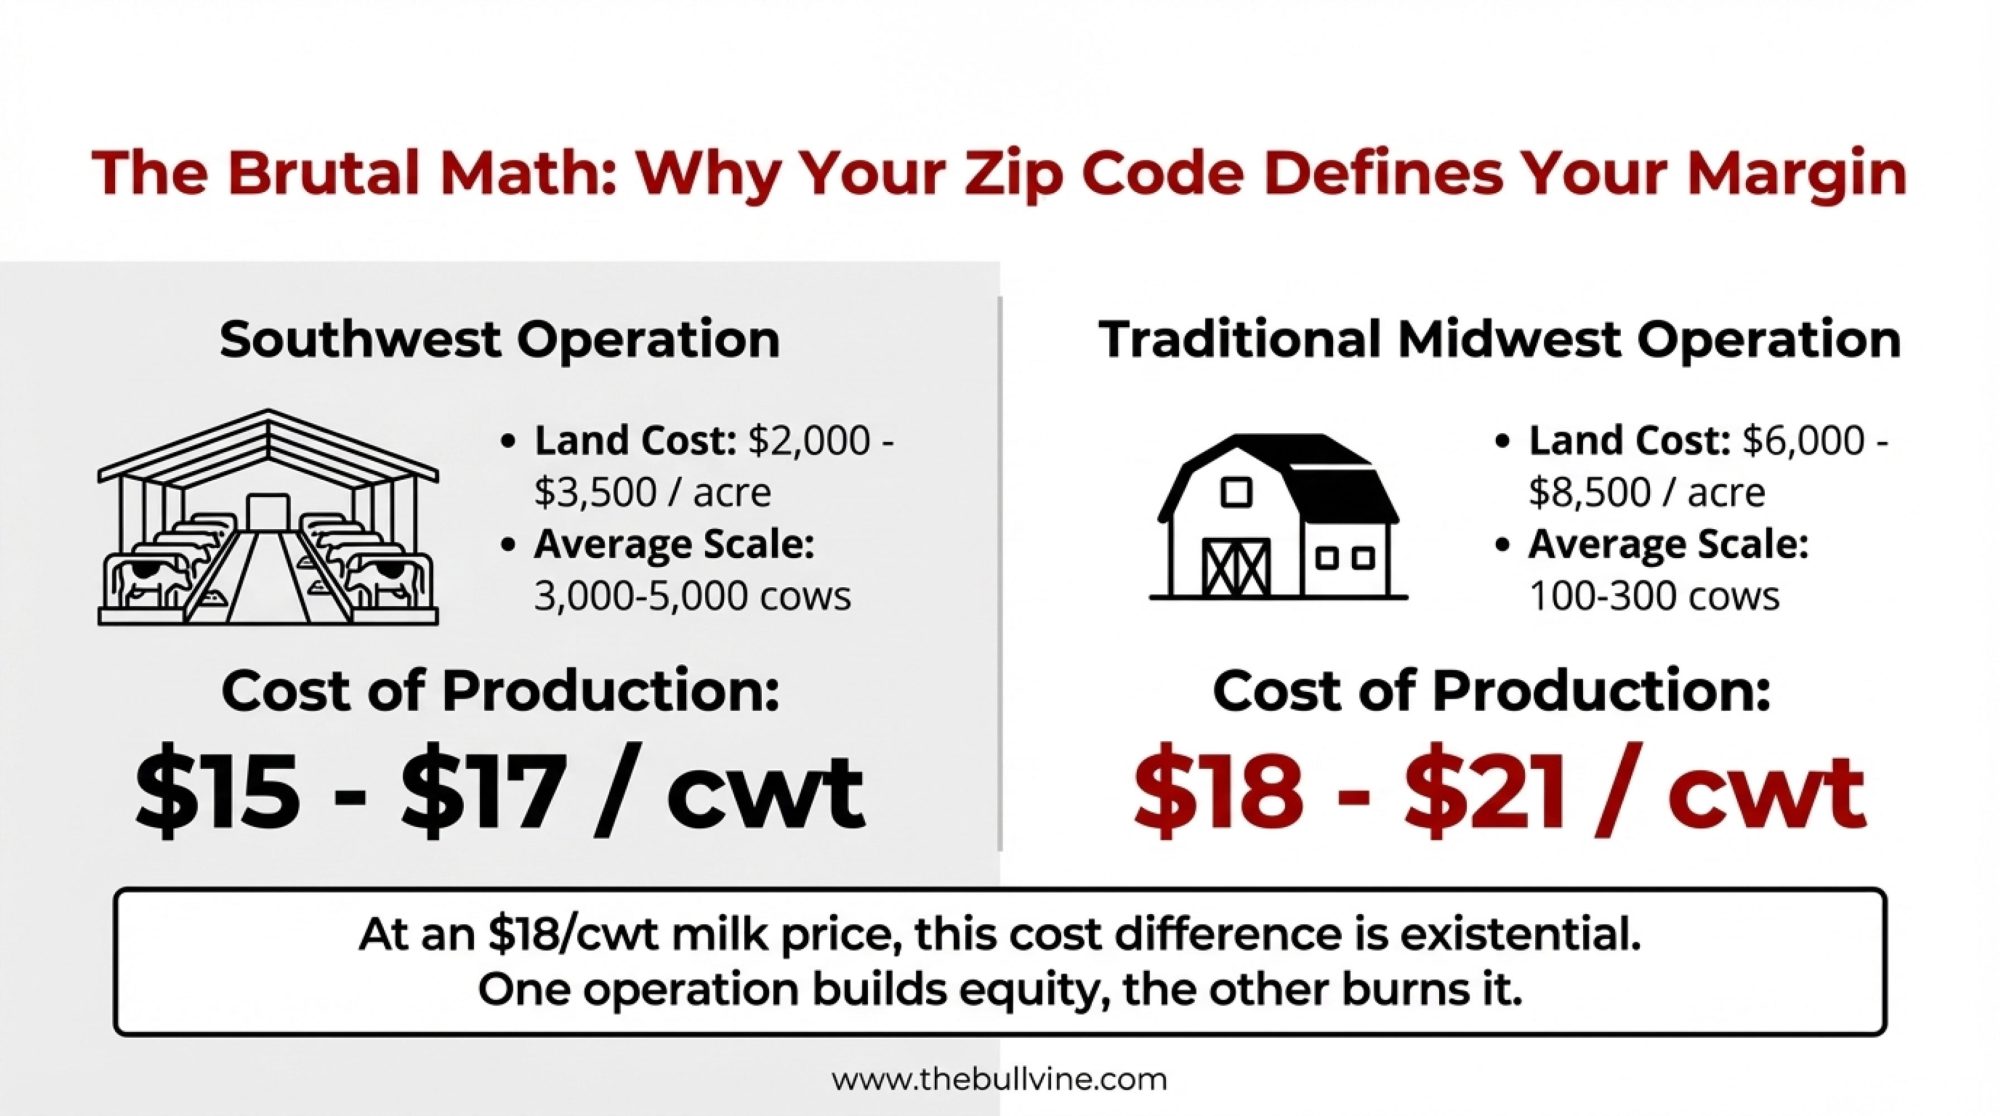
But all else is rarely equal. Labor presents a genuine challenge—a 2,000-cow operation requires different workforce management than a family operation, and finding reliable dairy labor has become difficult in many regions. Geographic factors matter too: Idaho and parts of the Southwest still see active development, while the Upper Midwest and Northeast face higher land costs and tighter environmental constraints.
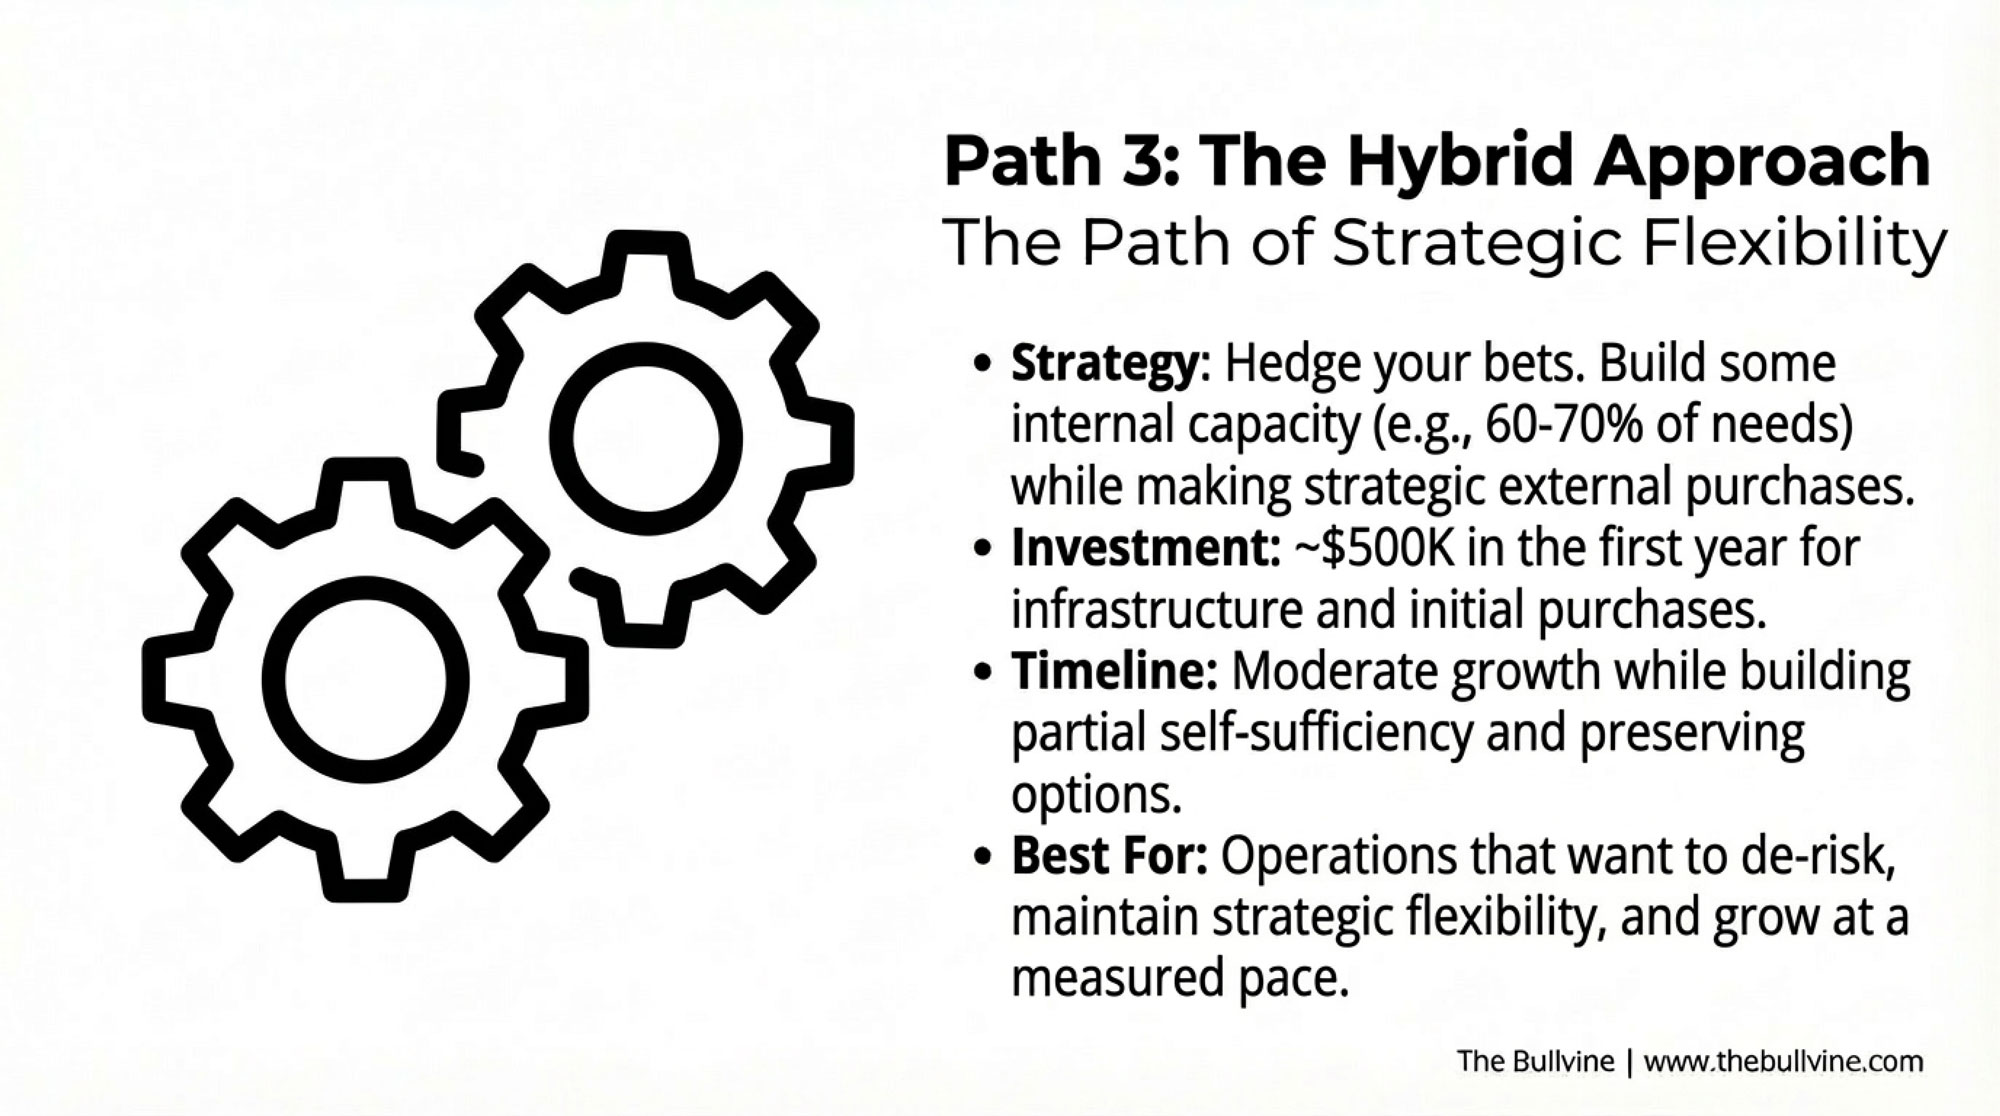
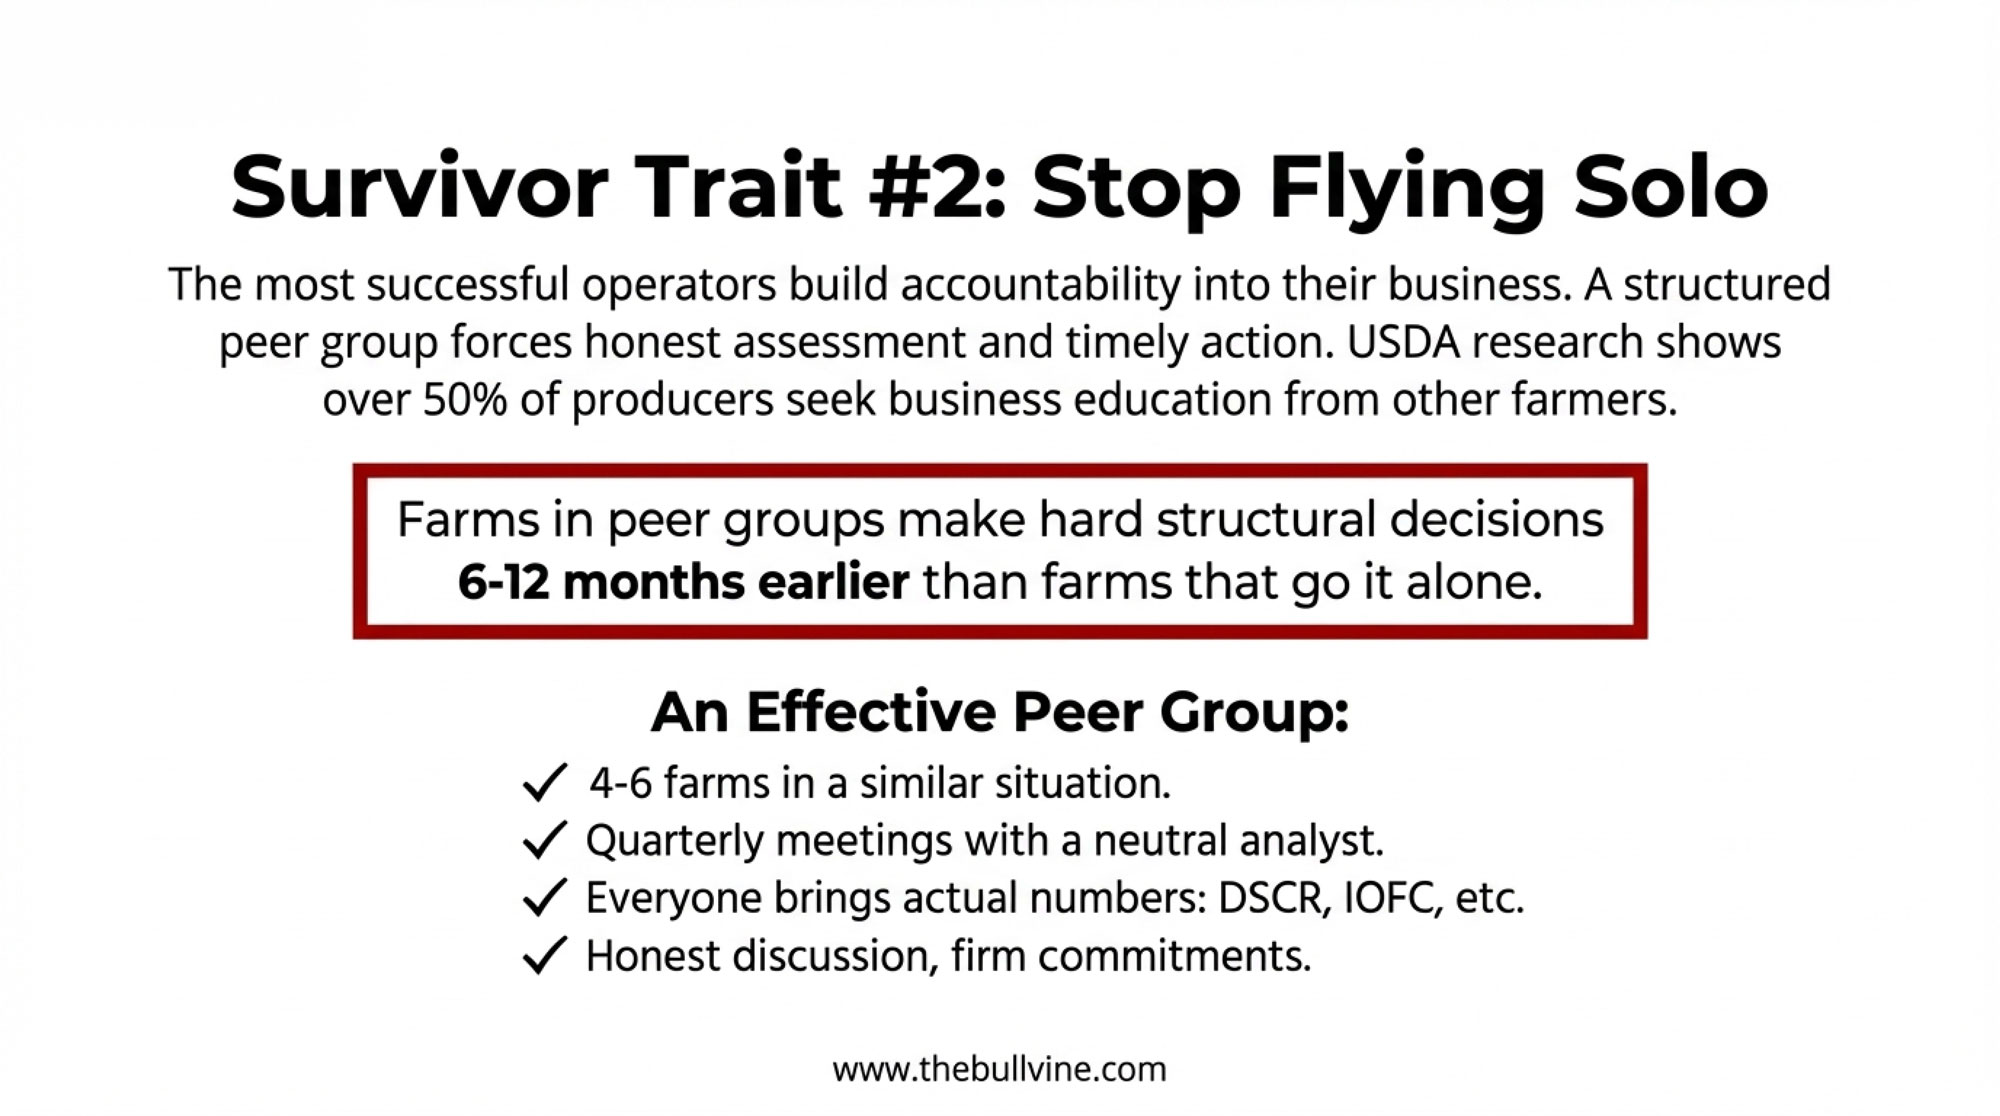
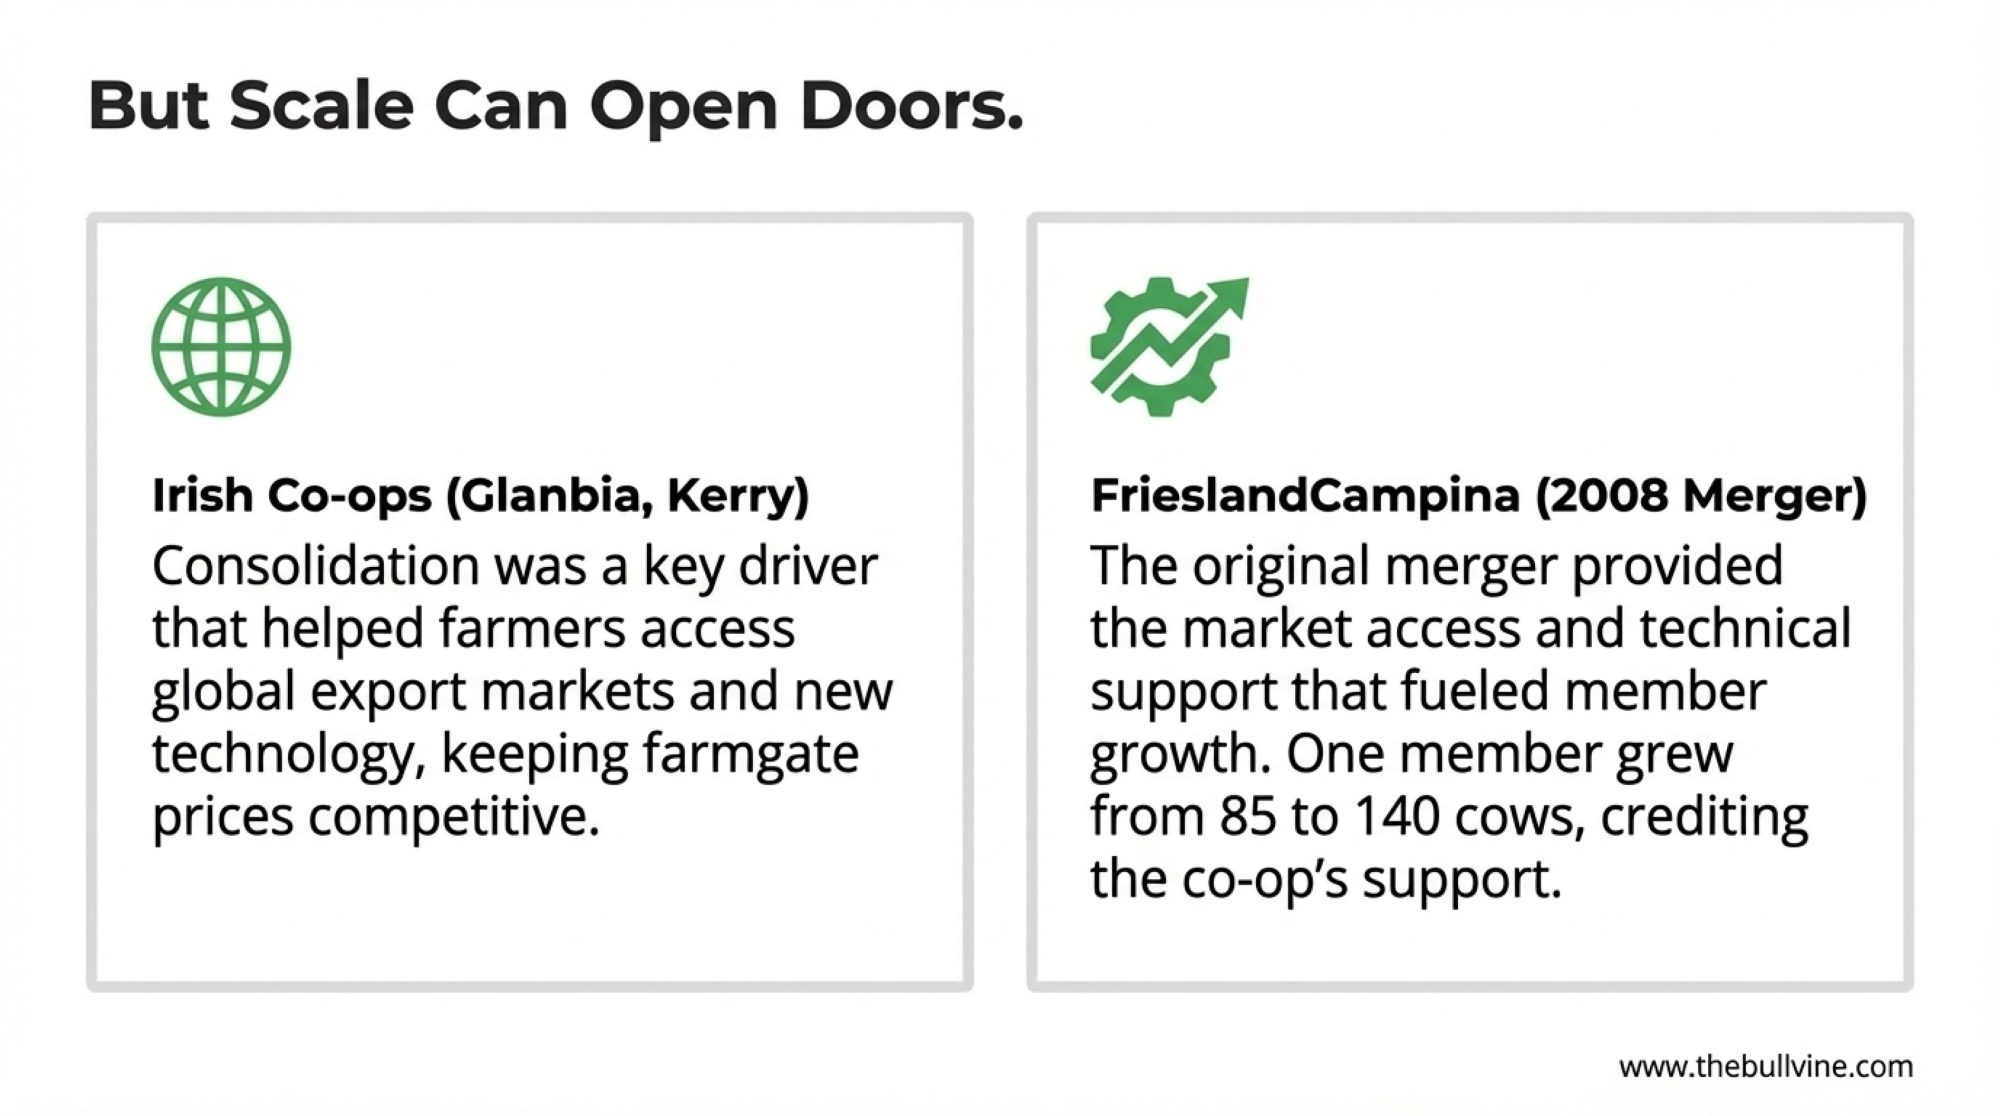
Here’s something worth considering, though: Collaborative scaling offers some of the benefits of scale without the full capital burden. Machinery-sharing cooperatives—common in Europe through what’s called the CUMA model—are now emerging in Ireland and parts of North America.
Actually, Ireland’s first farm machinery sharing cooperative was formed by members of the Kilnamartyra dairy discussion group in West Cork, according to Teagasc (Ireland’s agricultural authority). Their first joint purchase was a low-emissions slurry tanker—equipment that would’ve been uneconomical for individual operations but made sense when shared across several farms.
The CUMA model is widely used in France, where up to 50% of farmers are members of some type of machinery cooperative. Beyond equipment, some operations here are exploring multi-family partnerships or formal alliances for input purchasing, young stock raising, or even shared labor pools. Wisconsin’s dairy discussion groups and organizations, such as the Dairy Business Association, have facilitated some of these arrangements.
It’s not a full-scale expansion, but it captures some economies without the $11-17 million capital requirement. Worth exploring if you’re in that middle ground.
💡 BULLVINE INSIDER TIP: Scale Expansion
If you’re seriously exploring expansion or collaboration:
Before committing capital:
- Map your processor relationships first — Talk directly with your co-op or processor about their 5-year capacity plans. Some are actively seeking mid-size suppliers; others are locked into large-operation contracts. Know before you build.
- Explore collaborative structures — Contact your state’s dairy business association about machinery-sharing cooperatives or multi-family partnership models. The SARE (Sustainable Agriculture Research & Education) program has published practical guides on legal structures for equipment sharing that can help you avoid common pitfalls.
- Run the labor math honestly — a 2,000-cow operation needs 8-12 full-time employees with skill sets different from family labor. If you can’t staff it reliably, the expansion economics fall apart regardless of milk price.
Geographic reality check: Expansion feasibility varies dramatically by region. Idaho, the Texas panhandle, and parts of Kansas still have processor demand for a new large-scale supply. Upper Midwest and Northeast markets are largely committed—expansion there often requires displacing existing supply relationships, which is a different game entirely.
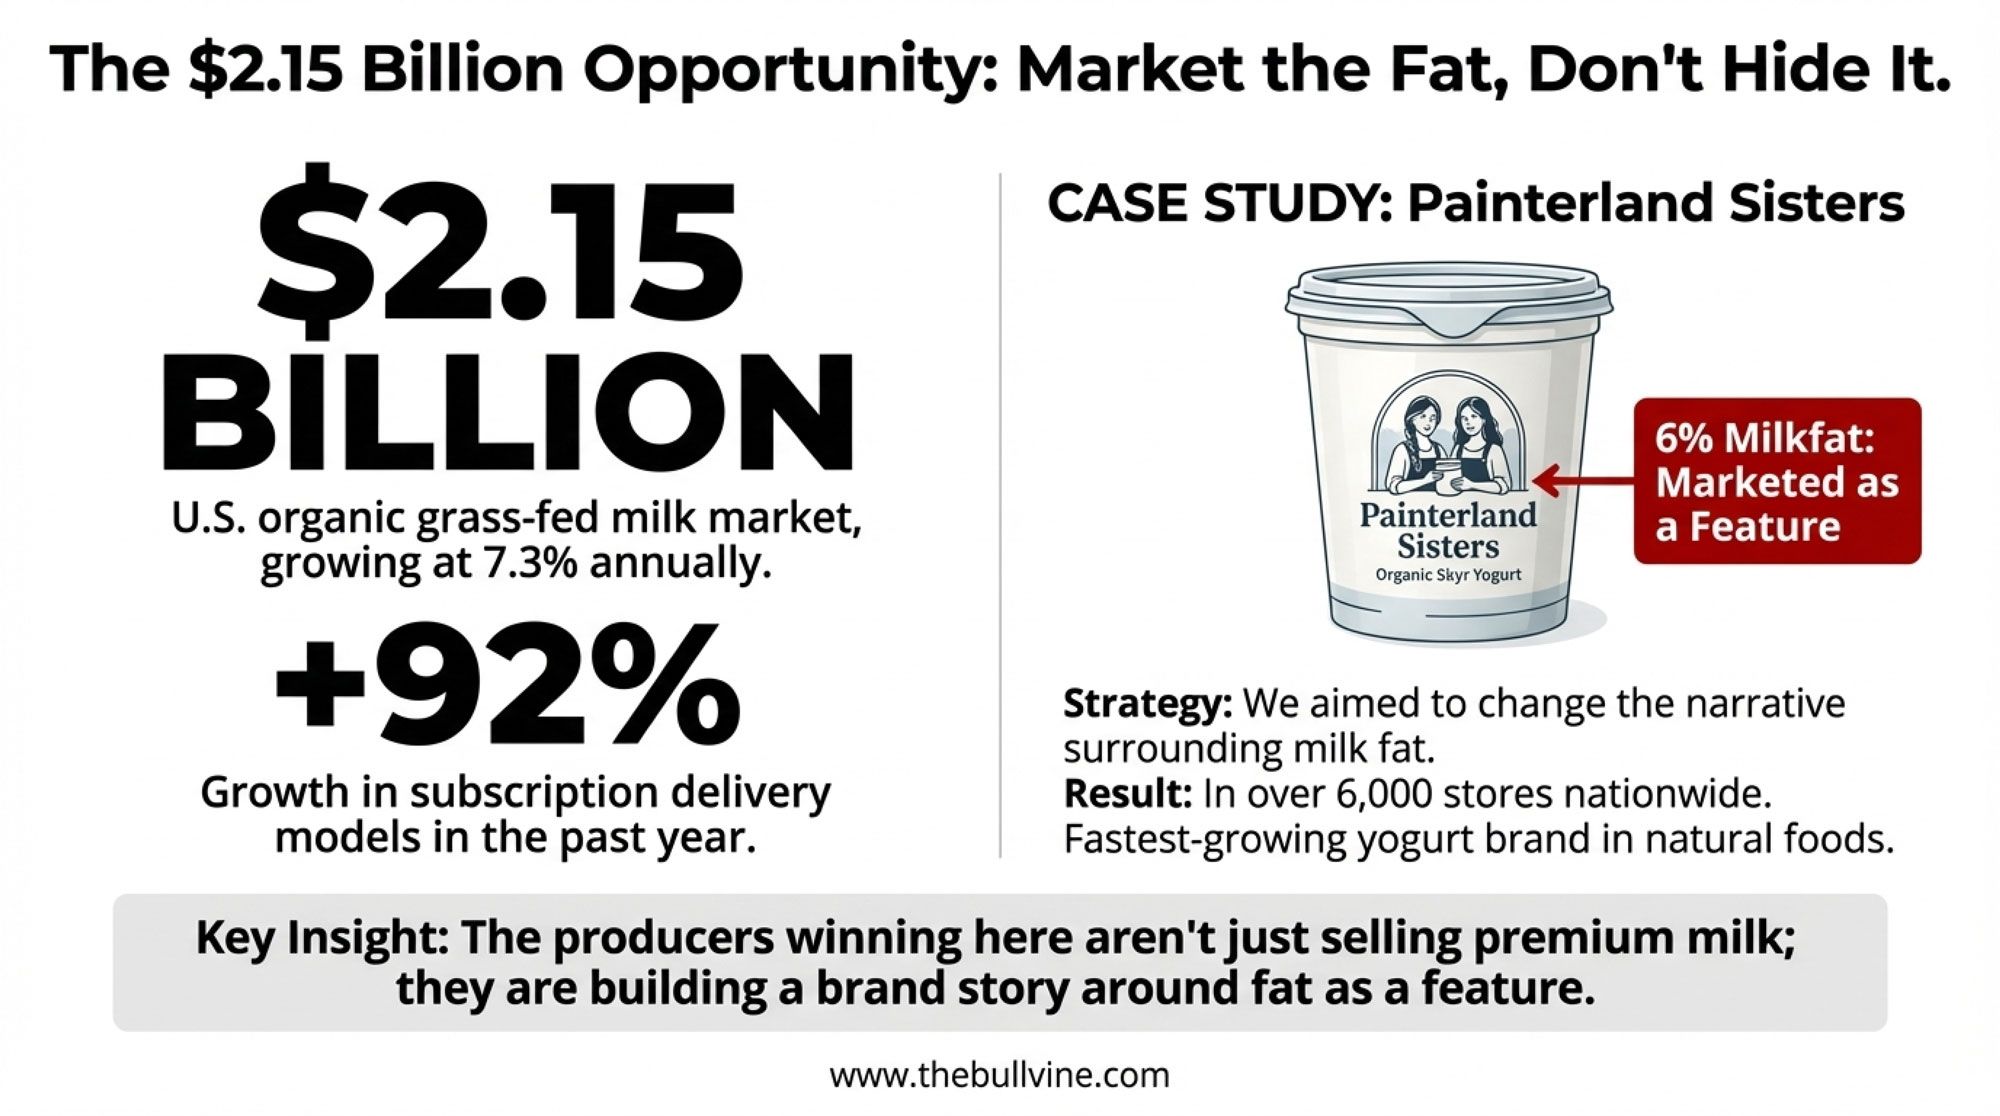
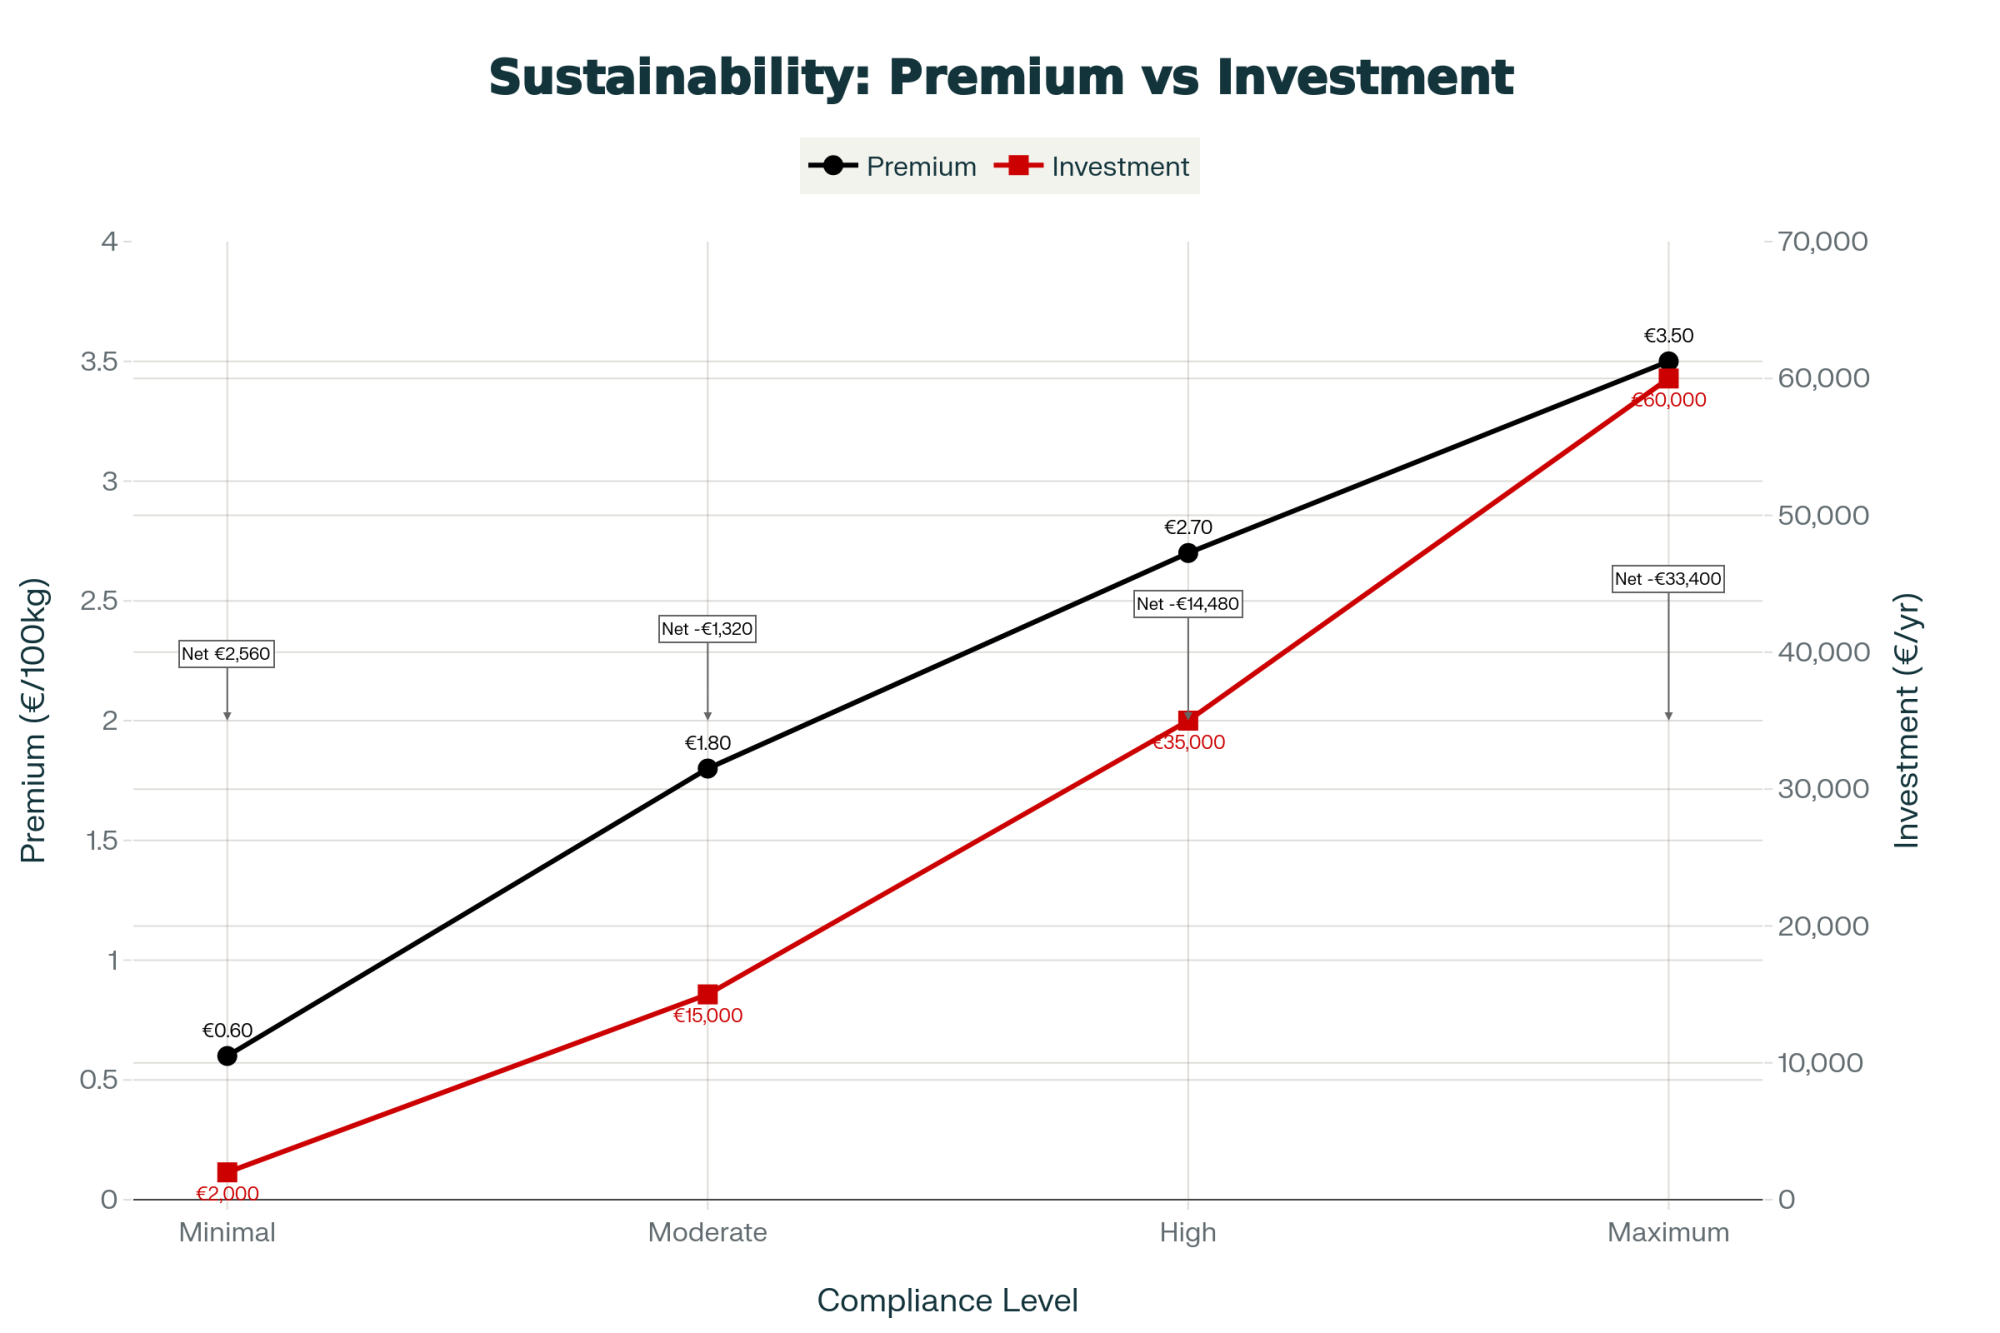
Path Three: Premium Market Positioning
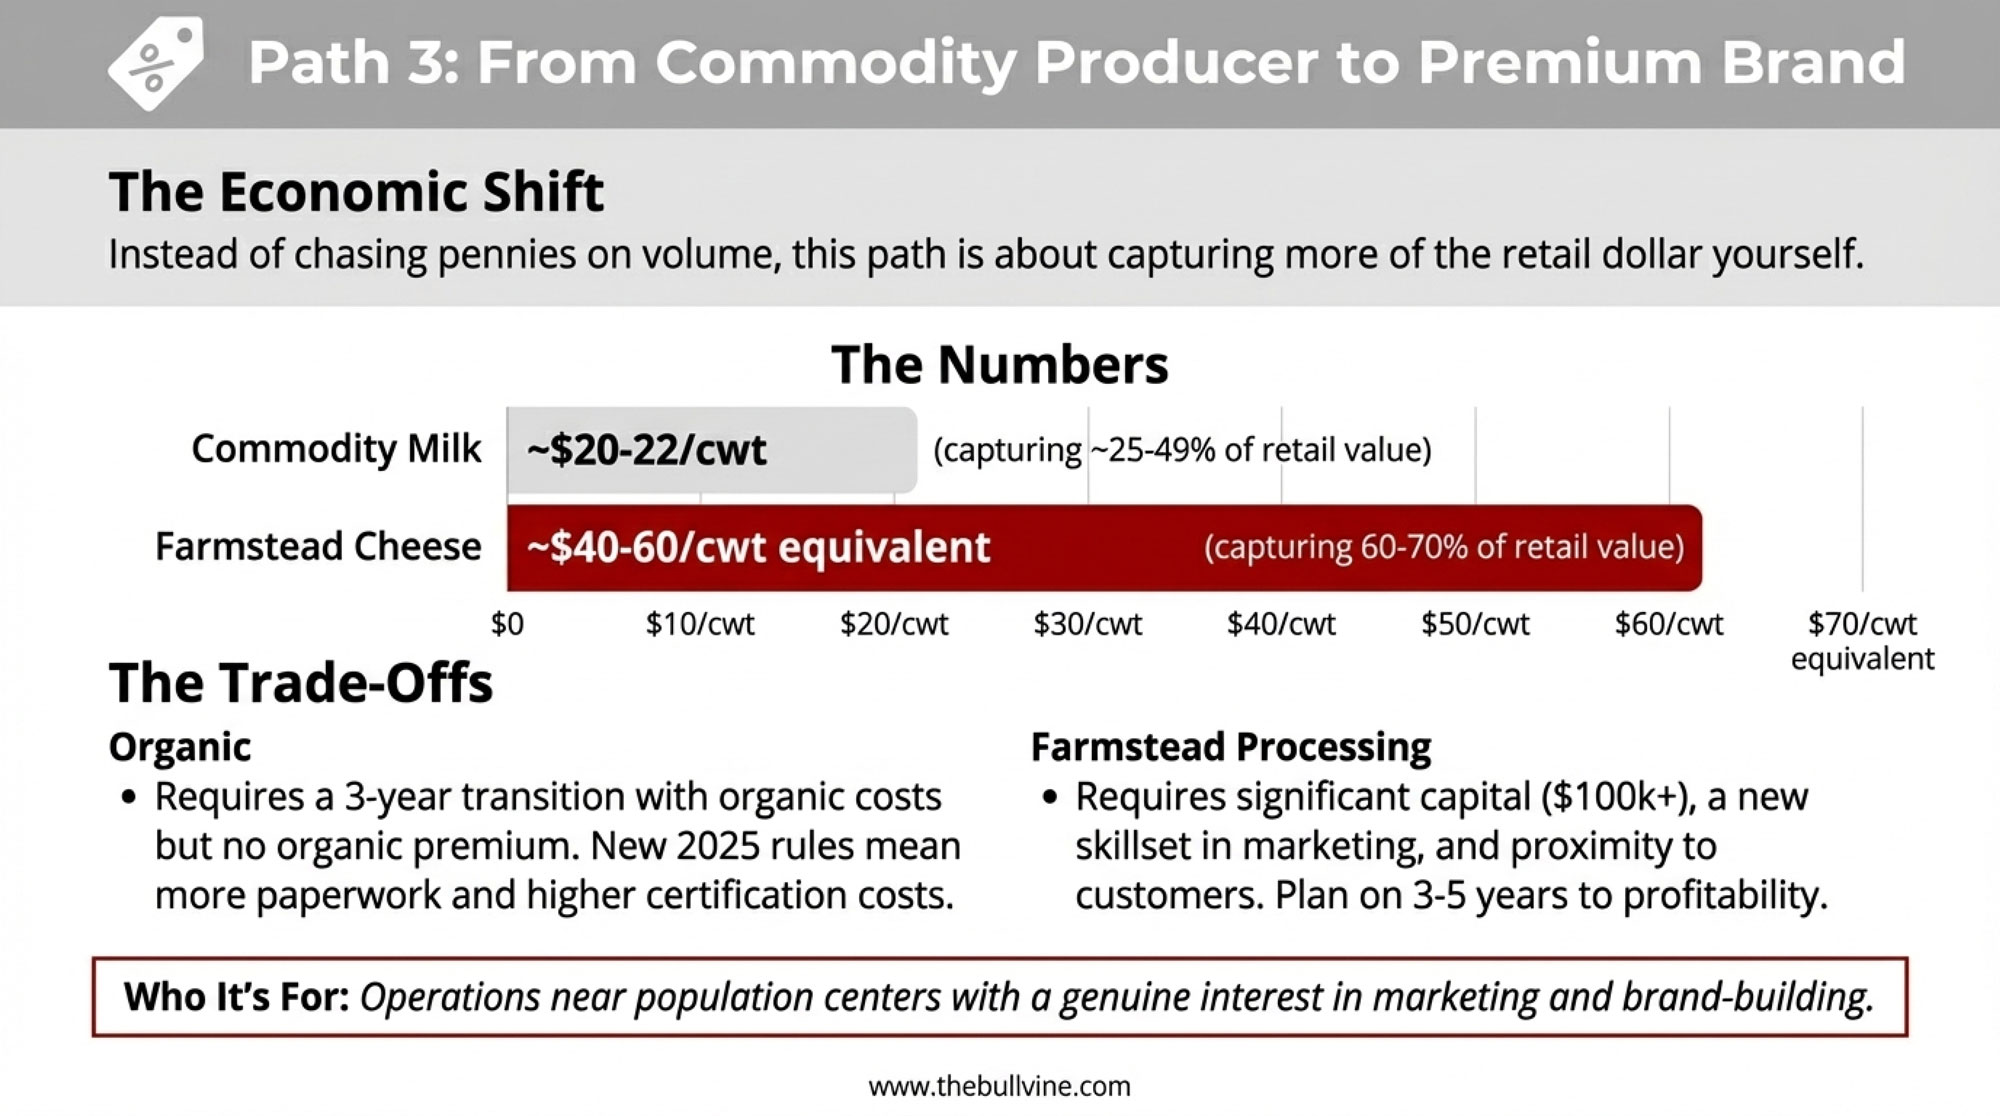
The third direction involves capturing more retail value through differentiation—such as organic certification, farmstead processing, or direct-to-consumer sales.
The economics genuinely shift here. Commodity milk at $20-22 per hundredweight captures about 25-49% of retail value, depending on the product—USDA data shows fluid milk’s farm share runs higher than cheese or butter. Farmstead cheese operations can realize $40-60 per hundredweight equivalent, capturing 60-70% of retail value, according to case studies from Penn State Extension and the Vermont Agency of Agriculture.
| Market Position | Price ($/cwt equivalent) | Farm Share of Retail % | Market Access Reality |
| Commodity Milk | $20-22 | 25% | Immediate; established processor relationships |
| Organic Certified | $40-46 (varies by buyer; grass-fed premiums $36-52) | 50-60% | 36-month transition without organic premiums; buyer commitment required first |
| Farmstead Cheese/Processing | $50-65 | 60-70% | 3-5 year market development; requires proximity to metro areas 100 miles or less |
For organic specifically, the transition requires careful planning. USDA organic certification requires three years of chemical-free land management before milk can be sold as organic—and during that transition period, you’re bearing organic production costs without organic premiums. Capital requirements typically run $50,000-150,000, depending on your starting point.
What I’m hearing from certifiers and industry groups is that certification costs have risen notably for 2025—the new Strengthening Organic Enforcement rule has created additional paperwork requirements, and several certifiers have raised prices in response. Factor that into your projections.
Some operations have navigated the transition successfully by phasing it across their land base, but it requires 18-24 months of cash flow management without premium returns. Go in with your eyes open.
For farmstead processing, the requirements are significant. Penn State Extension notes that total costs for setting up a cheese enterprise “can easily total over $100,000” depending on scale and regulatory requirements. Vermont case studies show a wider range—$15,000- $40,000 for small-scale farmer-built facilities processing limited volumes, up to $150,000- $ 500,000 for commercial, licensed operations with turnkey equipment.
You generally need proximity to markets—within 100 miles of metro areas with appropriate demographics—and patience. Plan on 3-5 years before profitability.
Northeast operations have shown particular success with this model, given the region’s population density and consumers’ willingness to pay premiums for local products. But I’ve also seen successful farmstead operations in unexpected locations—sometimes it’s about finding the right niche rather than the perfect geography.
This path suits operations near population centers with a genuine interest in marketing and brand-building. It’s not for everyone, but it’s created viable businesses for producers with the right circumstances and inclinations.
💡 BULLVINE INSIDER TIP: Premium Market Positioning
Before committing to organic transition or farmstead processing:
Organic pathway:
- Secure a buyer commitment first — Contact organic processors (Organic Valley, Maple Hill, regional buyers) about supply needs before starting the transition. Some regions are oversupplied; others are actively recruiting. NODPA’s September 2025 pay price survey shows grass-fed organic premiums ranging from $36/cwt to $52/cwt, depending on the buyer and certification level.
- Budget for the paperwork — Certification costs are up for 2025 due to the Strengthening Organic Enforcement rule implementation, and record-keeping requirements have increased substantially. Factor in 4-6 hours weekly for compliance documentation.
- Model the transition cash flow — You’ll carry organic production costs for 36 months before organic premiums kick in. Most successful transitions maintain conventional income on part of the operation during this period.
Farmstead processing pathway:
- Start with farmers markets — Test your product and build a customer base before investing in full retail infrastructure. Many successful farmstead operations started selling 50-100 pounds of cheese weekly at local markets.
- Connect with your state extension — Penn State, Vermont, and Wisconsin all offer farmstead dairy programs with technical assistance and business planning resources that can help you avoid costly mistakes.
- Visit operating farmstead dairies — Nothing replaces seeing the daily reality of retail cheese production. Most farmstead operators are generous with their time for serious prospective producers.
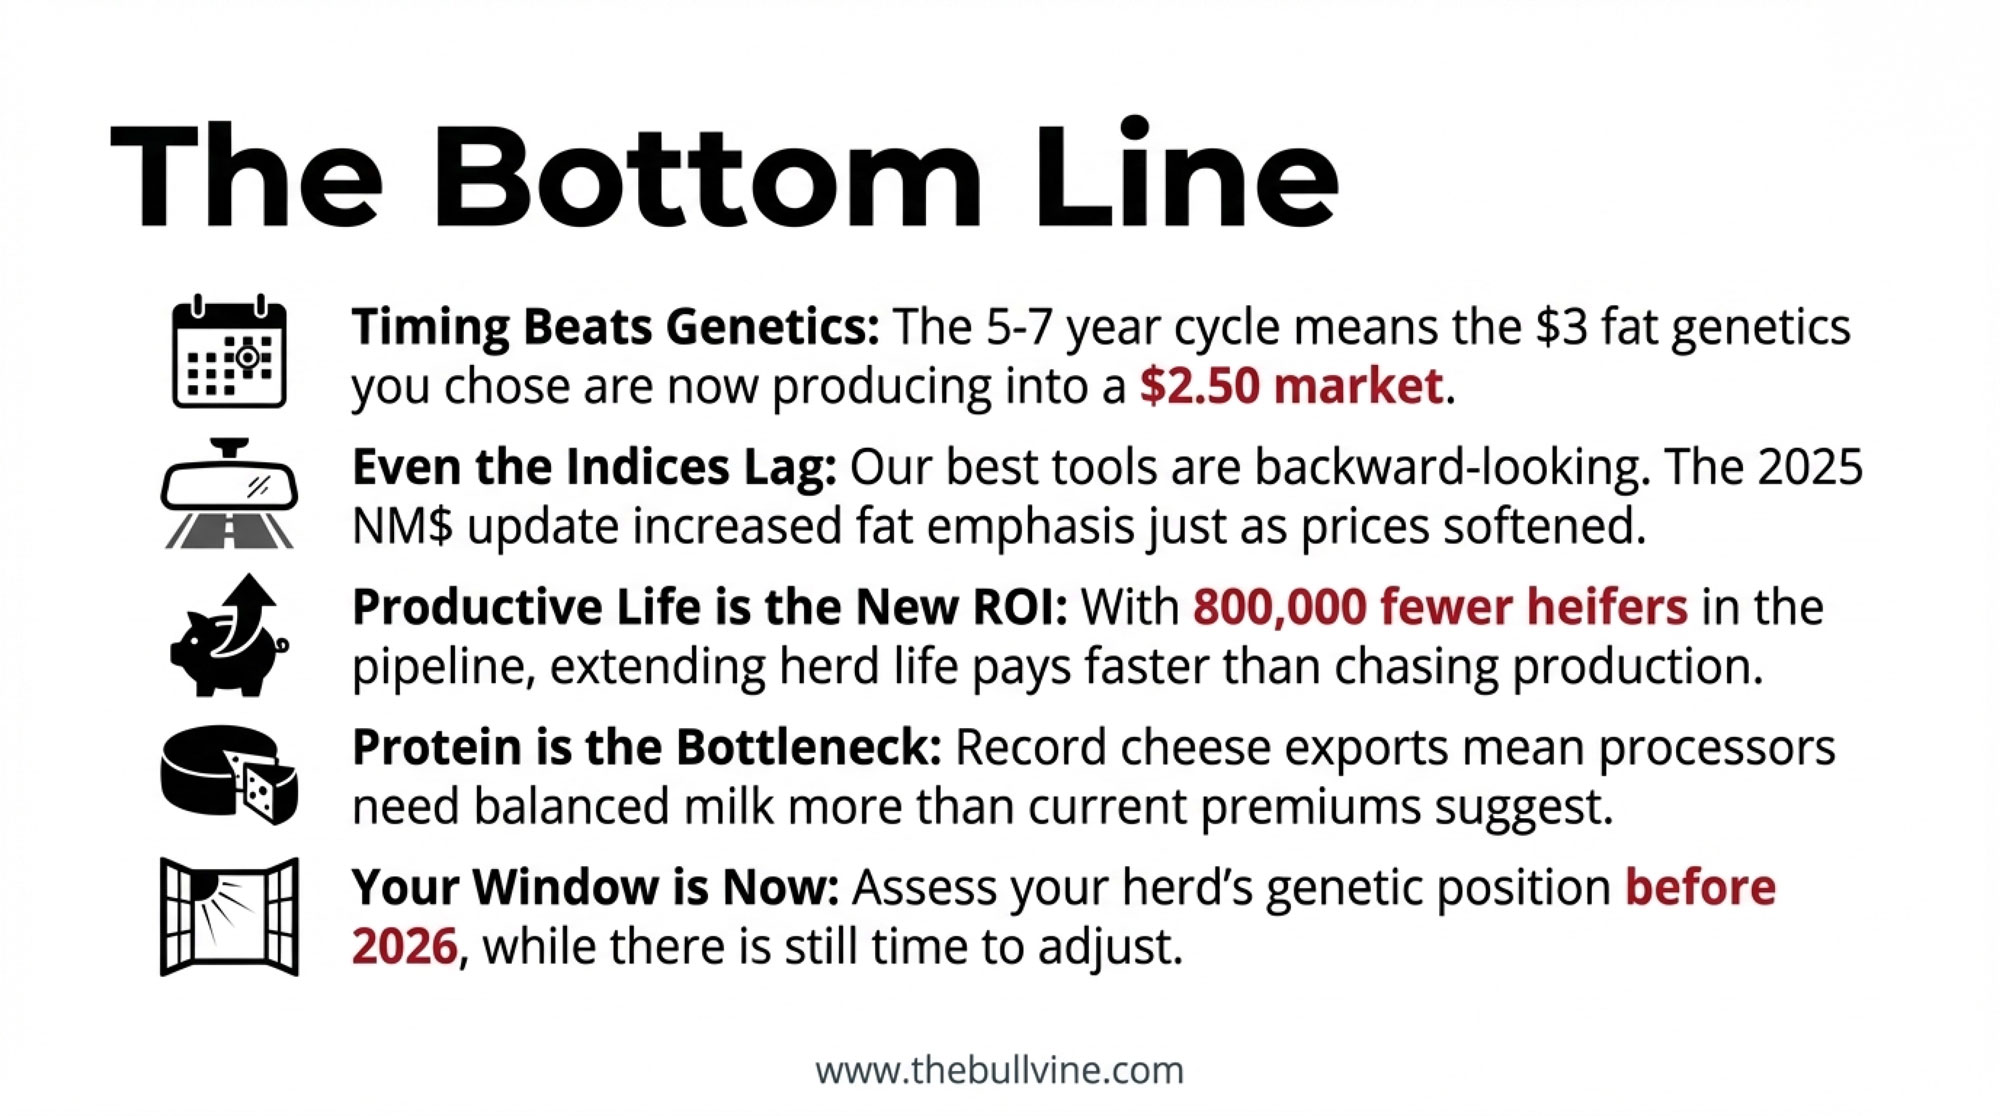
The Bottom Line
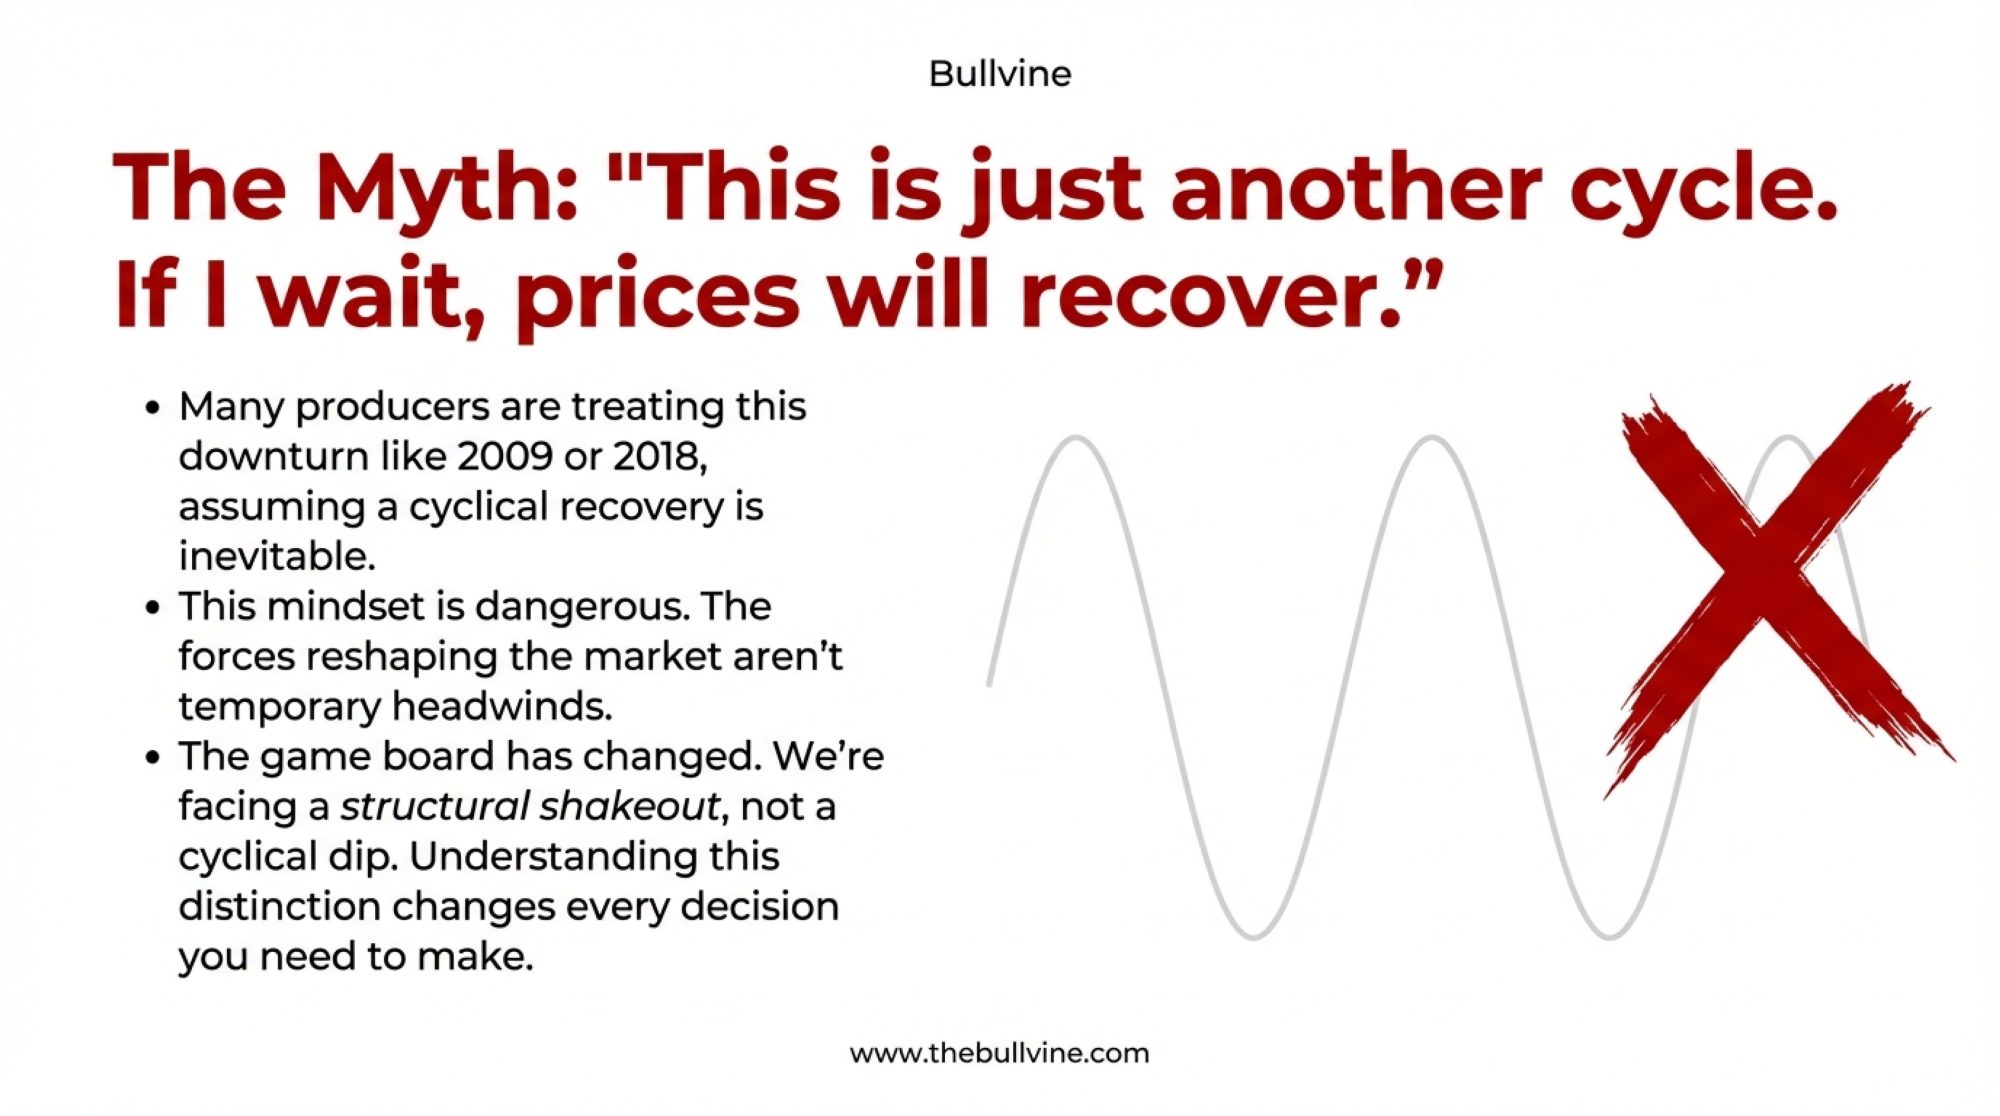
Looking at these dynamics—the structural shifts, the research findings, the strategic options—what should producers do?
I don’t think there’s one right answer. Different operations face different circumstances, and what works for a 2,000-cow Idaho dairy won’t necessarily fit a 400-cow Wisconsin operation or a 200-cow Vermont farmstead. You know your situation better than any analyst does.
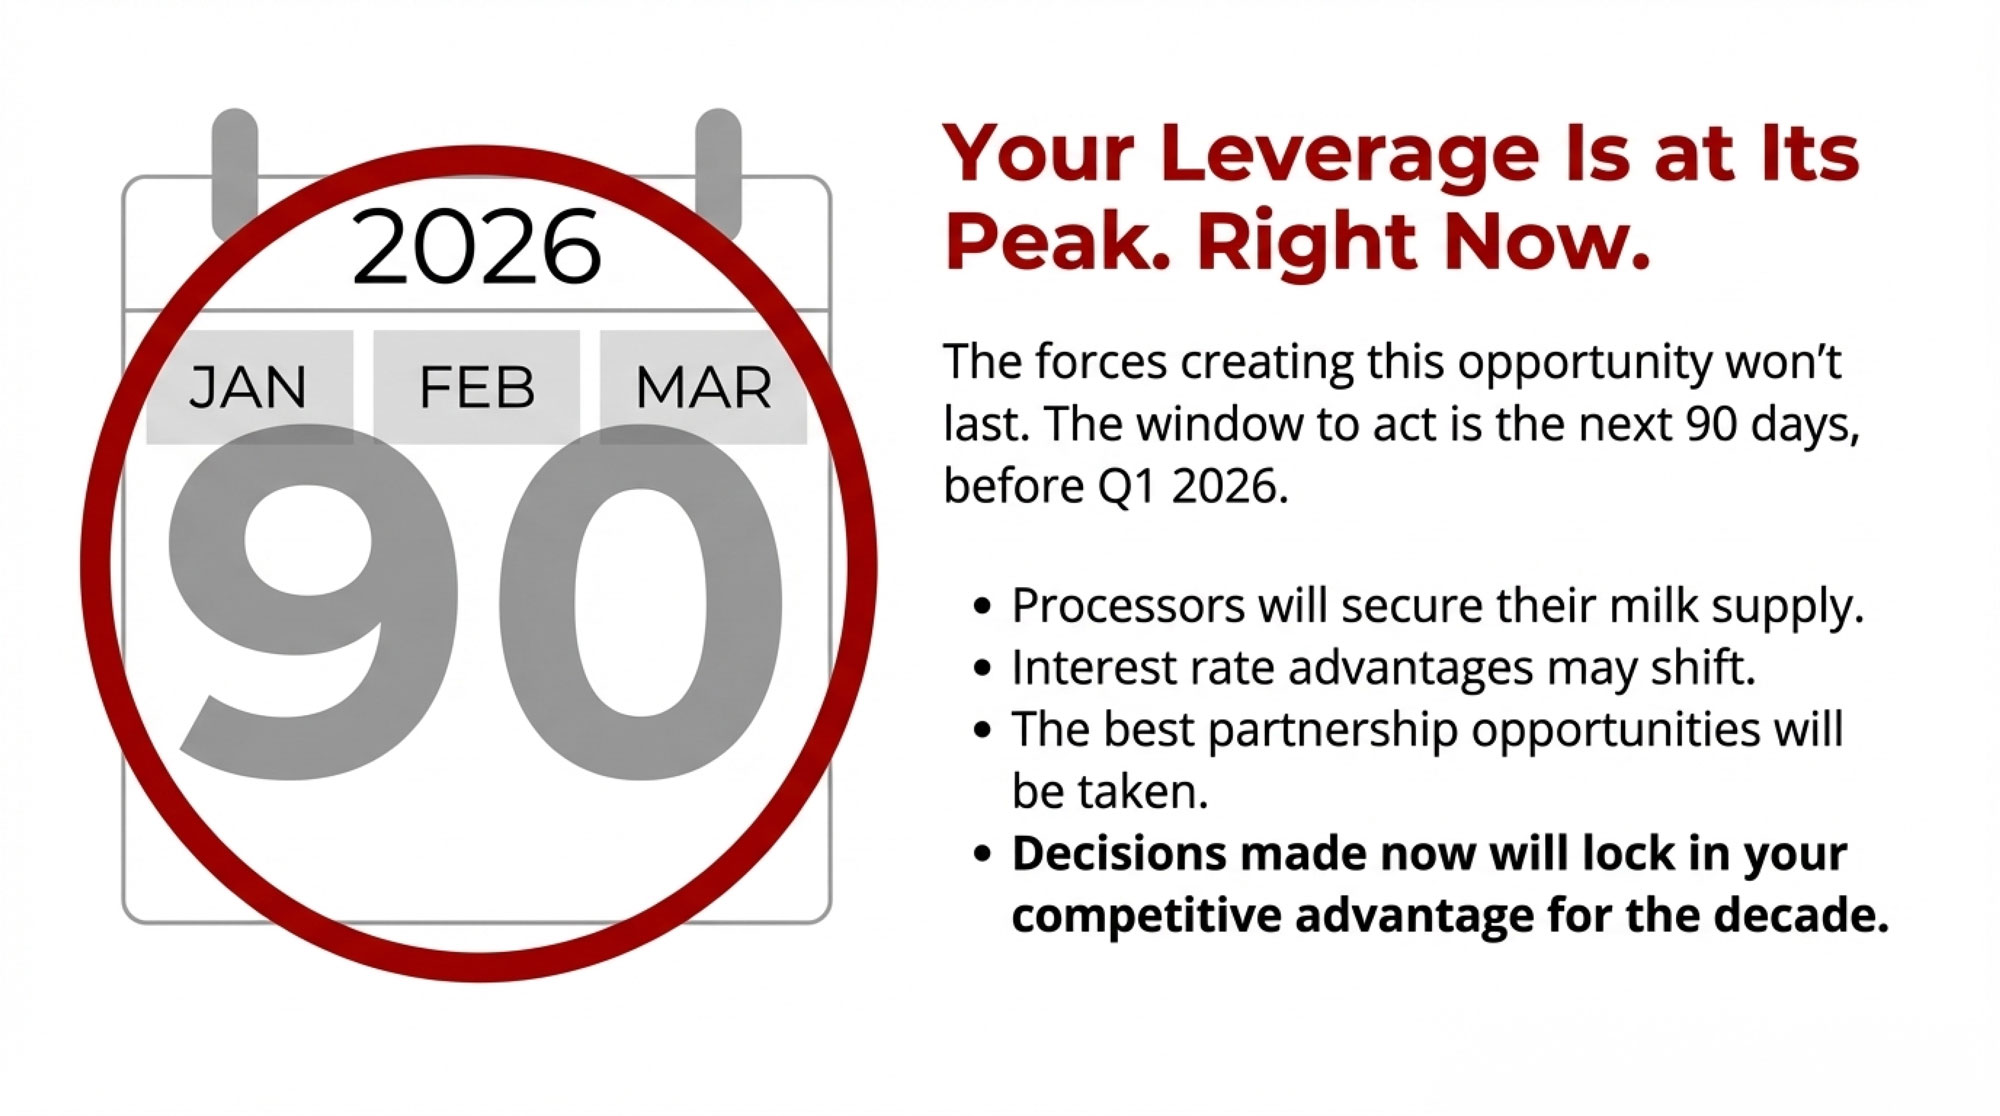
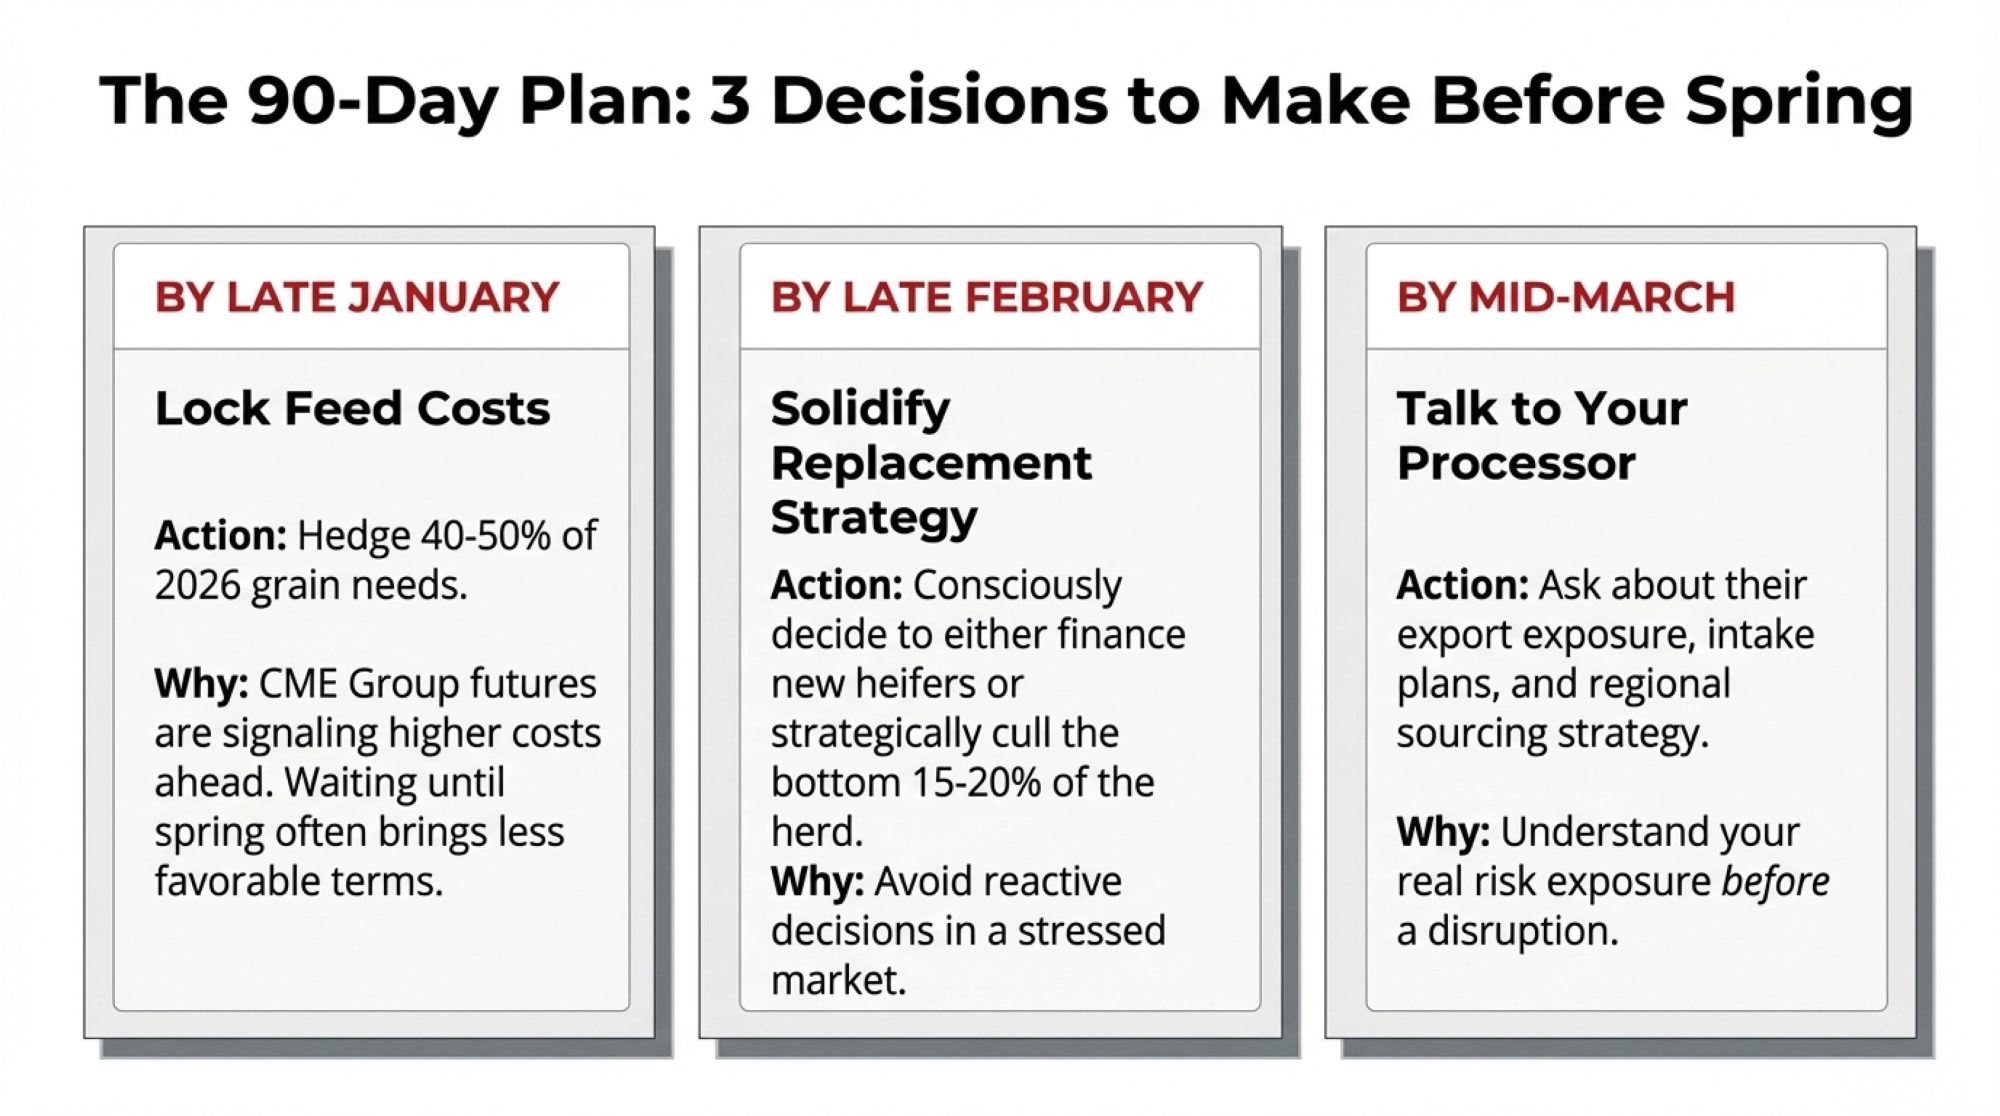
But I do think waiting for commodity markets to resolve these questions isn’t a strategy. Processing investments are being made now. Supply relationships are being established now. Operations are positioning for the next decade; decisions are being made now.
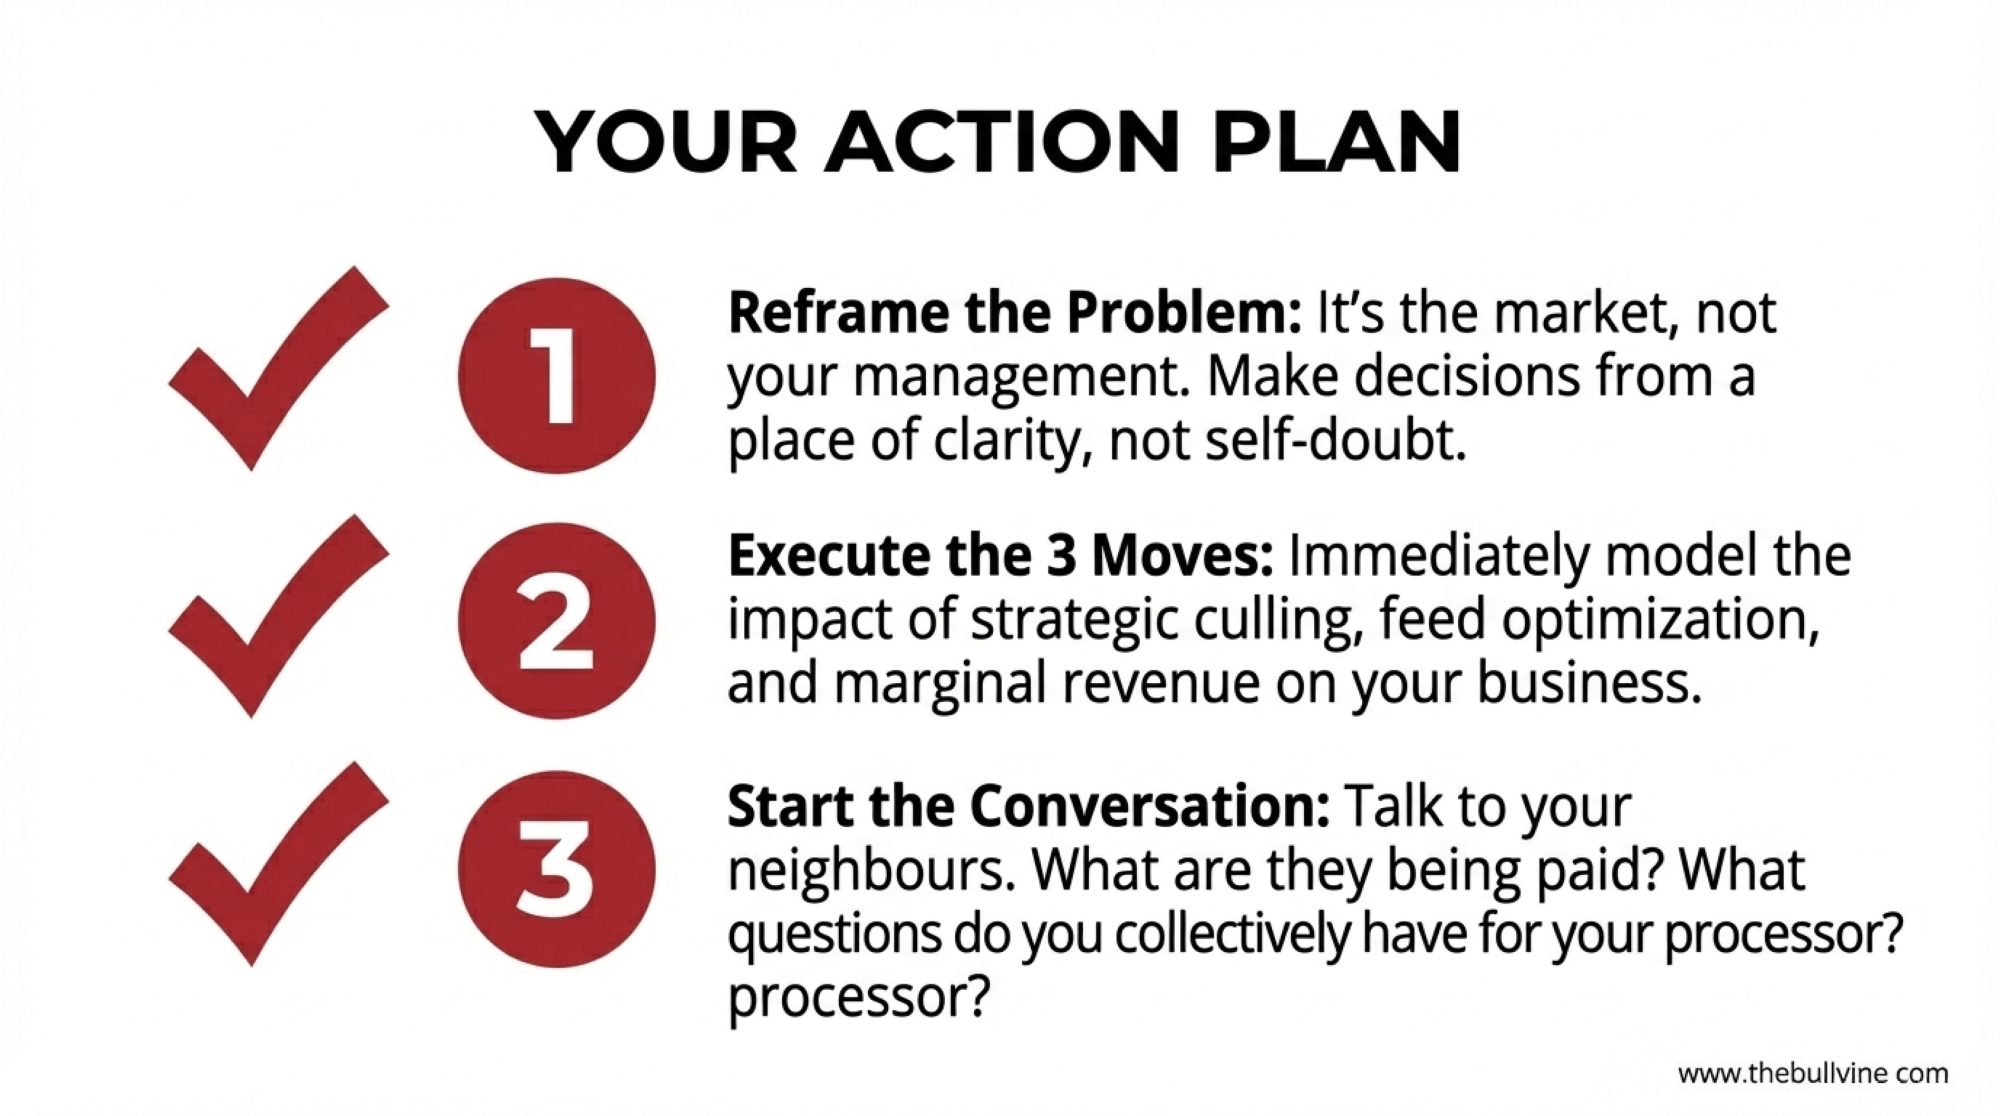
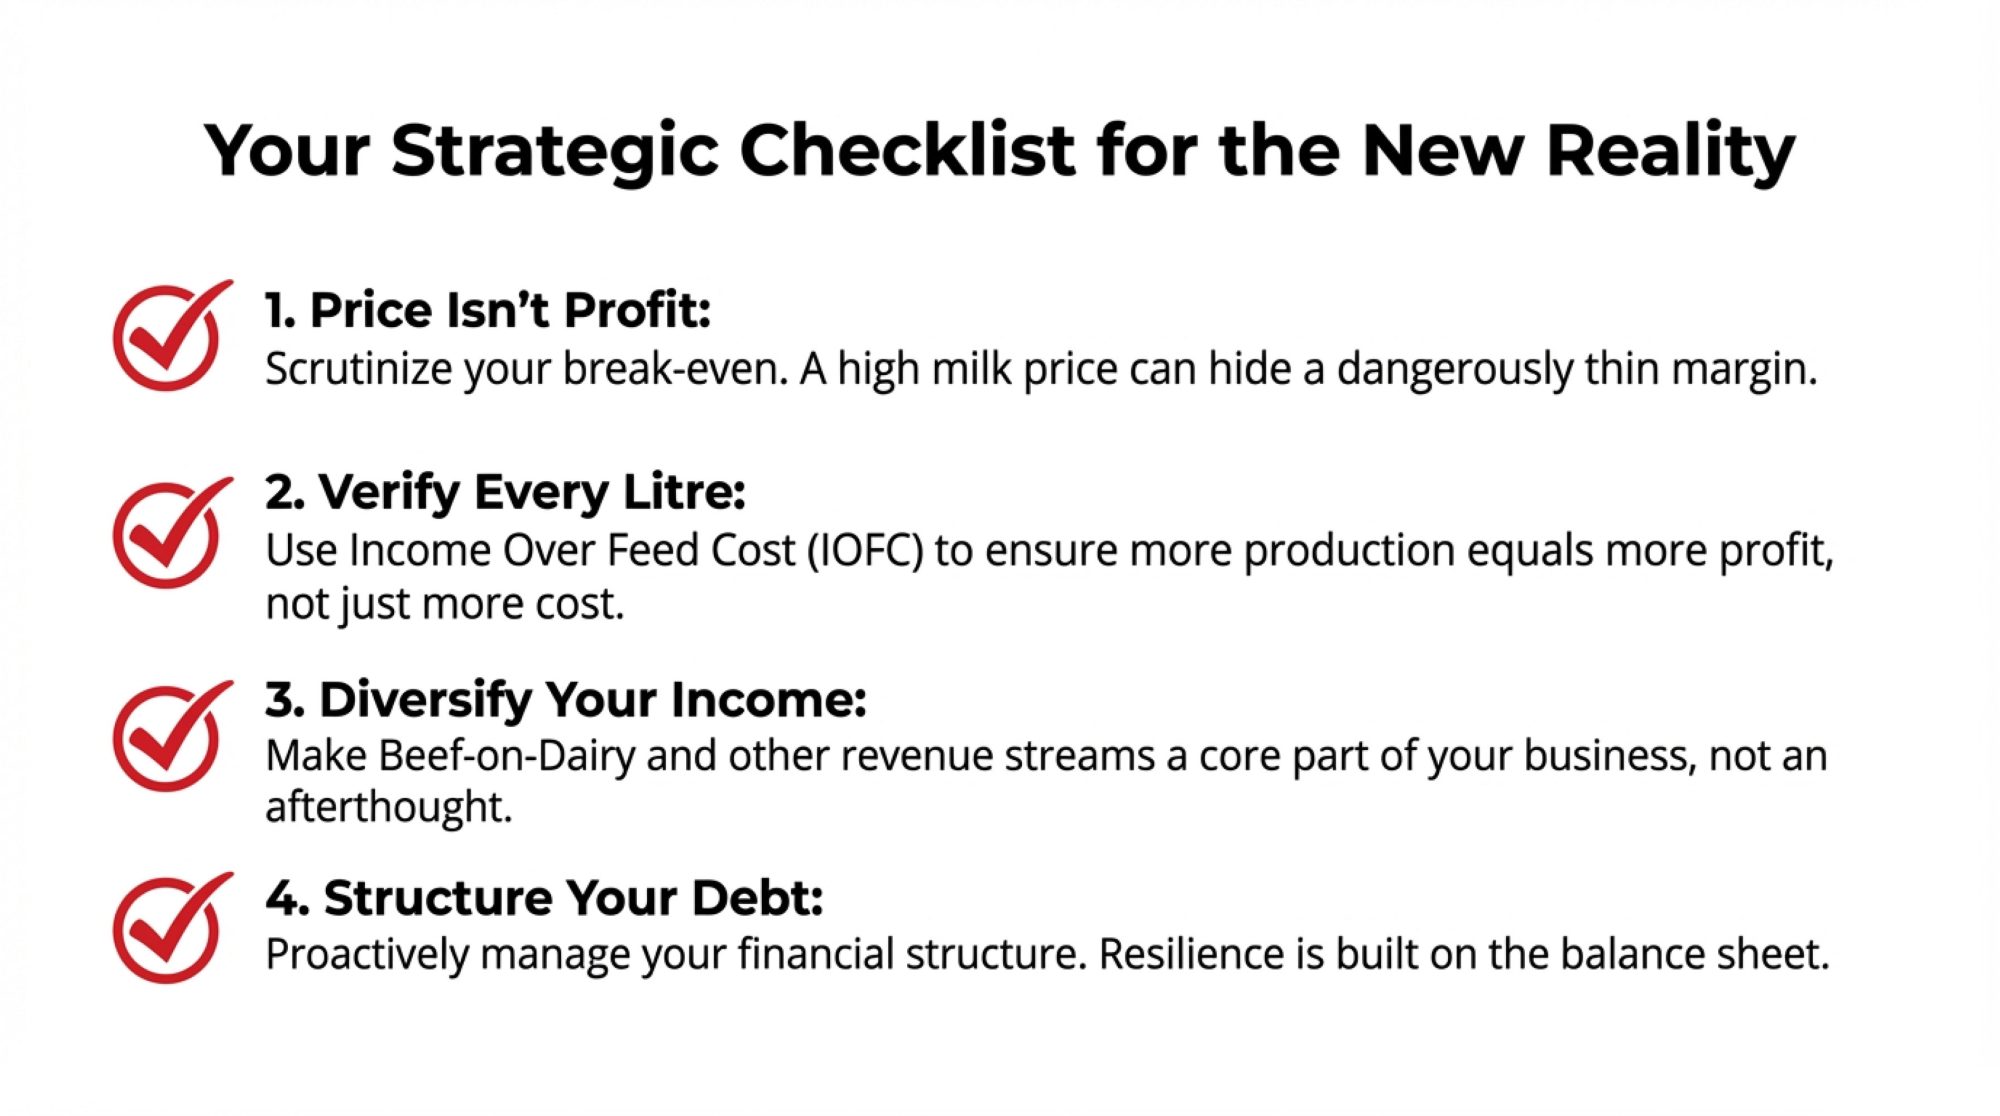
If you take three things from this analysis, make them these:
First, pull your operation’s income-over-feed-cost trend and compare it against Penn State Extension benchmarks for your herd size. Know where you stand before choosing a path. The gap between average and top-quartile performance is where hundreds of thousands of dollars hide on mid-size operations.
Second, have a direct conversation with your cooperative or processor about their capacity plans for the next five years. Are they seeking supply? Locked into large-operation contracts? Planning new facilities? This isn’t information that comes to you automatically—you have to ask for it.
Third, understand where processing investment is flowing in your region and what supply characteristics those facilities are seeking. IDFA tracks the $11 billion investment wave; your state dairy association can often tell you what’s happening locally.
These aren’t the strategic decisions themselves—they’re the foundation for making those decisions clearly.
The collective questions the research raises—cooperative governance, policy engagement, industry organization—matter too, though they operate on longer timeframes and require collective action. Showing up at cooperative meetings, engaging with your board, participating in industry organizations… these things feel distant from daily farm management, but they’re how farmers influence the structures that shape their prices.
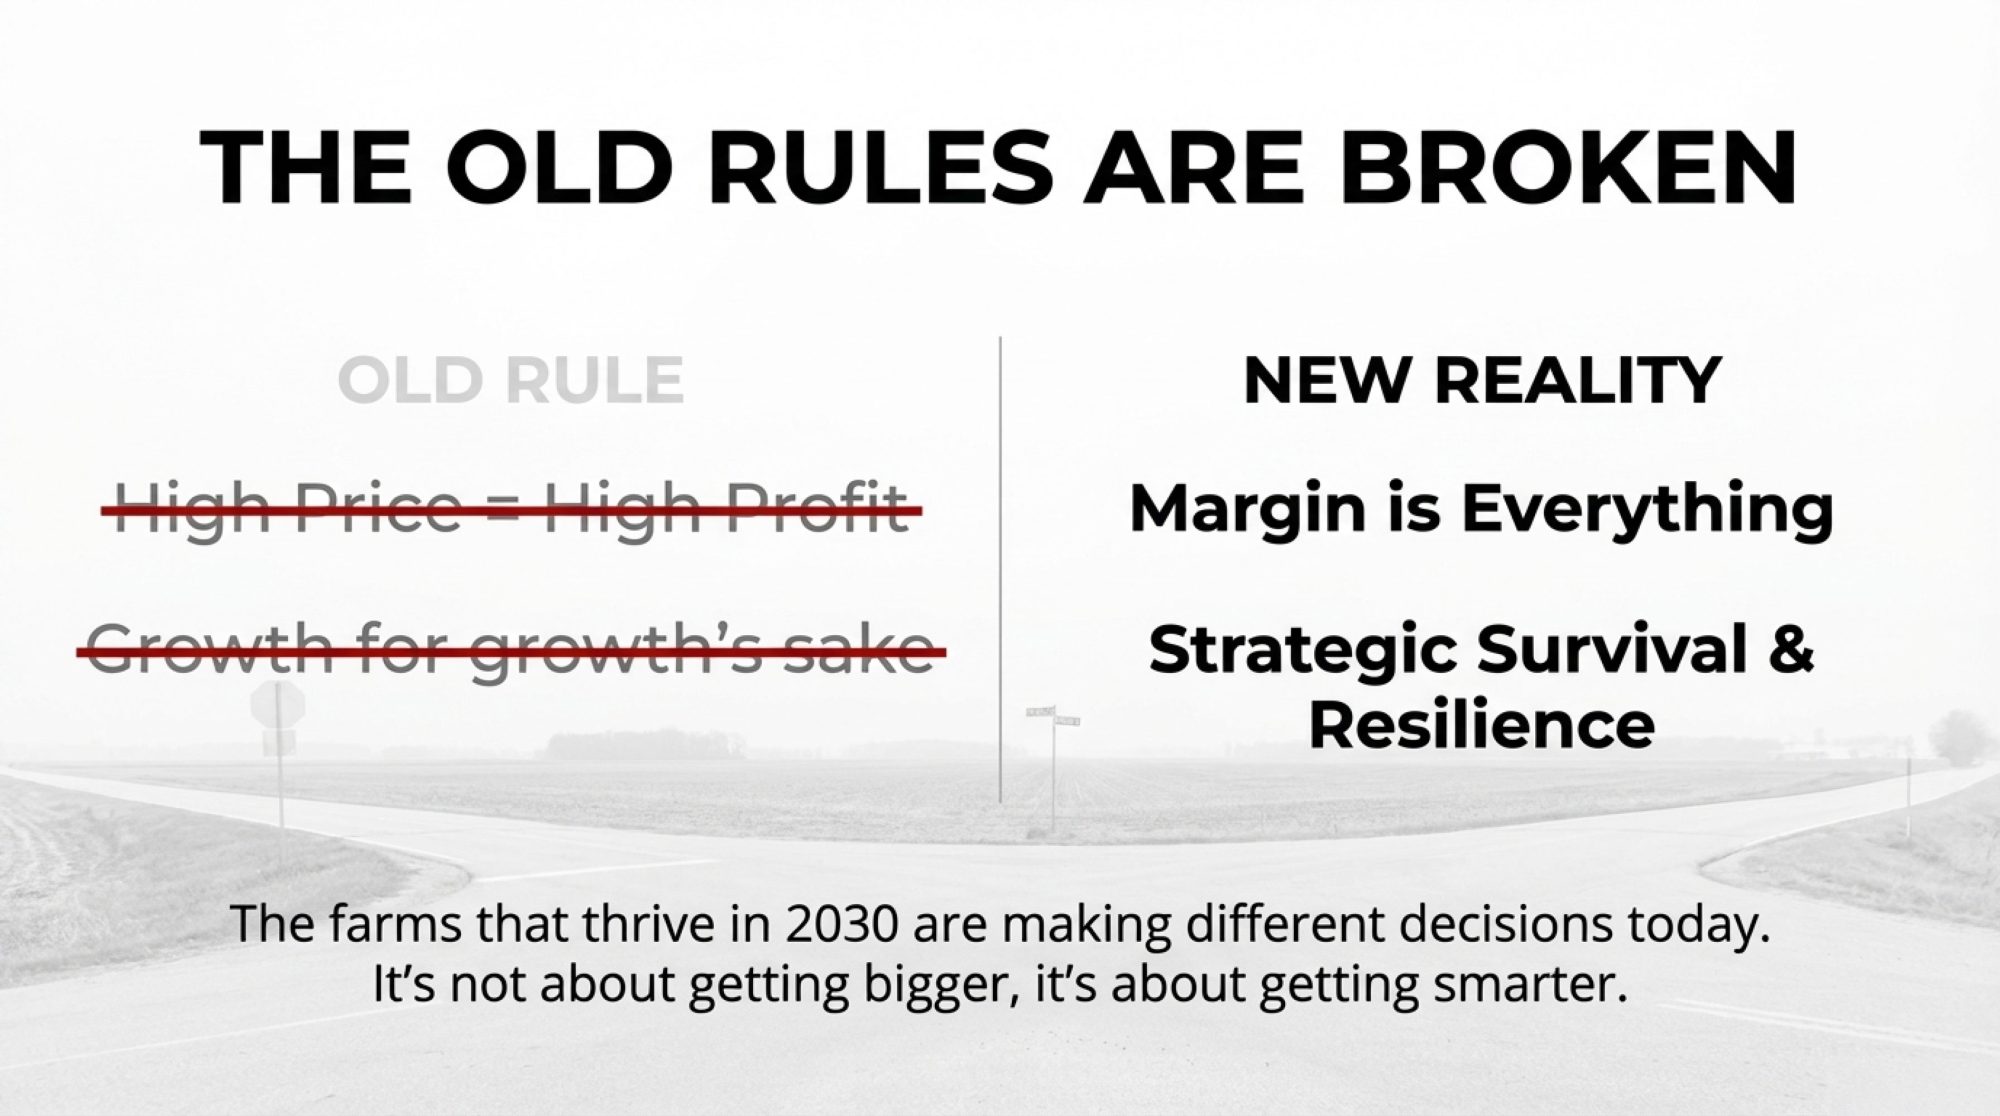
The farms that will be thriving in 2035 won’t be the ones that waited for conditions to improve. They’ll be the ones that understood conditions clearly and positioned themselves accordingly.
Resources for Further Information:
- USDA Agricultural Marketing Service Dairy Programs: ams.usda.gov/rules-regulations/moa/dairy
- Penn State Extension Dairy Team: extension.psu.edu/dairy
- University of Minnesota FINBIN: finbin.umn.edu
- Northeast Dairy Business Innovation Center: northeastdairy.org
- Organic Transition Resources: organictransition.org
Key Takeaways:
- Farm share of the retail dairy dollar has declined from 52% in 1980 to approximately 25% today, reflecting both legitimate supply chain costs and structural market dynamics
- European research suggests that farmer organization and collective bargaining mechanisms may influence price transmission as much as processor market structure
- $11 billion in new processing investment is reshaping the industry, with much of the capacity oriented toward export markets and large-scale supply relationships
- On a well-managed 500-cow dairy, the gap between average and top-quartile execution could mean $350,000-550,000 annually—that’s the real opportunity in efficiency optimization
- Mid-size operations face three viable strategic paths: efficiency optimization, collaborative or individual scale expansion, or premium market positioning
- Strategic clarity and committed execution will distinguish operations that thrive through the next decade
Complete references and supporting documentation are available upon request by contacting the editorial team at editor@thebullvine.com.
Learn More
- Tech Reality Check: The Farm Technologies That Delivered ROI in 2024 (And Those That Failed) – Reveals which automation tools actually pay for themselves and which are just expensive distractions. This data-heavy breakdown arms you with verified ROI timeframes, ensuring your next capital investment drives measurable margin improvement rather than just adding complexity.
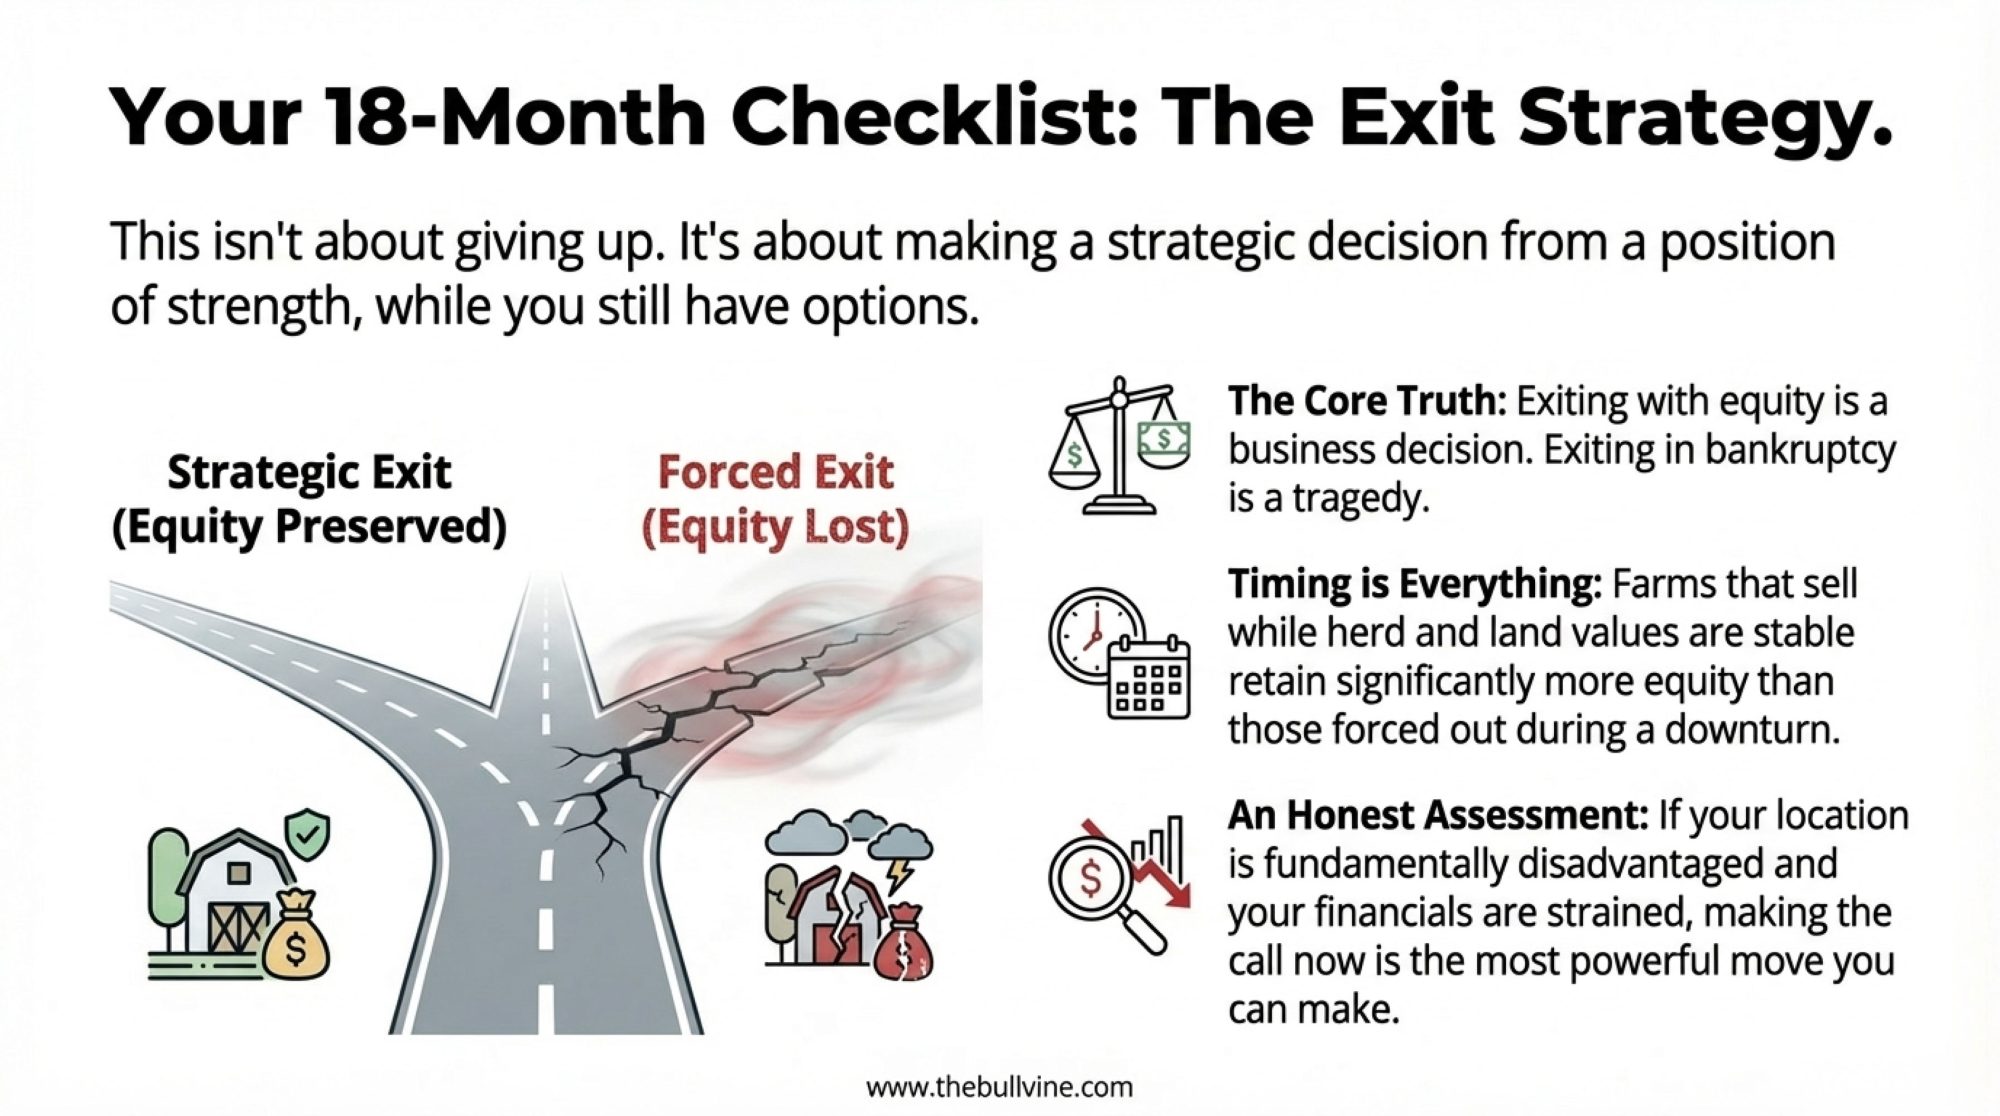
- Squeezed Out? A 12-Month Decision Guide for 300-1,000 Cow Dairies – Delivers a high-stakes roadmap for mid-size operations navigating the current structural squeeze. You’ll gain a clear framework for evaluating whether to scale, pivot to organic, or exit, helping you protect your family’s equity before market options narrow.
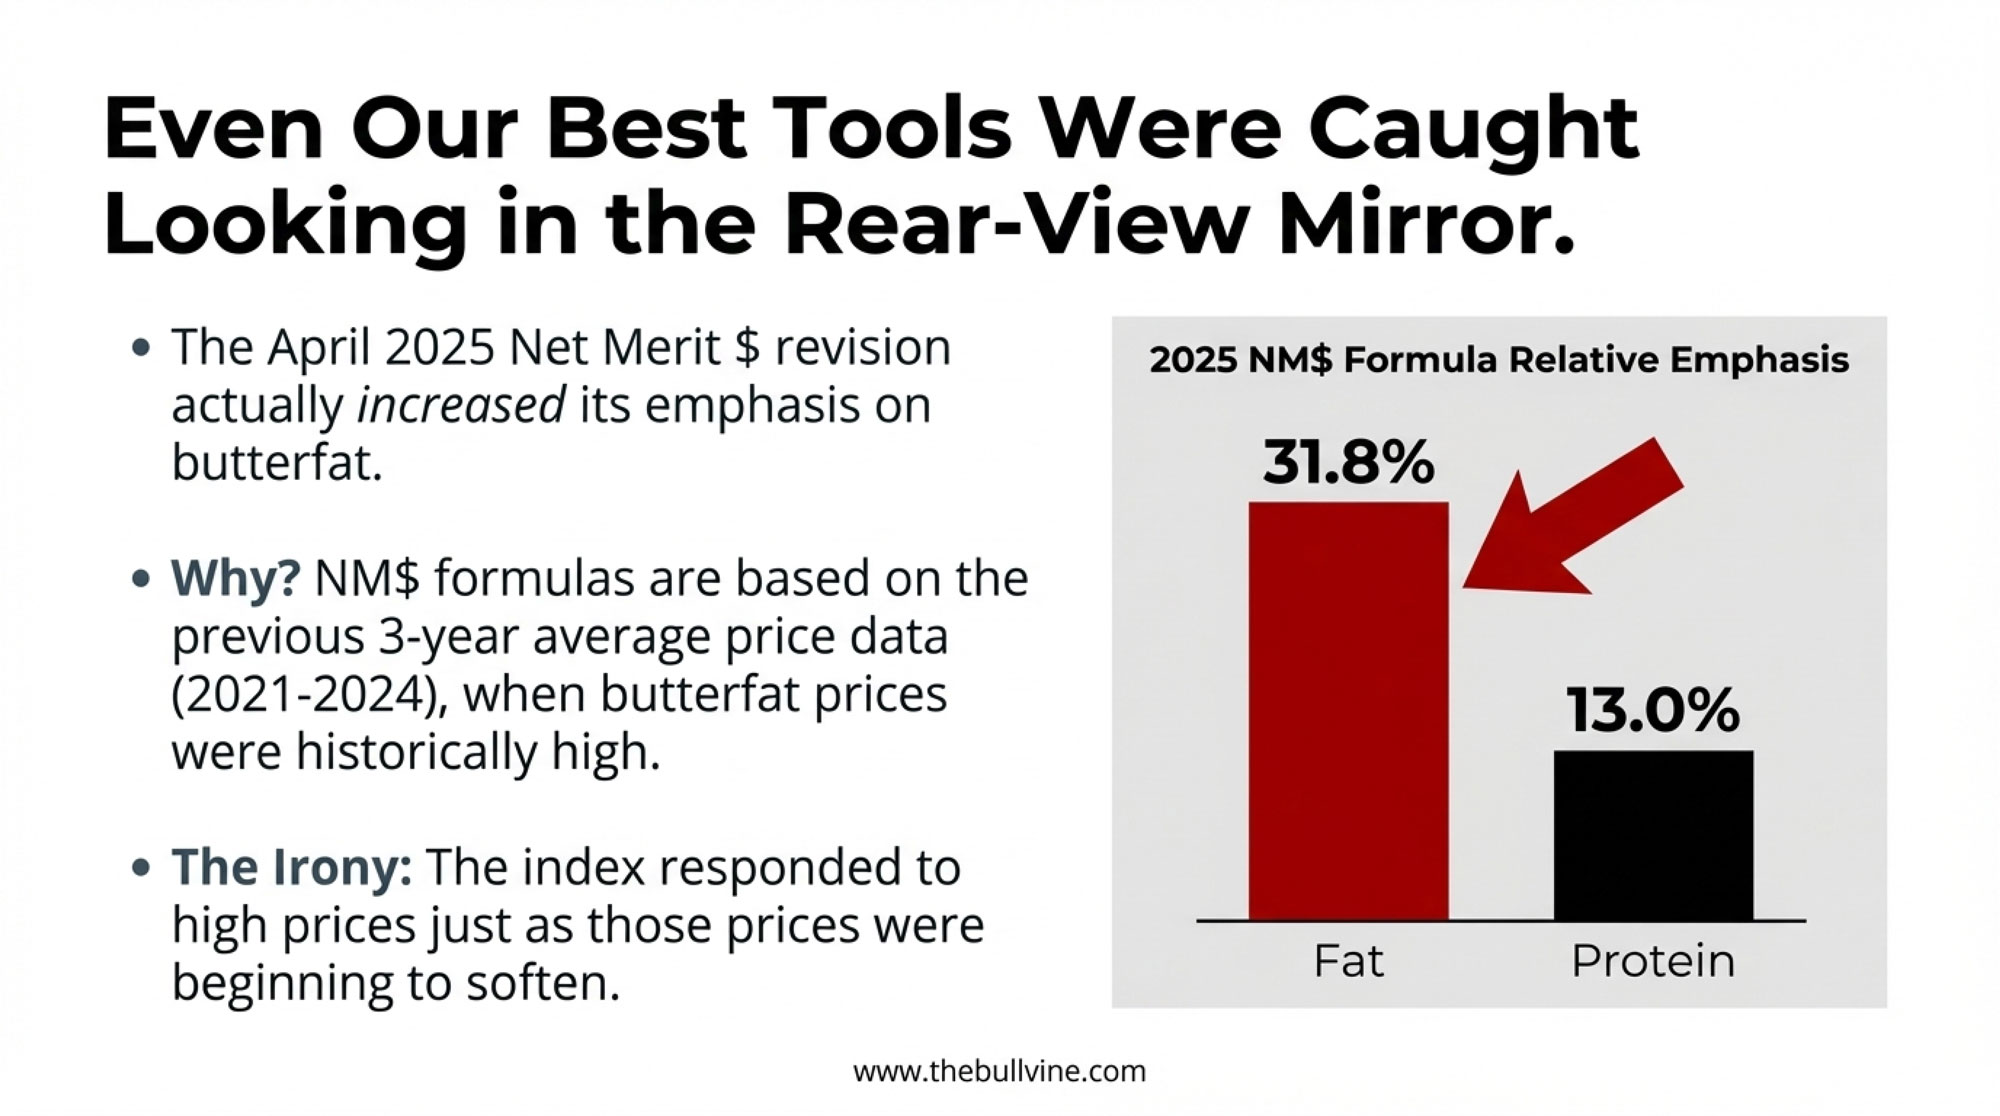
- From -43% to +0.8%: The Genetic Shift Powering Dairy’s First Fluid Milk Growth Since 2009 – Exposes how a massive shift in consumer demand and genetic selection is finally reviving fluid milk sales. It breaks down the 2025 Net Merit changes, showing you how to retool your breeding program to capture premiums from the high-protein, lactose-free market.
 Join the Revolution!
 Join the Revolution!
Join over 30,000 successful dairy professionals who rely on Bullvine Weekly for their competitive edge. Delivered directly to your inbox each week, our exclusive industry insights help you make smarter decisions while saving precious hours every week. Never miss critical updates on milk production trends, breakthrough technologies, and profit-boosting strategies that top producers are already implementing. Subscribe now to transform your dairy operation’s efficiency and profitability—your future success is just one click away.