Every country loves to tell you that they have the best Genetics in the world and that their cattle are superior to any others. At a recent International Committee for Animal Breeding (ICAR) Session in Cork Ireland, a group of leading geneticists got together to discuss lots of highly scientific and many mind boggling things. Tables upon tables of stats and graphs that look more like maps of the solar system and would make most people’s heads spin. However, from that session there were some really interesting presentations about genetic improvement around the world that just needed to be “translated” into dairy speak. The following is the Bullvine’s attempt to de-nerd the nerdy.
Look Who`s Talking
Canadian Dairy Network Researchers, along with an associate, presented a paper entitled “Genetic improvement: a major component of increased dairy farm profitability’. To be totally honest it was the ‘profitability’ word that first drew our attention but on reading the paper, studying the power point presentation and listening to the video of the presentation on the Internet (http://www.icar.org/Cork_2012/index.htm) we garnered many interesting facts about the genetic merit of bulls and genetic trends by year for many traits in seventeen countries for the time period 1997 to 2006. Sixteen of the seventeen countries studied were sampling more than 200 dairy bulls per year and in the USA both the TPI™ and Net Merit were included in the analysis since both are widely used total merit indexes.
Genetic Progress –Which Countries are winning the genetic race?
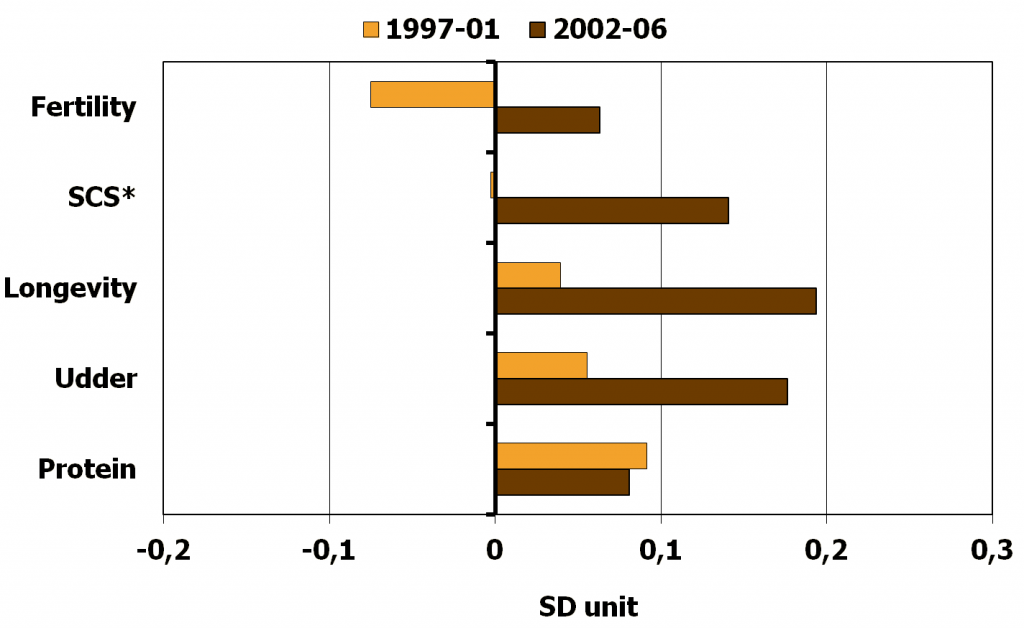
Are breeders in these 17 countries making genetic progress? Definitely yes! It is difficult to compare across countries given the multitude of ways of expressing sire proofs for traits across countries. Therefore, the researchers converted the expression to standard deviation units (SD unit) and summarized the results in the accompanying graph comparing the time periods 1997-2001 to 2002-2006.
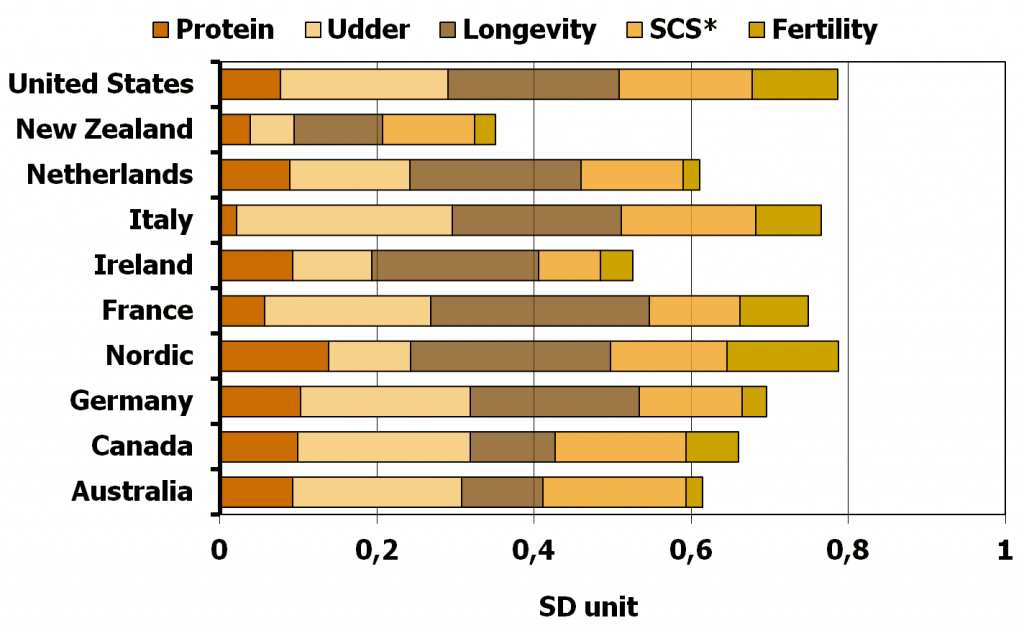
It is interesting to see that while many of the major genetic markets in the world are advancing at similar rates, the Nordic countries are giving the United States a run for their money and the Canada was the sixth fastest advancing country, almost 18% behind the genetic advancement rate of the US and the Nordic Countries.
Canada`s NOT First
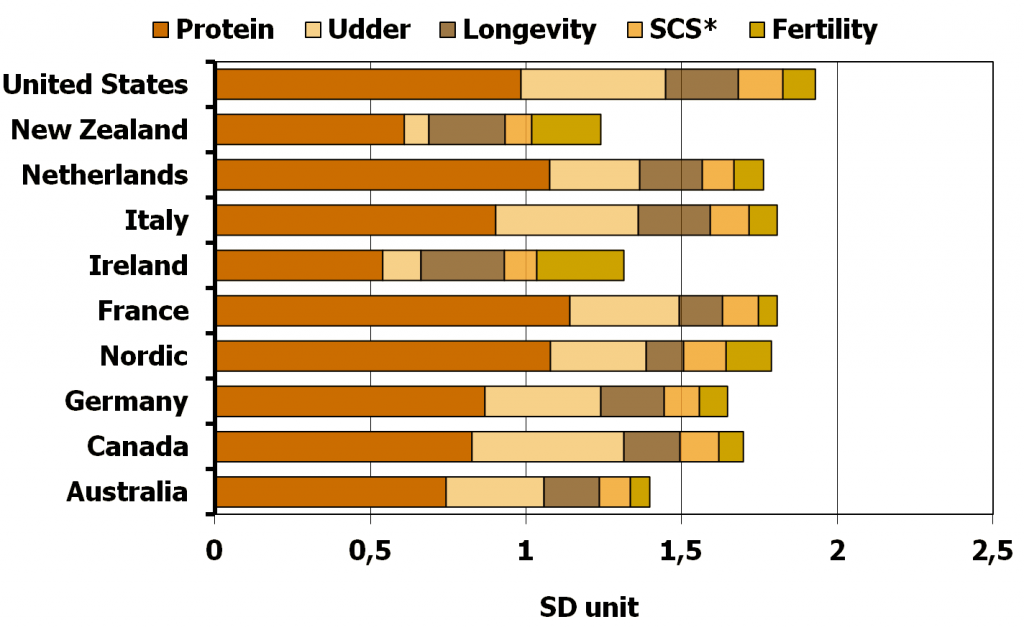
So I am sure many of my fellow Canadians are saying that we are ahead in the race, others may be gaining on us, but we still have the best cattle there are. Well folks I hate to burst your bubble but as the following chart shows, for bulls born in 2005-2006, it’s actually the United States that are out ahead followed by France and Italy. Canada comes in sixth, behind the Nordic regions and the Netherlands.
Genetic Progress by Trait – The Leaders and the ‘Also Rans’.
- Protein Yield: Increasing rates of genetic gain have been achieved by all countries except for Ireland and New Zealand where progress has been flat lined due to the major selection emphasis being on fertility and other management traits. The leaders for the increased genetic progress in protein yield are France, Nordic Countries and the Netherlands.
- Overall Udder: The rate of genetic progress for udder is also building at an increase rate with the leaders being Italy, Canada and the USA. Selection for udder improvement was not part of the breeding strategy in New Zealand and Ireland and no genetic progress was made for udders in those countries.
- Longevity: Very significant progress was made for longevity in all countries with the leaders being Ireland, Italy, New Zealand and the USA with France following behind the rest of the pack.
- Somatic Cell Score: No genetic gain was made in any country from 1997-2001 for SCS. However that turned around after 2001 and all countries made progress with the leaders for genetic progress being the USA, the Nordic Countries and Canada.
- Calving to First Service: Ireland and New Zealand have made progress since 1999 and are significantly out in front of all other countries. For the other countries there was negative progress until about 2003. Since then all countries have started to give attention to this trait and the tide has turned to where slight progress was being made by 2006. After Ireland and New Zealand, The Nordic Countries are leading the other countries in increasing their rate of genetic progress for this fertility trait.
So what happened to production?
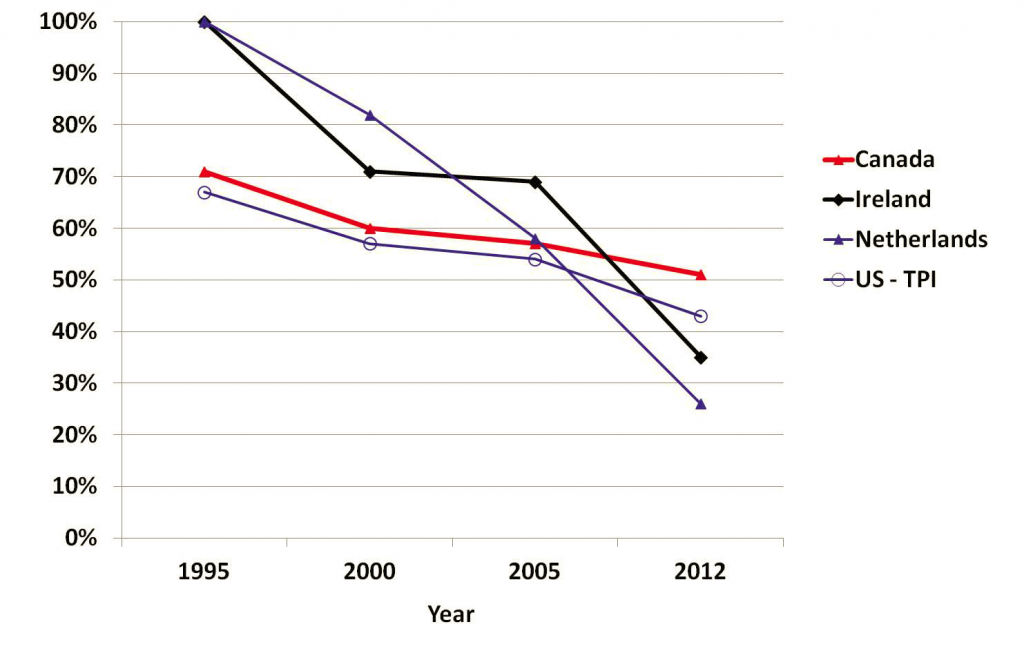
There is Reduced Emphasis on Production. By way of example the researchers provided a graph (below) showing how The Netherlands and Ireland have gone from 100% emphasis on production traits in their total merit index in 1995 to approximately 30-35% in 2012. While the USA and Canada have been more moderate in their reduced emphasis on production traits, from 70% to 45-50% in their 2012 total merit indexes. There is more to breeding than all out selection for production but it is still an important component in the total scheme of things.
What Traits are Driving Progress?
When you take a look at the average genetic progress by trait across countries (graph below) you see that the rate of genetic advancement in each area reflects the relative weighting change in each country`s major index. With the rate of genetic gain on longevity, health and fertility greatly improving and that for the production trait (protein) actually showing a slightly slower rate of genetic gain. It is interesting to note that in the period of 1997-2001 the primary emphasis on protein improvement actually had a negative impact on the rate of improvement for fertility.
Different Strokes for Different Folks
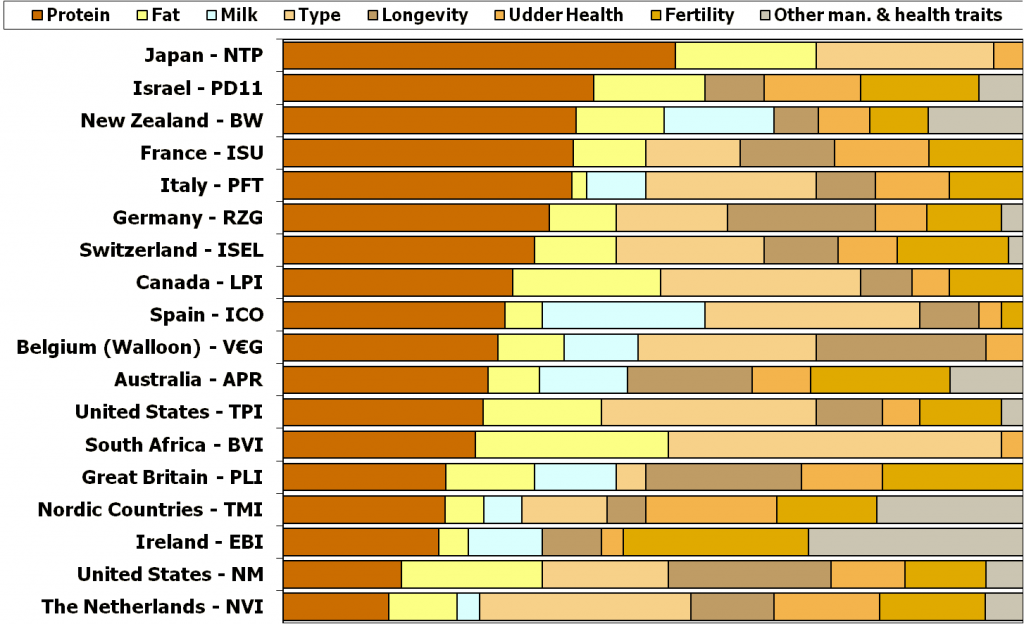
As the chart below indicates, the relative weights each country put on each trait in their national indexes has a huge impact on the rate of genetic gain for those traits. We understand that not every country dairy’s under the same circumstances. Hence why for Japan places 72% of the emphasis on protein, fat and milk while the Netherlands places 26% of the emphasis on protein and fat yield. Ireland and then the Nordic countries place the most emphasis on Health, Fertility and other management traits. South Africa then USA (TPI™), Spain, The Netherland and Canada place the most emphasis on overall type. Italy places the most emphasis on udders. In addition, the USA (Net Merit) places the most emphasis on longevity.
The 2012 average weights placed on the various components in the 18 indexes are:
- Production 48%
- Type 17%
- Longevity 11%
- Fertility 11%
- Udder Health 8%
- Other 5%
Increased emphasis on functional traits in most countries has resulted in more genetic progress for these traits. These advances were achieved without a reduction in the rate of progress for key production and conformation traits and without the use of genomic selection, since that new tool was not yet available. As genomic genetic evaluations were not occurring from 1997 to 2006, it will be interesting to see the trends for the five and ten years following 2006 when extensive use of gnomically evaluated bulls has occurred.
The Bullvine Bottom-line
Neither the art nor the science of dairy cattle breeding is dead. In fact it can likely be said that rates of genetic improvement are about to accelerate. Are we ready to keep up?
Get original “Bullvine” content sent straight to your email inbox for free.


