Stay updated on global cheese market trends. Rising prices and changing demands can impact dairy farmers. Stay ahead of the curve.
Summary: The global cheese market is experiencing significant volatility, with Cheddar prices hitting $2.23/lb. In CME trading, their highest since November 2022 due to decreased milk supply and strategic production control. This trend mirrors international phenomena where German Gouda and Mozzarella prices have also surged, driven by declining milk output and rising global demand. Robust U.S. cheese exports, particularly to Mexico—which imported over 250 million pounds by July 2024, a 39% increase compared to 2023—and a recovering South Korean market underscore the robust international appetite for dairy. With new production capacities coming online and seasonal shifts in milk supply, staying informed and adaptable is crucial.
- Cheddar prices have surged to their highest levels since November 2022 due to reduced milk supply and strategic production management.
- Global cheese prices, including German Gouda and Mozzarella, have risen, driven by decreasing milk output and growing international demand.
- U.S. cheese exports remain strong, with notable increases in shipments to Mexico and recovering demand in South Korea.
- The total cheese export from the U.S. has been historically high, with over 100 million pounds shipped monthly during peak months in 2024.
- New production capacities and seasonal shifts in milk supply might influence future market trends, making it vital for dairy professionals to stay informed and adaptable.

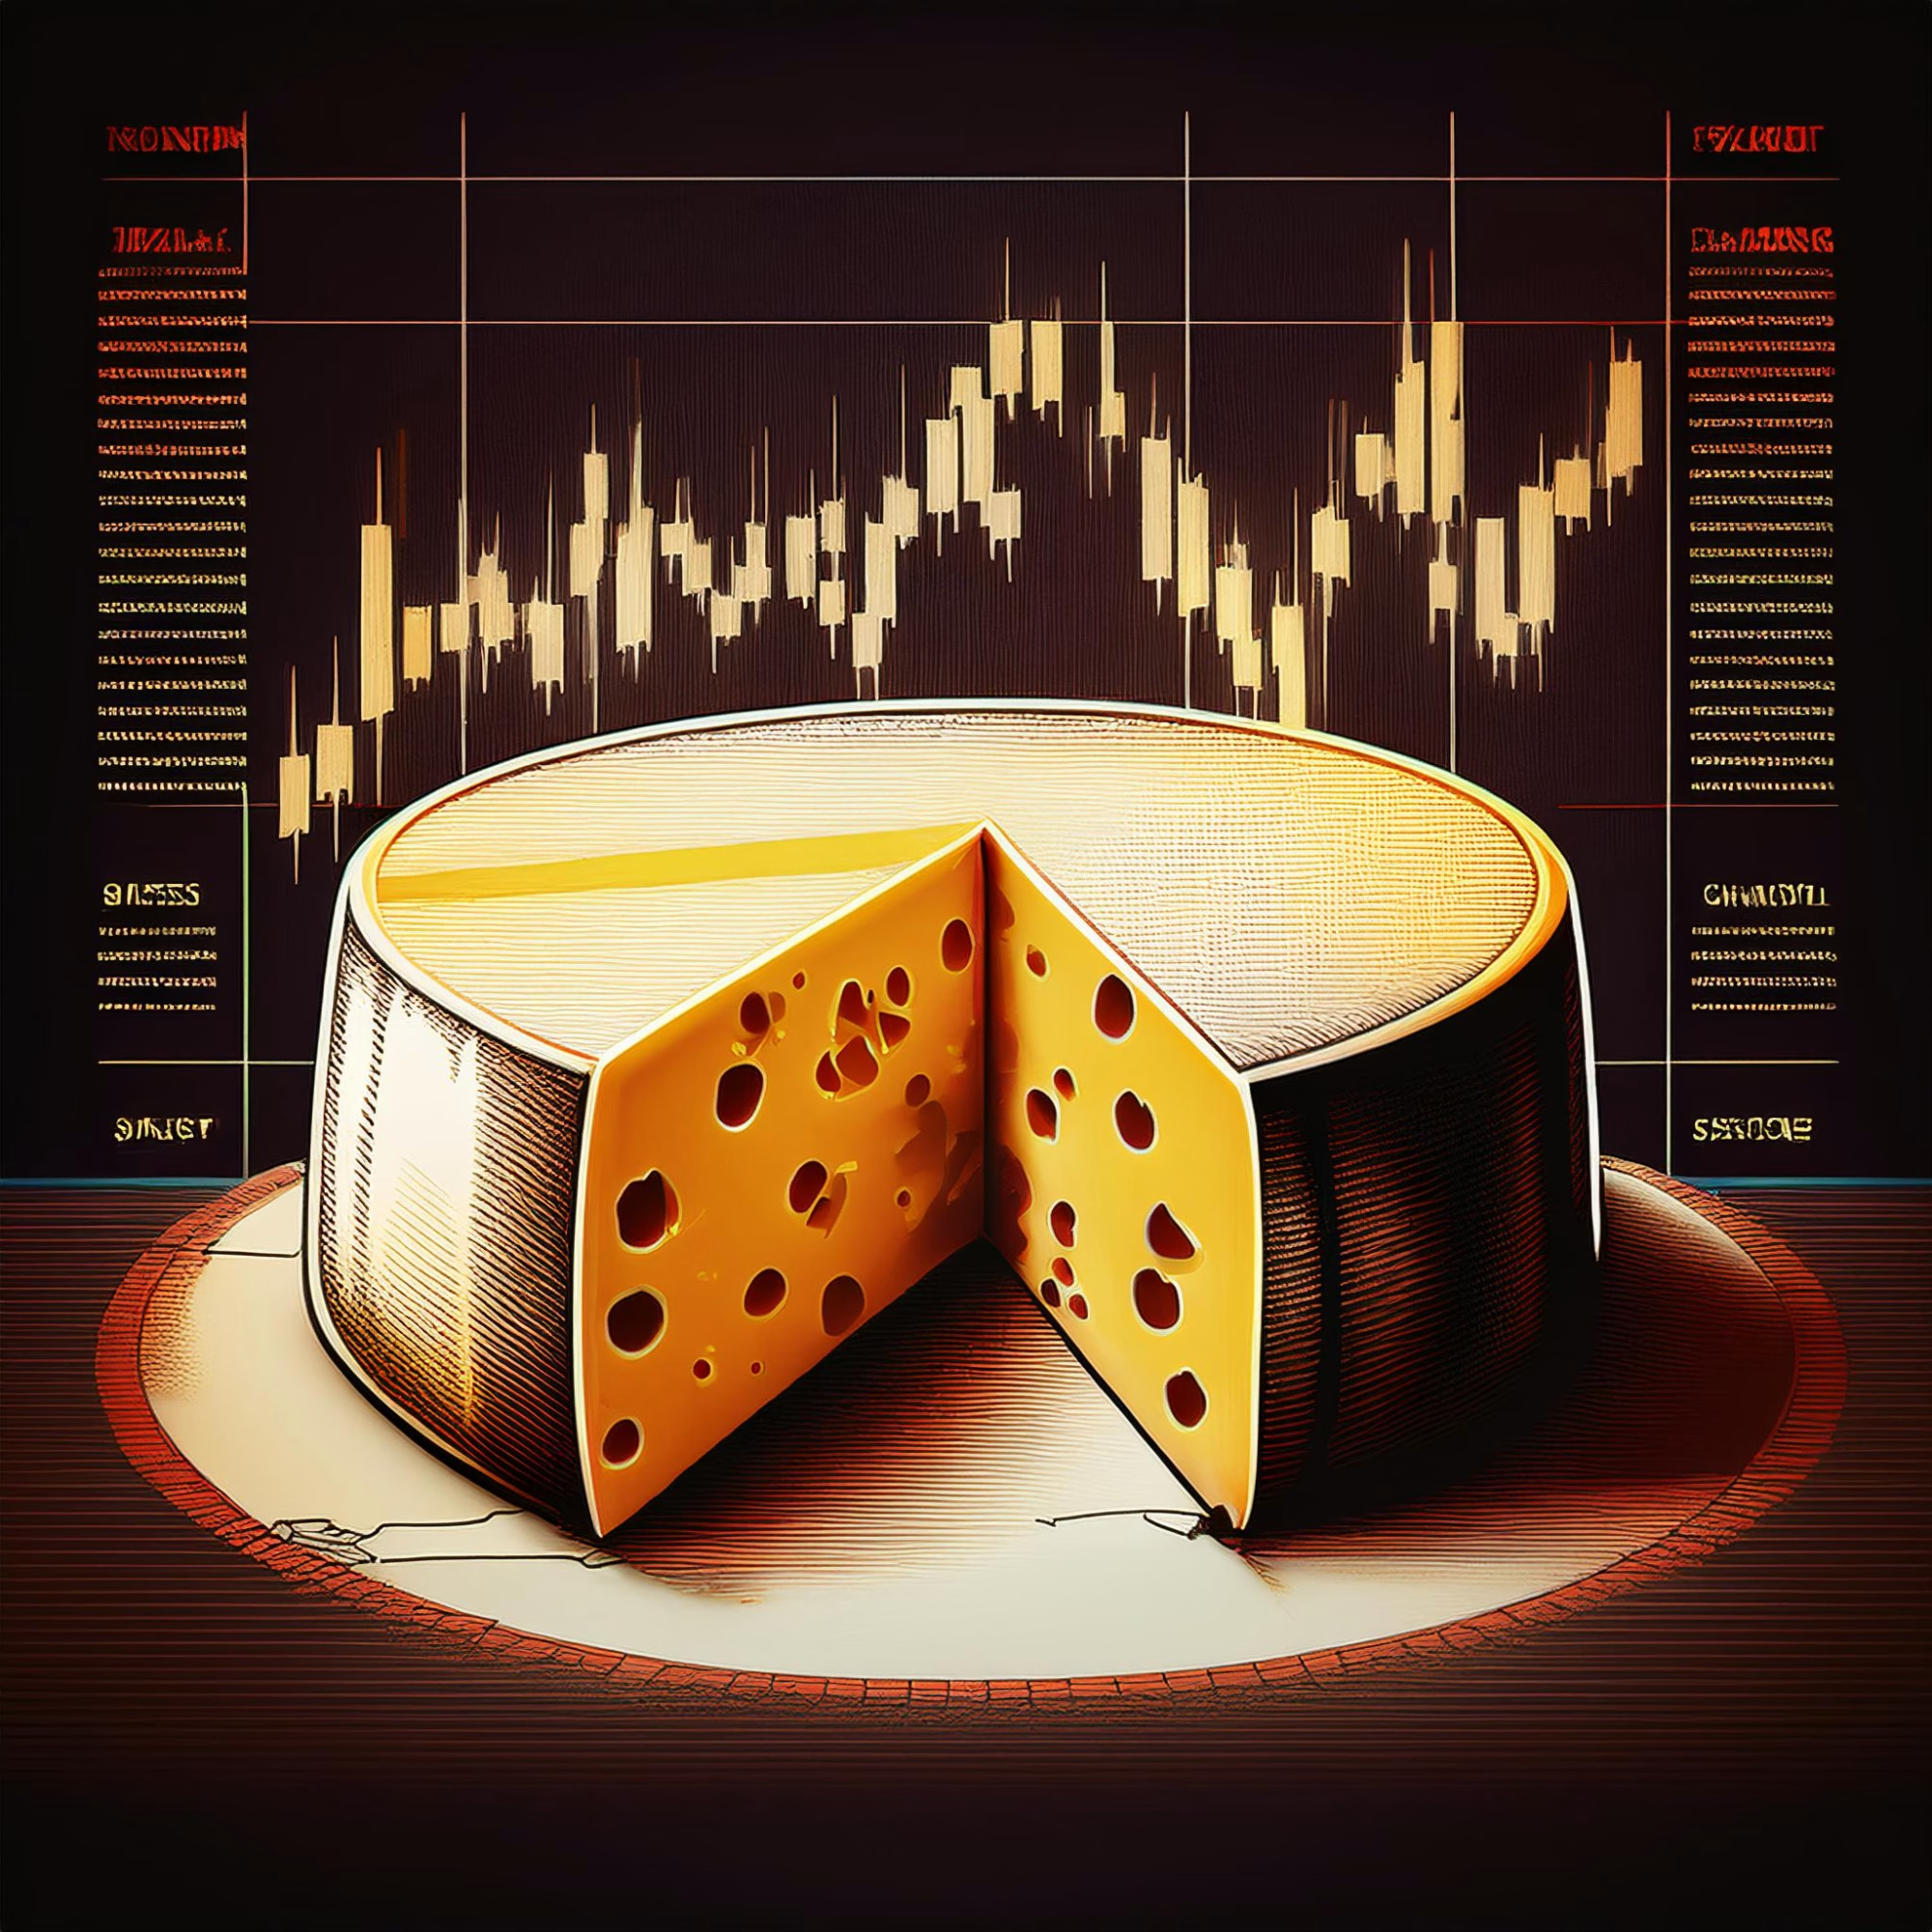
The worldwide cheese business is thriving like never before, with prices for popular types reaching new highs. Have you seen the recent price increases for Cheddar? Cheddar blocks hit $2.23/lb on the CME Wednesday, their highest price since November 2022. And it’s not just cheddar. German Gouda and Mozzarella are also skyrocketing, following a global trend of increased cheese prices. But why is this occurring, and should you care? It is critical for dairy farmers, and industry experts like yourself to remain current on these changes. Understanding the causes behind these price swings is exciting and crucial for making strategic choices, such as modifying production, diversifying product lines, or fine-tuning export tactics.
| Cheese Type | Current Price (per lb.) | Year-to-Date Production Change (%) | Top Export Destination | Export Volume (millions lbs) |
|---|---|---|---|---|
| Cheddar | $2.23 | -8% | Mexico | 250 |
| Barrels | $2.2825 | +2% | South Korea | 50 |
| Mozzarella | $1.85 | +5% | Japan | 70 |
| Gouda | $2.10 | +3% | Germany | 60 |
Cheddar Prices Surge: What’s Behind the Soaring Costs?
The cheese market in the United States has recently seen significant volatility. Cheddar blocks rose to $2.23 a pound, the highest price since November 2022. Barrels followed suit, rising to $2.2825 per pound in late August, the highest level in two years. What is causing this upswing?
One primary reason is a decreased milk supply. Dairy producers are experiencing restricted milk flow, requiring manufacturers to manage their production lines proactively. Cheddar cheese output has been down by 8% year-to-date through June compared to the same time in 2023. This lesser production has naturally reduced supply, causing prices to rise.
From this viewpoint, the decrease in Cheddar output is consistent with the overall loss in milk production. For 11 months in a row, milk output fell year on year until June. This tendency is not limited to the United States; it is a worldwide phenomenon. These milk supply limits are changing cheese markets and raising prices across all varieties of cheese.
The combination of restricted milk availability, careful production control by producers, and rising worldwide demand is creating a perfect storm of increasing Cheddar pricing. Understanding these market dynamics is crucial, as they will likely influence the industry for the foreseeable future, empowering you to make informed decisions.
Climbing Prices and Global Trends: A Close Look at the International Cheese Market
While the U.S. cheese business thrives, the overseas landscape is equally appealing. Global milk output has been declining, putting pressure on cheese prices. Global milk output dropped for 11 months until June, resulting in considerable price increases for different cheese varieties.
Take Mozzarella as an example. At this week’s Global Dairy Trade event, mozzarella prices rose. German Gouda followed suit, with prices at their highest since January 2023, according to CLAL statistics. These price rises indicate not just manufacturing issues but also strong demand.
CLAL states that European milk production has suffered severe damage, considerably increasing cheese costs. With less milk to transform into cheese, supply tightens, and prices eventually rise. If dealing in overseas markets, anticipate pricing trends to continue until milk output falls.
Mexico has shown a ravenous taste for U.S. cheese, buying over 250 million pounds by July 2024, a 39% increase over the same time in 2023. South Korean demand has also recovered. However, it has not been restored to levels recorded between 2018 and 2022. These trends suggest that the worldwide cheese business is thriving and becoming more intertwined with global supply and demand changes.
For additional in-depth information, consult trustworthy sources such as Global Dairy Trade and U.S. Dairy Export Council industry studies. They can give a more complete view of this dynamic industry, allowing you to remain ahead of the curve.
Global Appetite for U.S. Dairy: A Crucial Influence on Domestic Cheese Markets
International demand for U.S. cheese remains vital in setting up domestic cheese markets. Between March and July 2024, the United States exported significant amounts of cheese, reaching over 100 million pounds each month in the spring and continuing with over 85 million pounds in June and July. Mexico is the primary destination, with approximately 250 million pounds of U.S. cheese crossing the border through July, representing a 39% increase over the same time in 2023. This spike demonstrates Mexico’s unquenchable hunger for dairy products from the United States and the two countries’ successful trading connections.
South Korea likewise saw a recovery in cheese imports, albeit not to the extent observed from 2018 to 2022. Nonetheless, the increase from 2023’s lows is significant and indicates that the market’s demand is recovering. These export data, taken together, show a robust worldwide demand for American cheese.
Strong export demand and restricted milk supply cascade impact domestic cheese output and pricing. Manufacturers have had to balance their concentration on diverse cheese kinds, such as Mozzarella and Gouda, as the worldwide market demands. As a result, cheddar output fell 8% during the first half of 2024. The increased export activity, especially for other cheese kinds, restricted the domestic supply of Cheddar, causing prices to rise. This interaction demonstrates how global market dynamics may affect local agriculture yields and price patterns.
Why Has Cheddar Taken a Backseat? Exploring Production and Export Trends
Let us explore the Cheddar market further. Why has Cheddar had lower production and export figures than other cheeses like Mozzarella and Gouda? A crucial element is manufacturers’ careful manipulation of milk flows. Given the limited milk supply in 2024, producers have intentionally emphasized the creation of cheeses that are either in high demand or have more significant profits.
Furthermore, relative price dynamics have played a significant effect. The motivation to export Cheddar lessened as U.S. prices lost their edge over overseas markets. This move prompted exporters to concentrate on alternative types with better commercial prospects. For example, Mozzarella and Gouda have seen worldwide solid demand, pushing U.S. makers to deploy resources appropriately.
We also must recognize the seasonal and market-specific elements that influence Cheddar. Cheddar manufacturing has particular obstacles, including the necessity for longer age times and more severe quality control procedures. These complications may limit manufacturing capacity and increase total costs, making it less competitive in a high-demand, tight-supply environment.
As pricing and market circumstances change, Cheddar production and export dynamics will likely alter. This highlights the significance of being adaptable and receptive to market signals, a technique that dairy experts must carefully implement to navigate the ever-changing terrain of the global cheese industry. Your strategic decisions, such as modifying production, diversifying product lines, or fine-tuning export tactics, can significantly impact the industry’s future.
A Global Tug-of-War: Powerhouses vs. Niche Innovators
The worldwide cheese industry is a battlefield, with significant competitors constantly vying for control. Domestically, firms like Kraft Heinz and Saputo Inc. wield tremendous power, employing their massive distribution networks and strong brand awareness to gain most of the market share. On a global scale, companies with sophisticated manufacturing capabilities and savvy acquisitions, such as Groupe Lactalis in France and Royal FrieslandCampina in the Netherlands, have significant influence. Understanding this competitive landscape is crucial for industry professionals to make informed decisions and navigate the industry’s complexities.
Large-scale competition significantly influences market dynamics. Large firms profit from economies of scale, which enable them to make and sell cheese at a reduced cost. Investing in modern technologies and marketing tactics strengthens these organizations’ market position and gives them a competitive advantage. Consequently, businesses can better handle pricing volatility and supply chain interruptions, ensuring operational stability.
This highly competitive economy creates both obstacles and opportunities for small dairy producers. On the negative side, these sector heavyweights often wield negotiation power over milk pricing, placing smaller farmers at a competitive disadvantage. These farmers may need help to match their bigger rivals’ efficiency and market reach, resulting in lower profit margins.
However, there are several prospects for specialized markets and product uniqueness. Smaller farms may benefit from the increased customer demand for artisanal and organic cheeses. By emphasizing quality, distinct tastes, and sustainable procedures, these producers may build a dedicated consumer base ready to pay a premium for specialist items. Strategic relationships with local shops and direct-to-consumer sales channels, such as farmers’ markets and online platforms, may pave the way to success.
While the competitive environment benefits more prominent companies, it allows smaller dairy producers to innovate and seize specialized markets. To distinguish in an increasingly competitive environment, it is critical to remain agile, prioritize quality over quantity, and use unique selling propositions.
Anticipating the Future: Navigating Seasonal Shifts and New Capacities
As we look forward, the cheese market is expected to remain volatile. Milk supplies typically tighten throughout the autumn, worsened by the present production trends. This shortfall is expected to keep cheese prices rising, particularly for kids like Cheddar and Mozzarella, which have witnessed significant increases.
Furthermore, a new capacity that will become available later this year has the potential to transform the picture. Additional manufacturing capabilities may alleviate supply restrictions, stabilizing or reducing prices as we approach 2025. However, this will depend on how quickly and effectively these new plants can scale output.
The essential point is that although short-term price increases are inevitable, the medium—to long-term prognosis is more promising. Manufacturers and dairy producers should regularly monitor market signals and prepare for variations by being agile and adaptable as situations change.
The Bottom Line
Cheddar prices are skyrocketing due to constrained U.S. milk supply and lower production rates, a trend replicated internationally with falling milk yield and increasing cheese costs. International demand, especially in Mexico and South Korea, influences U.S. export strategy and local supply dynamics. As Cheddar takes a backseat, Mozzarella and Gouda gain traction, which may alter once additional production capacity is operational later this year. Keeping up with these market movements is critical for making educated selections.
Are you ready for the changing tides in the cheese market, or will you have to change your methods to stay up?
Learn more:
- Is the Summer Heat Finally Over? Dairy Farmers See Milk Production Stabilize, but Challenges Remain!
- Markets are not Bullish or Bearish, but Indecisive: Cheese Stocks Shrink Amid Soaring Milk Demand
- How Cheese Exports and China’s Demand are Powering the US Dairy Economy in 2024
 Join the Revolution!
 Join the Revolution!
Bullvine Daily is your essential e-zine for staying ahead in the dairy industry. With over 30,000 subscribers, we bring you the week’s top news, helping you manage tasks efficiently. Stay informed about milk production, tech adoption, and more, so you can concentrate on your dairy operations.