Archive for butterfat levels

Weekly Global Dairy Market Recap 03/03/25: Record Butterfat Meets Trade War Threat

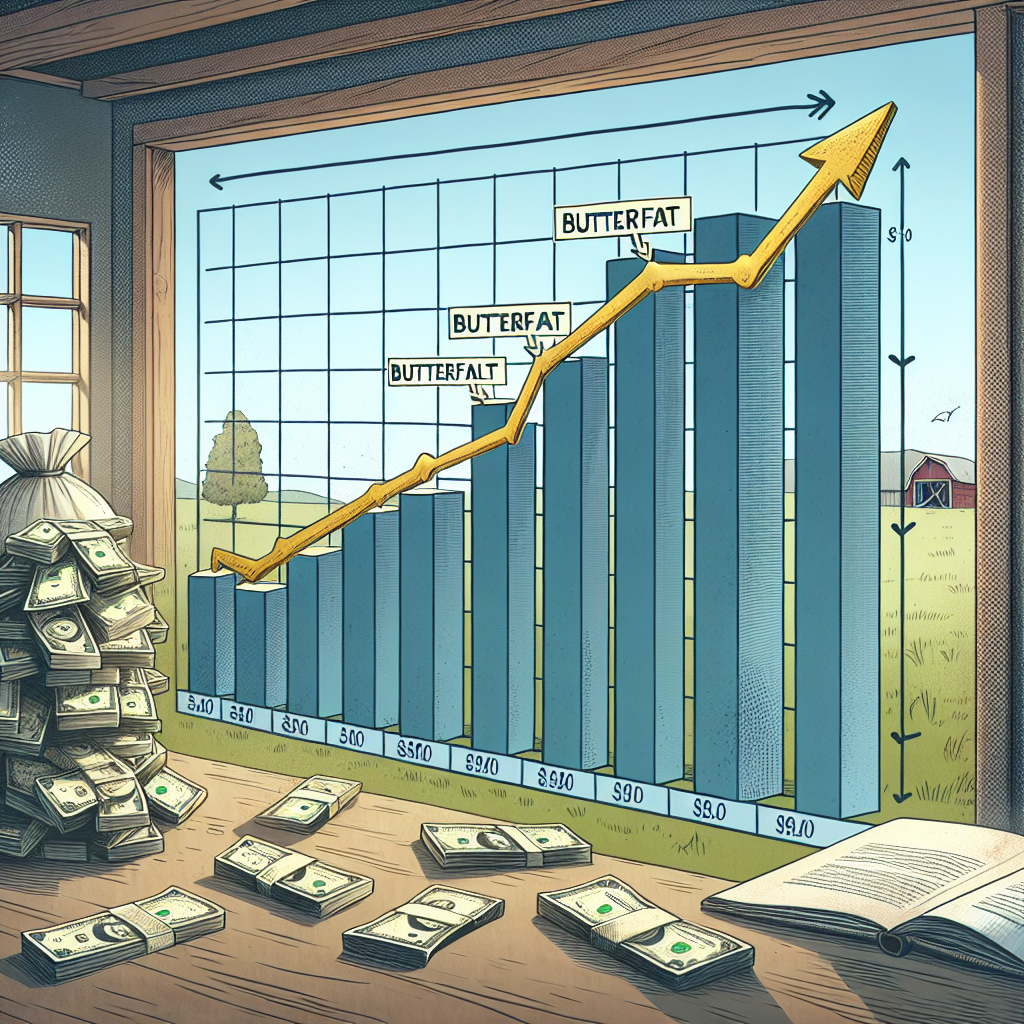
Dairy markets face unprecedented turmoil as record-breaking butterfat levels collide with looming trade war threats. With US milk hitting 4.46% fat and Trump’s 25% tariffs set to disrupt key export channels, processors scramble to adapt. Is your operation ready for this perfect biological revolution and geopolitical chaos storm?

Summary

The global dairy industry stands at a critical juncture as unprecedented biological advancements collide with geopolitical upheaval. Record-breaking milk component levels, exemplified by US butterfat reaching 4.46%, are overwhelming processing infrastructure designed for yesteryear’s milk composition. Simultaneously, President Trump’s impending 25% tariffs on Canadian and Mexican imports threaten to disrupt established trade patterns with the US dairy industry’s top export markets. This convergence of factors has created a paradoxical market where butter futures show surprising strength on European exchanges while cheese markets face mounting pressure in the US. Producers and processors alike must navigate this complex landscape, balancing the opportunities presented by component-rich milk against the challenges of processing bottlenecks and potential trade disruptions. Strategic priorities for industry stakeholders include reevaluating component optimization strategies, accelerating processing infrastructure investments, diversifying export markets, and implementing more sophisticated feed cost management approaches. The industry’s ability to adapt to these converging disruptions will determine which operations thrive in this new dairy production and trade era.

Key Takeaways

  • US milk butterfat levels hit an unprecedented 4.46% in January, challenging processing capabilities.
  • President Trump’s 25% tariffs on Canadian and Mexican imports, effective March 4, threaten key dairy export channels.
  • European butter futures are surprisingly strong, up 4.9% to €7,305, while other dairy commodities are under downward pressure.
  • Cheese inventories are 5.7% below year-ago levels, but prices are declining due to export uncertainty.
  • Butter cold storage surged 26% monthly, reaching 9.2% above January 2024.
  • USDA projects record 94 million acres of corn plantings, defying current bearish price signals.
  • Dairy producers must reevaluate component optimization strategies to align with processing constraints.
  • There is an urgent need for investment in processing infrastructure to handle increasingly component-rich milk.
  • Trade diversification beyond Mexico, China, and Canada is critical for risk mitigation.
  • Adaptive strategies and market intelligence are essential for navigating biological and geopolitical disruptions.
dairy market analysis, butterfat levels, dairy exports, tariff impact, milk production statistics

Are dairy processors prepared for the biological revolution in the milk tank? “Recent milkfat levels are like nothing they have ever witnessed,” report industry veterans watching butterfat content reach a mind-boggling 4.43% in January Federal Milk Marketing Orders. This unprecedented biological shift collides with potentially devastating trade policy developments as President Trump’s 25% tariffs on Canadian and Mexican imports activate tomorrow (March 4). The dairy industry faces a perfect storm where processing infrastructure designed for yesterday’s milk composition simultaneously meets geopolitical disruption threatening our top three export markets—Mexico, China, and Canada—.

Global Futures Market Performance: The Butter Anomaly

Last week, the European Energy Exchange (EEX) trading activity revealed a puzzling market contradiction that challenges conventional pricing relationships. While 9,030 tonnes (1,806 lots) changed hands across dairy products, butter futures demonstrated remarkable strength. The March-October 2025 strip advanced 4.9% to €7,305 even as SMP declined 2.8% to €2,603. This divergence contradicts traditional price coupling between fat and protein streams, suggesting sophisticated market participants anticipate structural shifts in global butterfat availability despite current processing bottlenecks.

ExchangeProductVolume TradedPrice Change (Mar-Oct strip)Current Price Level
EEXButter3,145 tonnes+4.9%€7,305
EEXSMP5,410 tonnes-2.8%€2,603
EEXWhey475 tonnesUnchanged€920
SGXWMP9,277 tonnes-0.9%$3,804
SGXSMP1,396 tonnes-2.0%$2,821
SGXAMF82 tonnes-0.1%$6,623
SGXButter179 tonnes-2.3%$6,672

The Singapore Exchange (SGX) reported substantial trading volumes (10,934 lots), but prices moved overwhelmingly in one direction—down. WMP dropped 0.9% to $3,804, SMP fell 2.0% to $2,821, AMF decreased marginally by 0.1% to $6,623, and butter retreated 2.3% to $6,672. This bearish sentiment on SGX contrasted with EEX butter strength suggests deep regional divergences in how markets view near-term supply-demand balance.

Implementation guidance: Forward-thinking dairy producers should carefully evaluate regional processing capacity constraints for high-fat milk before making genetic or nutrition adjustments aimed at further component increases. While EU markets currently reward additional butterfat, not all processing regions have the infrastructure to handle 4.4%+ butterfat milk efficiently.

European Valuations: Year-Over-Year Perspective Challenges

While weekly movements in European dairy quotations showed modest changes, the year-over-year comparison reveals market dynamics that defy conventional economic expectations. Butter is €1,289 (+22.0%) above last year despite supposedly adequate global supplies. Similar strength appears in WMP (+18.5 %) and cheese varieties (+10.4% to +16.9%), challenging the narrative that dairy markets are oversupplied or that inflationary pressures have subsided. Only SMP shows weakness (-0.8 %) compared to year-ago levels.

ProductCurrent PriceWeekly ChangeY/Y Change
Butter (EU avg)€7,136-€12 (-0.2%)+€1,289 (+22.0%)
SMP (EU avg)€2,503+€3 (+0.1%)-€19 (-0.8%)
Whey (EU avg)€904Unchanged+€184 (+25.6%)
WMP (EU avg)€4,335-€32 (-0.7%)+€677 (+18.5%)
Cheddar Curd€4,755-€45 (-0.9%)+€686 (+16.9%)
Mild Cheddar€4,782-€22 (-0.5%)+€677 (+16.5%)
Young Gouda€4,307-€17 (-0.4%)+€406 (+10.4%)
Mozzarella€4,071+€2 (+0.0%)+€521 (+14.7%)

What explains this massive price appreciation amid modest production growth? The traditional supply-demand equation appears insufficient. European processing capacity constraints, regulatory impacts on production, and shifting consumer preferences toward higher-fat products may create structural support for prices that contradict conventional market analysis expecting mean reversion.

Implementation guidance: Producers should resist the urge to hedge heavily against expected price declines that may not materialize. The persistent strength across multiple fat-containing products suggests structural rather than cyclical price support, warranting strategic rather than tactical risk management approaches.

Global Milk Production: Component Revolution

Milk production data from January 2025 reveal an unprecedented revolution in milk composition that our industry has failed to prepare adequately. While fluid milk volume increases remain modest across major producing regions, the component story differs dramatically.

RegionButterfat %Protein %Y/Y Change in Milk VolumeY/Y Change in Milksolids
United States4.46%3.41%+0.1%+2.2%
United Kingdom4.39%3.41%+4.3%+4.5%
Australia4.24%3.38%-2.7%-1.8%
Netherlands4.66%N/A-1.7%-1.0% (fat only)
PolandN/AN/A+2.3%N/A
ItalyN/AN/A-0.6%+0.7%

US milk components have reached extraordinary levels at 4.46% butterfat and 3.41% protein, increasing milk solid collections by 2.2% despite fluid volume growth of just 0.1%. This pattern repeats across multiple regions, with component levels consistently exceeding historical averages. The UK reports 4.39% butterfat and 3.41% protein, while Dutch milk contains an astounding 4.66% butterfat.

Have we reached peak genetic potential for components, or is this the beginning of a biological revolution in milk composition? The processing infrastructure built for 3.5-4.0% butterfat milk is proving inadequate, creating bottlenecks that pressure producer prices despite strong finished product values.

Implementation guidance: Producers should calculate their “component-adjusted basis” when comparing their production against benchmarks, as raw volume comparisons increasingly misrepresent actual milk solids production. Additionally, negotiate supply agreements that properly value components based on processing capacity in your region, as some plants may discount excessively high components they cannot efficiently process.

US Market Crisis: Tariffs Meet Processing Constraints

The US dairy industry faces an unprecedented convergence of challenges that could fundamentally reshape market dynamics. President Trump’s confirmation that 25% tariffs on Canadian and Mexican imports will activate on March 4 threatens established export channels representing billions in dairy trade. The potential for retaliatory tariffs from Mexico (our largest export market), China (second largest), and Canada (third largest) creates massive uncertainty just as domestic production constraints intensify.

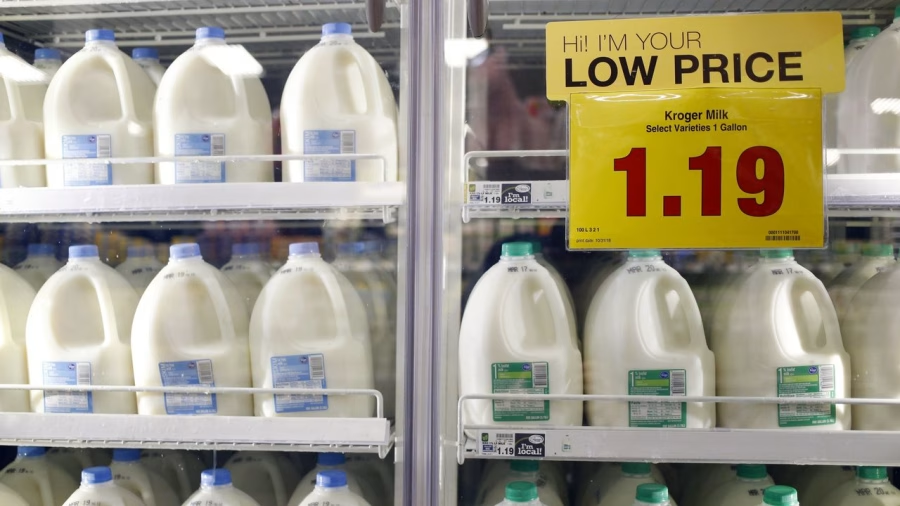
The cheese market initially demonstrated resilience before succumbing to downward pressure, with CME spot Cheddar blocks plunging 12.5¢ to $1.775 per pound. Despite this decline, cold storage data reveals an intriguing contradiction—cheese inventories remain 5.7% below year-ago levels, with American-style cheese stocks down 7.4% to their lowest January volume since 2018. This tightness should support prices in a rational market, but fear of trade disruption with Mexico has overwhelmed fundamental analysis.

Meanwhile, the butter market faces a crisis stemming from unprecedented butterfat levels in farm milk. Industry contacts report processing bottlenecks throughout the supply chain, with “cream suppliers under significant pressure to find homes” and “butter plants backed up” with delays “exceeding post-holiday levels of inflows.” Cold storage data confirms this production surge, with butter inventories jumping 26% in a month to reach 270.28 million pounds, 9.2% above January 2024. Despite strong demand, this supply pressure pushed CME spot butter down 7¢ to $2.345 per pound.

Implementation guidance: Dairy producers selling into export-dependent channels should immediately review their milk buyers’ exposure to Mexican, Chinese, and Canadian markets. Those heavily dependent on these channels should explore diversification options or risk management tools to mitigate potential market disruptions. Additionally, producers should prioritize quality metrics beyond just component levels, as processing constraints may increasingly discount milk with extreme component values that create handling challenges.

Feed Market Developments: Contradicting Conventional Signals

The USDA’s preliminary acreage projections challenge conventional wisdom about crop economics and farmer decision-making. Despite relatively unattractive returns at current price levels, farmers are projected to plant 94 million acres of corn this spring, up significantly from 90.6 million acres last year and representing one of the highest corn seedings in the past decade. This increased corn acreage comes at the expense of soybeans, projected at 84 million acres, down from 87.1 million in 2024.

Why would farmers expand corn production when markets show clear bearish signals? May corn futures closed at $4.695 per bushel, down more than 35¢ for the week, while May soybeans dropped 32¢ to $10.25 and soybean meal declined $4 to $300 per ton. The conventional narrative suggesting farmers plant based on price signals appears increasingly questionable.

This acreage shift may reflect deeper structural factors, including risk management strategies, input cost considerations, crop rotation benefits, and regional adaptations to changing climate patterns. If realized, this expanded corn acreage could produce a record 15.6 billion bushel harvest, assuming trendline yields of 181 bushels per acre.

Implementation guidance: Dairy producers should resist the temptation to forward contract substantial feed needs at current prices despite their apparent value. The projected acreage expansion and improved South American weather suggest significant downside potential for feed costs later in 2025. Consider implementing a graduated purchasing strategy that secures only 30-40% of needs before planting progress reports, keeping sufficient flexibility to take advantage of potential summer price weakness.

Strategic Reset: Navigating Converging Disruptions

The dairy industry must fundamentally rethink conventional approaches facing converging disruptions across multiple fronts. The biological revolution in milk components has rendered many processing facilities inadequate, just as geopolitical tensions threaten to disrupt established trade patterns. This requires a strategic reset across several dimensions:

Trade diversification has become an immediate necessity rather than a long-term aspiration. The concentration risk is unacceptable, with Mexico, China, and Canada collectively representing over 60% of US dairy exports. Forward-thinking processors have already accelerated market development in Southeast Asia, the Middle East, and Latin America, unaffected by current tariff disputes. Producers should prioritize relationships with processors demonstrating diversified market exposure.

Component optimization strategies must evolve beyond simplistic “more is better” approaches. The record-breaking components now seen across multiple regions have created processing bottlenecks that paradoxically devalue the very components being produced. Dairy operations should implement precision nutrition programs that optimize component production based on actual processor capacity and payment systems rather than theoretical component values.

Processing infrastructure investment represents the most significant opportunity in the current environment. The mismatch between milk composition and processing capacity has created bottlenecks that depress producer returns despite strong finished product markets. Forward-thinking cooperatives and processors who rapidly expand their capacity to handle high-component milk will gain competitive advantages in procurement and finished product markets.

Feed cost management requires abandoning conventional seasonality assumptions as climate change and geopolitical tensions create new market patterns. The projected record corn acreage suggests waiting for harvest pressure before making substantial purchases, but trade disruptions could create unexpected price volatility regardless of supply fundamentals. Implement staggered purchasing strategies with trigger points based on technical signals rather than calendar dates.

Outlook: Biological Revolution Meets Geopolitical Disruption

The global dairy landscape is undergoing transformative change as the biological revolution in milk composition collides with geopolitical disruptions of established trade patterns. In the coming months, market segmentation based on processing capability, export exposure, and component handling capacity will likely increase.

Given the imminent trade disruptions that could simultaneously affect our top three export markets, dairy producers should immediately evaluate milk buyer stability. Those selling to processors heavily dependent on Mexican, Chinese, or Canadian markets face heightened risk, requiring immediate risk management attention.

The longer-term strategic challenge involves aligning production systems with the rapidly evolving processing infrastructure needed to handle increasingly component-rich milk. The current bottlenecks reflect an industry unprepared for the biological revolution in the milk tank, with genetics and nutrition advancements outpacing processing technology investments.

Forward-thinking producers will increasingly differentiate themselves by optimizing not just production volume or components but also the specific attributes most valued by their particular processor and end market. This more sophisticated approach requires more profound engagement with downstream supply chain partners and more nuanced production strategies than the industry has historically employed.

As we navigate these converging disruptions, flexibility and market intelligence will prove more valuable than rigid production systems optimized for yesterday’s market conditions. The industry’s adaptability to these biological and geopolitical revolutions will determine which operations thrive during this period of transformative change.

Learn more

Join the Revolution!

Bullvine Daily is your essential e-zine for staying ahead in the dairy industry. With over 30,000 subscribers, we bring you the week’s top news, helping you manage tasks efficiently. Stay informed about milk production, tech adoption, and more, so you can concentrate on your dairy operations.

NewsSubscribe
First
Last
Consent

Skyrocketing Milk Prices and Butterfat Levels Boost Earnings

Find out how rising milk prices and high butterfat levels are driving up dairy farmers’ profits. Want to know the latest trends and stats? Read our in-depth analysis.

Summary: Have you been keeping an eye on your dairy margins lately? If not, you might be in for a pleasant surprise. August has brought about some noteworthy improvements for dairy farmers, particularly those who have invested wisely in their marketing periods. Profitability has seen a much-needed boost, with milk prices soaring and feed costs holding steady. Curious about the specifics? Let’s dive into the cheese market, where block and barrel prices have hit their highest since October 2022, driven by a drop in cheddar cheese production. This tightening of spot supplies has resulted in firmer prices and unique challenges and opportunities for dairy farmers. And there’s more—while milk production is down, butterfat levels and butter production are smashing records. Cheese production in June dropped 1.4% from the prior year to 1.161 billion pounds, with cheddar production down 9% from 2023 and marking the eighth consecutive monthly decline. This allows dairy producers to capitalize on these quality advances while navigating the challenges of decreased milk quantities. But it’s not just about dairy: changes in crop yields for corn and soybeans also influence feed costs, shaping the broader landscape of your financial well-being. According to the USDA’s August WASDE report, lower soybean meal prices may benefit dairy businesses as feed is a substantial expenditure. In conclusion, higher milk prices and stable feed costs have created an optimistic scenario for dairy margins. The recovery in the cheese market and rising butterfat levels in the face of decreased milk output present complex but attractive options. Dairy producers must be vigilant and respond promptly to changing circumstances, as historically high margins provide ample space for increased profitability.

  • Dairy margins saw improvement in early August due to higher milk prices and steady feed costs.
  • Block and barrel cheese prices reached their highest since October 2022, mainly due to reduced cheddar cheese production.
  • Cheese production in June 2023 fell 1.4% from the previous year, with cheddar production down 9%.
  • Butterfat levels and butter production are at record highs despite the decline in milk production.
  • USDA’s August WASDE report indicates lower soybean meal prices, potentially reducing feed costs for dairy farmers.
  • The current favorable conditions in milk prices and feed costs offer a chance for higher profitability in the dairy industry.
dairy margins, increased, first half of August, rising milk prices, record butterfat levels, profitability, respite, constant feed expenses, dairy market, difficulties, opportunities, balanced equation, total margins, farmers, businesses, cheese market, CME Class III Milk futures, record highs, cheddar cheese output, spot supply, prices, high temperatures, herd health difficulties, avian flu pandemic, cheddar yield, tighter spot supply, butterfat levels, milk output, quality advances, profitability, efficiency, processing, USDA, August WASDE report, yield, production predictions, maize, soybeans, corn-ending stockpiles, harvested acres, predicted demand, soybean meal prices, feed costs, dairy businesses, higher milk prices, stable feed costs, optimistic scenario, recovery, cheese market, rising butterfat levels, decreased milk output, complicated options, shifting crop yields, strategic planning, dairy producers, changing circumstances, historically high margins, profitability, profit margins, techniques, optimize profits, dairy operations, future success.

Have you observed any recent changes to your milk checks? You could be wondering why your earnings have suddenly improved. Well, it’s not all luck. Dairy margins have increased considerably in the first half of August, owing to rising milk prices and record butterfat levels. This increase boosts profitability and provides a much-needed respite from the constant feed expenses. But what is truly driving this favorable shift? Let’s go into the specifics and examine how these changes affect the dairy industry.

Surging Milk Prices and Steady Feed Costs: A Recipe for Improved Dairy Margins 

The dairy market is navigating a complicated terrain full of difficulties and opportunities. Dairy margins improved significantly in the first half of August, primarily due to rising milk prices. Due to solid cheese market dynamics, dairy producers are better positioned as CME Class III Milk futures rise. Even though feed prices have stayed consistent, this constancy has been critical in increasing profitability. The rise in milk prices and steady feed costs provide a balanced equation that improves total margins, allowing farmers to run their businesses more successfully despite continued problems.

Have You Noticed What’s Happening in the Cheese Market? It’s Been Quite a Ride Lately. 

Have you observed what’s going on in the cheese market? It’s been quite the trip lately. The CME Class III Milk futures have gained dramatically owing to a strong cheese market. Last week, block and barrel prices at the CME reached record highs not seen since October 2022. This increase is primarily due to a decline in cheddar cheese output, which has reduced spot supply and caused prices to rise in recent weeks.

Cheddar output, in particular, has been declining steadily, down 9% since 2023. This is the sixth straight monthly decline. Several variables contribute to this tendency, including high temperatures and persistent herd health difficulties associated with the avian flu pandemic. These factors have produced a perfect storm, drastically reducing cheddar yield.

Consequently, lower output has resulted in tighter spot supply and higher pricing. The drop in cheese output adds another layer of complexity to the market, making it critical for dairy producers to remain knowledgeable and adaptable. Are you ready for these upheavals in the cheese market?

Did You Know? Rising Butterfat Levels Amid Declining Milk Production 

Did you know that, although total milk output has decreased, butterfat levels in milk have increased significantly? This may appear paradoxical at first look, yet it is correct. Butterfat percentages have reached all-time highs, regularly outperforming previous year fat tests since June 2020. What drives this phenomenon?

While overall U.S. milk production is down 0.9% year over year through June, the lowest level in four years, the quality of the milk produced is impressive. Butter output in June increased by 2.8% from the previous year to 169.15 million pounds due to rising butterfat content, demonstrating the industry’s flexibility and resilience.

This increase in butterfat levels has given a silver lining among the difficulties. With butterfat percentages at an all-time high, dairy producers may capitalize on these quality advances while navigating the challenges of decreased milk quantities. This potential maximizes profitability and efficiency in processing, guaranteeing that each drop of milk produces the best possible return. The rise in butterfat levels enhances the quality of dairy products and provides an opportunity for dairy producers to adjust their production strategies to maximize profitability.

Ever Considered How Crop Yields Influence Your Feed Costs?

Let’s take a quick look at feed expenses and crop yields. Have you looked at the USDA’s August WASDE report? It’s quite an eye-opener! They have increased yield and production predictions for maize and soybeans. But what does this imply for us in the dairy farming industry?

For openers, predicted corn-ending stockpiles have decreased marginally. This is mainly owing to fewer harvested acres and increased predicted demand. Less maize will be available, which may keep feed prices flat or raise them somewhat.

Conversely, since July, soybean ending stockpiles have risen dramatically by 135 million bushels. This spike has placed downward pressure on soybean meal costs, giving your feed budget some breathing space. Lowering soybean meal prices may be beneficial since feed is a substantial expenditure for dairy businesses. How will you modify your feeding plan in light of these changes?

The Bottom Line

As previously discussed, higher milk prices and stable feed costs have produced an optimistic scenario for dairy margins. The current recovery in the cheese market and rising butterfat levels in the face of decreased milk output present complicated but attractive options. These options include adjusting production strategies to focus on high-butterfat products, optimizing feed plans to take advantage of changing crop yields, and closely monitoring market dynamics to make informed pricing decisions. Furthermore, shifting crop yields influence feed costs, emphasizing the need for strategic planning.

Dairy producers must be watchful and respond promptly to these changing circumstances. With historically high margins, there is plenty of space to strategize for increased profitability. How will you take advantage of these large profit margins? What techniques will you use to optimize your profits? We encourage you to share your strategies and learn from each other, as the answers to these questions guide your dairy operation’s future success.

Learn more: 

Why Are Class III Milk Prices So Low? Causes, Consequences, and Solutions

Uncover the factors behind the low Class III milk prices and delve into practical measures to enhance milk protein and butterfat content. What strategies can producers and processors implement for adaptation?

The U.S. dairy industry faces a critical challenge: persistently low Class III milk prices. These prices, which comprise over 50% of the nation’s milk usage and are primarily used for cheese production, are vital for the economic stability of dairy farmers and the broader market. The current price indices reveal that Class III milk prices align with the average of the past 25 years, raising concerns about profitability and sustainability. This situation underscores the urgent need for all stakeholders in the dairy industry to come together, collaborate, and explore the underlying factors and potential strategies for improvement.

Class III Milk Prices: A Quarter-Century of Peaks and Troughs

Over the past 25 years, Class III milk prices have fluctuated significantly, reflecting the dairy industry’s volatility. Prices have hovered around an average value, influenced by supply and demand, production costs, and economic conditions. 

In the early 2000s, prices rose due to increased demand for cheese and other dairy products. However, the 2008 financial crisis led to a sharp decline as consumer demand dropped and exporters faced challenges. 

Post-crisis recovery saw gradual price improvements but with ongoing unpredictability. Stability in the mid-2010s was periodically interrupted by export market changes, feed cost fluctuations, and climatic impacts on milk production. Increased production costs from 2015 to 2020 and COVID-19 disruptions further pressured prices. 

In summary, while the average Class III milk price may seem stable over the past 25 years, the market has experienced significant volatility. Understanding these trends is not just important; it’s critical for navigating current pricing issues and strategizing for future stability. This understanding empowers us to make informed decisions and take proactive steps to address the challenges in the dairy industry.

The Core Components of Class III Milk Pricing: Butterfat, Milk Protein, and Other Solids

Examining Class III milk prices reveals crucial trends. Due to high demand and limited supply, butterfat prices have soared 76% above their 25-year averages. Meanwhile, milk protein prices have dropped by 32%, impacting the overall Class III price, essential for cheese production. Other solids, contributing less to pricing, have remained stable. These disparities call for strategic adjustments in pricing formulas to better align with market conditions and ensure sustainable revenues for producers.

Dissecting the Price Dynamics of Butter, Cheese, and Dry Whey in Class III Milk Pricing 

The prices of butter, cheese, and dry whey are crucial to understanding milk protein prices and the current state of Class III milk pricing

Butter prices have skyrocketed by 70% over the 25-year average due to increased consumer demand and tighter inventories. This marks a significant shift from its historically stable pricing. 

Cheese prices have increased slightly, indicating steady demand both domestically and internationally. This trend reflects strong export markets and stable milk production, aligning closely with historical averages. 

In contrast, dry whey prices have remained steady, reflecting its role as a stable commodity in the dairy sector—consistent demand in food manufacturing and as a nutritional supplement balances any supply fluctuations from cheese production. 

Together, these trends showcase the market pressures and consumer preferences affecting milk protein prices. Understanding these dynamics is critical to tackling the broader challenges in Class III milk pricing.

Decoding the USDA Formula: The Intricacies of Milk Protein Pricing in Class III Milk

Understanding Class III milk pricing requires examining the USDA’s formula for milk protein. This formula blends two critical components: the price of cheese and the butterfat value of cheese compared to butter. 

Protein Price = ((Cheese Price – 0.2003) x 1.383) + ((((Cheese Price – 0.2003) x 1.572) – Butterfat Price x 0.9) x 1.17) 

The first part, ((Cheese Price—0.2003) x 1.383) depends on the cheese market price, which has been adjusted slightly by $0.2003. Higher cheese prices generally boost milk protein prices. 

The second part, ((((Cheese Price – 0.2003) x 1.572) – Butterfat Price x 0.9) x 1.17), is more intricate. It adjusts the cheese price by 1.572, subtracts 90% of the butterfat price, and scales the result by 1.17 to match industry norms. 

This formula was based on the assumption that butterfat’s value in cheese would always exceed that in butter. With butterfat fetching higher prices due to increased demand and limited supply, the formula undervalues protein from cheese. This mismatch has led to stagnant protein prices despite rising butter and cheese prices. 

The formula must be reevaluated to align with today’s market, ensuring fair producer compensation and market stability.

Unraveling the Web of Stagnant Pricing in Class III Milk

Stagnant pricing in Class III milk can be traced to several intertwined factors. Inflation is a key culprit, having significantly raised production costs for dairy farmers over the past 25 years—these increasing expenses span wages, health premiums, utilities, and packaging materials. Yet, the value received for Class III milk has not kept pace, resulting in a perceived price stagnation. 

Another factor is the shift in the value relationship between butterfat and cheese. Historically, butterfat’s worth was higher in cheese production than in butter, a dynamic in the USDA pricing formula for milk protein. Today’s market conditions have reversed this, with butterfat now more valuable in butter than in cheese. Consequently, heavily based on cheese prices, the existing formula must adapt better, contributing to stagnant milk protein prices. 

Also impacting this situation are modest increases in cheese prices compared to the substantial rise in butterfat prices. The stable prices of dry whey further exert minimal impact on Class III milk prices. 

Addressing these challenges requires a multifaceted approach, such as reconsidering USDA pricing formulas and strategically managing dairy production and processing to align with current market realities.

Class III Milk Producers: Navigating Low Prices through Strategic Adaptations

Class III milk producers have adapted to persistently low prices through critical strategies. Over the past 25 years, many have expanded their herds to leverage economies of scale, reducing costs per gallon by spreading fixed costs over more milk units. 

Additionally, increased milk production per cow has been achieved through breeding, nutrition, and herd management advances. Focusing on genetic selection, high-productivity cows are bred, further optimizing dairy operations

Automation has also transformed dairy farming, with robotic milking systems and feeding solutions reducing labor costs and improving efficiency. These technologies help manage larger herds without proportional labor increases, counteracting low milk prices. 

Focusing on higher milk solids, particularly butterfat, and protein, offers a competitive edge. Producers achieve higher milk quality by enhancing feed formulations and precise nutrition, yielding better prices in markets with high-solid content.

An Integrated Strategy for Optimizing Class III Milk Prices

Improving Class III milk prices requires optimizing production and management across the dairy supply chain. Increasing butterfat levels in all milk classes can help align supply with demand, especially targeting regions with lower butterfat production, like Florida. This coordinated effort can potentially lower butterfat prices and stabilize them. 

Balancing protein and butterfat ratios in Class III milk is crucial. Enhancing both components can increase cheese yield efficiency, reduce the milk needed for production, and lower costs. This can also lead to better control of cheese inventories, supporting higher wholesale prices. 

Effective inventory management is critical. Advanced systems and predictive analytics can help producers regulate supply, prevent glutes, and stabilize prices. Maintaining a balance between supply and demand is crucial for the dairy sector’s economic health. 

These goals require collaboration among producers, processors, and organizations like Ohio State University Extension, which provides essential research and services. Modernizing Federal Milk Marketing Orders (FMMO) to reflect current market realities is also vital for fair pricing. 

Addressing Class III milk pricing challenges means using technology, improving farm practices, and fine-tuning the supply chain. Comprehensive strategies are essential for price stabilization, benefiting all stakeholders.

Strategic Collaborations: Empowering Stakeholders to Thrive in the Class III Milk Market

Organizations and suppliers play a critical role in optimizing Class III milk prices. Entities like Penn State Extension, in collaboration with the Pennsylvania Department of Agriculture and the USDA’s Risk Management Agency, offer valuable resources and guidance. These organizations provide educational programs to help dairy farmers understand market trends and best practices in milk production. 

The Ohio State University Extension and specialists like Jason Hartschuh advance dairy management and precision livestock technologies, sharing research and providing hands-on support to enhance milk production processes. 

The FMMO (Federal Milk Marketing Order) modernization process aims to update milk pricing regulations, ensuring a more equitable and efficient market system. Producers’ participation through referendums is crucial for representing their interests. 

Processors should work with packaging suppliers to manage material costs, establish contracts to mitigate financial pressures and maintain stable operational costs

These collaborations offer numerous benefits: improved milk yield and quality, better financial stability, and a balanced supply-demand dynamic for butterfat and protein. Processors benefit from consistent milk supplies and reduced production costs. 

In conclusion, educational institutions, agricultural agencies, and strategic supply chain collaborations can significantly enhance the Class III milk market, equipping producers and processors to handle market fluctuations and achieve sustainable growth.

The Bottom Line

The low-Class III milk prices, driven by plummeting milk protein prices and stagnant other solids pricing, highlight an outdated USDA formula that misjudges current market conditions where butterfat is valued more in butter than in cheese. Compared to the past 25 years, inflation-adjusted stagnation underscores the need for efficiency in milk production via larger herds, higher yields per cow, and automation. 

To address these issues, increasing butterfat and protein levels in Class III milk will improve cheese yield and better manage inventories. Engaging organizations and suppliers in these strategic adjustments is crucial. Fixing the pricing formula and balancing supply and demand is essential to sustaining the dairy industry, protecting producers’ economic stability, and securing the broader dairy supply chain.

Key Takeaways:

  • Class III milk, primarily used for cheese production, constitutes over 50% of U.S. milk consumption.
  • Despite an increase in butterfat prices by 76%, milk protein prices have plummeted by 32% compared to the 25-year average.
  • The USDA formula for milk protein pricing is a critical factor, with its reliance on cheese and butterfat values leading to current pricing challenges.
  • Inflation over the last 25 years contrasts sharply with stagnant Class III milk prices, necessitating strategic adaptations by producers.
  • Key strategies for producers include increasing butterfat levels, improving protein levels, and tighter inventory management for cheese production.
  • Collaborations between producers and processors are essential to drive changes and stabilize Class III milk prices.

Summary:

The U.S. dairy industry is grappling with a significant challenge: persistently low Class III milk prices, which account for over 50% of the nation’s milk usage and are primarily used for cheese production. These prices align with the average of the past 25 years, raising concerns about profitability and sustainability. Over the past 25 years, Class III milk prices have fluctuated significantly, reflecting the dairy industry’s volatility.

In the early 2000s, prices rose due to increased demand for cheese and other dairy products. However, the 2008 financial crisis led to a sharp decline as consumer demand dropped and exporters faced challenges. Post-crisis recovery saw gradual price improvements but with ongoing unpredictability. Stability in the mid-2010s was periodically interrupted by export market changes, feed cost fluctuations, and climatic impacts on milk production. Increased production costs from 2015 to 2020 and COVID-19 disruptions further pressured prices.

The core components of Class III milk pricing include butterfat, milk protein, and other solids. Butterfat prices have soared 76% above their 25-year averages due to high demand and limited supply, while milk protein prices have dropped by 32%, impacting the overall Class III price, essential for cheese production. Other solids, contributing less to pricing, have remained stable.

Understanding the price dynamics of butter, cheese, and dry whey in Class III milk pricing is crucial for navigating current pricing issues and strategizing for future stability. Butter prices have skyrocketed by 70% over the 25-year average due to increased consumer demand and tighter inventories. Cheese prices have increased slightly, indicating steady demand both domestically and internationally, while dry whey prices have remained steady, reflecting its role as a stable commodity in the dairy sector.

Understanding Class III milk pricing requires examining the USDA’s formula for milk protein, which blends two critical components: the price of cheese and the butterfat value of cheese compared to butter. This formula undervalues protein from cheese, leading to stagnant protein prices despite rising butter and cheese prices. The formula must be reevaluated to align with today’s market, ensuring fair producer compensation and market stability.

The stagnant pricing in Class III milk can be attributed to several factors, including inflation, the shift in the value relationship between butterfat and cheese, and modest increases in cheese prices. To address these challenges, a multifaceted approach is needed, such as reconsidering USDA pricing formulas and strategically managing dairy production and processing to align with current market realities.

Class III milk producers have adapted to persistently low prices through critical strategies, such as expanding herds to leverage economies of scale, increasing milk production per cow through breeding, nutrition, and herd management advances, and focusing on higher milk solids, particularly butterfat, and protein. This has led to better control of cheese inventories, supporting higher wholesale prices.

Improving Class III milk prices requires optimizing production and management across the dairy supply chain. Balancing protein and butterfat ratios in Class III milk is crucial, as it can increase cheese yield efficiency, reduce milk needed for production, and lower costs. Effective inventory management is essential, and advanced systems and predictive analytics can help producers regulate supply, prevent glutes, and stabilize prices.

Collaboration among producers, processors, and organizations like Ohio State University Extension, which provides essential research and services, and modernizing Federal Milk Marketing Orders (FMMO) to reflect current market realities is also vital for fair pricing. Comprehensive strategies are essential for price stabilization, benefiting all stakeholders.

Organizations and suppliers play a critical role in optimizing Class III milk prices. Entities like Penn State Extension, in collaboration with the Pennsylvania Department of Agriculture and the USDA’s Risk Management Agency, offer valuable resources and guidance to dairy farmers. They provide educational programs to help dairy farmers understand market trends and best practices in milk production.

The FMMO modernization process aims to update milk pricing regulations, ensuring a more equitable and efficient market system. Producers’ participation through referendums is crucial for representing their interests. Processors should work with packaging suppliers to manage material costs, establish contracts to mitigate financial pressures, and maintain stable operational costs.

In conclusion, educational institutions, agricultural agencies, and strategic supply chain collaborations can significantly enhance the Class III milk market, equipping producers and processors to handle market fluctuations and achieve sustainable growth. The low-Class III milk prices, driven by plummeting milk protein prices and stagnant other solids pricing, highlight an outdated USDA formula that misjudges current market conditions where butterfat is valued more in butter than in cheese.

Send this to a friend