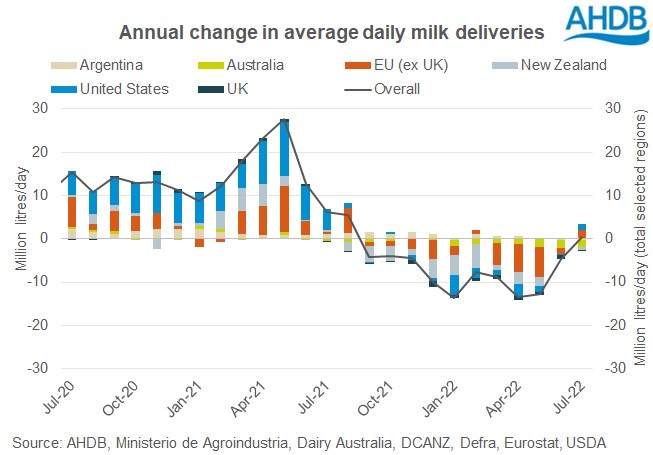
Trends in global milk supplies impact on prices. Deliveries in the six key exporting regions are tracked to provide an overview of current production levels and trends in global milk supplies.
The milk production regions included are the EU-27, UK, Argentina, Australia, New Zealand and the United States. Combined, they account for more than 65% of global cow’s milk production and around 80% of global exports of dairy products.
Overview
- Average daily global milk production for key producing countries in July totalled 765.7 million litres per day in July, an increase of 0.5million litres on last year. This is the first increase seen since August 2021, but due to the downturn in production last year.
- The EU-27 saw an overall increase of 0.5% on last year, although about half of the constituent countries reported year-on-year increases.
- Within the EU-27, production in the key regions of Germany, France, and Spain was down compared with July 2021. However, deliveries in Poland, the Netherlands and Ireland all grew between 1%-6%, helping to offset these losses. Denmark held steady on production achieved last year.
- Inn the United States, average daily deliveries were estimated to be 272.7million litres in July, an annual increase of 1.4million litres per day. This is the first increase it has seen in 9 months.
- The UK saw a decrease of 1% in daily deliveries to 39.9 million litres per day, 0.4million litres down on July 2021. Extreme temperatures in July may have contributed to this, with reduced grass growth and daily milk deliveries coinciding with the rises in temperature.
- Australia, Argentina, and New Zealand all recoreded lower deliveries in July, most notably with Australia back 8.3% on the year, equivalent to 1.7million litres per day. New Zealand decreased by 5.7%, and Argentina by 1%. The large drop in New Zealand is down to record production last year. For Australia, the drop continues its declining trend, with deliveries now running below prior year for 14 months.

Additional information
- The tracker is a baseline for comparing against actual production, not a forecast of milk production.
- The baseline is calculated using historic month-on-month movements in milk production, providing information on a typical milk year in each of the key regions.
Download dataset
(T2, D1)


