Dairy producers are highly aware of the importance of good udder health on milk quality, animal health and the general profitability of the dairy herd. For decades now, milk recording services in Canada have included the analysis of milk samples for somatic cell count and this same data has been used to provide Somatic Cell Score (SCS) genetic evaluations for bulls and cows in all dairy breeds. In October 2017, the Genetic Evaluation Board (GEB) of Canadian Dairy Network (CDN) recommended that the expression of SCS genetic evaluations be changed to be consistent with all other functional traits. Following approval of this recommendation by the CDN Board of Directors, an implementation plan has been established with an effective date of December 2018. Let’s take a closer look at the background and reasoning of this decision.
Genetic Selection for Improved Udder Health
In the 1990s, an overall Udder Health index was developed by Canadian researchers, which included Somatic Cell Score, Udder Depth and Milking Speed, for breeders and A.I. companies to make genetic selection decisions in this area. In August 2001, due to the increasing interest in genetic selection to improve udder health, these three traits were directly included in the LPI formula. In 2007, the dairy industry implemented a data collection system for health events recorded by producers enrolled on DHI and/or via the DSA program in Quebec. As a consequence, CDN later introduced official genetic evaluations for clinical mastitis as well as a Mastitis Resistance index for Holstein, Ayrshire and Jersey breeds in August 2014. One year later, modifications to the LPI formula for these three breeds included the addition of Mastitis Resistance as the optimized genetic selection index for improved udder health to replace Somatic Cell Score, Udder Depth and Milking Speed. At the same time, Pro$ was introduced as the new profit-based genetic selection index, which has a 40% correlation with Mastitis Resistance.
Availability of the Mastitis Resistance (MR) index provides producers with the opportunity to make genetic improvement to reduce the frequency of both clinical and subclinical mastitis in the herd. Somatic cell count is a indicator of subclinical mastitis while clinical mastitis has a bigger negative impact on cow and herd profitability.
Proof Expression
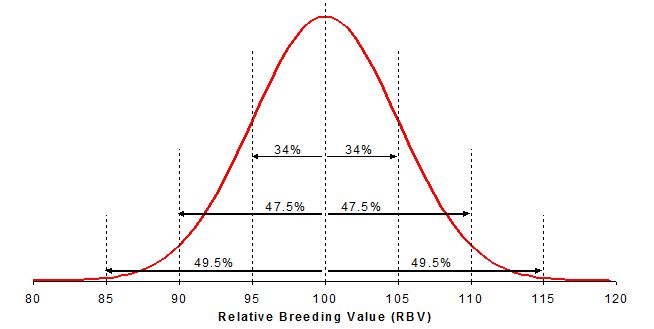
In January 2008, the expression of genetic evaluations for all functional traits, with the exception of SCS, was changed to a Relative Breeding Value (RBV) scale with an average of 100 and a standard deviation of 5. In general, this means that 99% of all bulls within each breed fall between 85 (poorest) and 115 (best), as presented in Figure 1.
- There are multiple reasons for the adoption of an RBV scale for functional traits but the key advantages include:
- The RBV scale is almost identical to the scale used over several decades for conformation traits, with the only difference being an average value of 100 for RBVs instead of 0 for type.
- The use of a consistent scale across all functional traits facilitates the understanding of how each bull ranks within the breed.
- The evaluations for all traits can be expressed in a common direction with the highest RBVs being most desirable.
Figure 1: Distribution of Bull Proofs as RBVs for Functional Traits
At the time when the RBV scale was introduced for all other functional traits, it was decided to exclude SCS in fear that it would create confusion at a time when producer interest in this trait was growing. Now, after ten years of using the RBV scale for many traits, it has been decided to move SCS to this scale as well. Some of the key reasons for this CDN decision include:
- The current scale for SCS, with an average of 3.00 and an approximate range from 2.25 to 3.75, is not well understood by producers other than the fact that values below the average are most desired.
- SCS is currently the only trait for which lower values are preferred so changing to the RBV scale allows the expression to become consistent across all functional traits, both in terms of range and direction of published values.
- Only three other countries involved in Interbull evaluations express SCS evaluations in the same manner as the current scale used in Canada. These include Belgium, Slovakia and United States but, in reality, the scale used in the United States has about half the range (PTA) as the current scale in Canada (EBV). Such a scale difference between Canada and United States is not well known and therefore leads to misinterpretation when comparing evaluations from both countries.
Implementation Plan
There are several details associated with the implementation of this change, which explains the significant lead time before implementation in December 2018. The CDN web site will be modified starting the genetic evaluation release in August 2018 by removing Somatic Cell Score as a trait listed in the section of Functional traits on the Genetic Evaluation Summary page for all animals in the Holstein, Ayrshire and Jersey breeds. Focus should be shifted towards the Mastitis Resistance evaluations already available in this section. For bulls in these three breeds, evaluation details for Somatic Cell Score will continue to be available under the “Health” tab. For genetic evaluation data files provided by CDN for both bulls and cows, there will be no specific changes to the file formats and test files with SCS populated with RBV values can be requested from CDN. The Holstein, Ayrshire and Jersey breed associations will implement modifications to their respective web site queries, as well as official pedigrees and other official documents in advance of the December 2018 implementation. Similarly, prior to implementation, computerized mating programs offered by A.I. companies in Canada will require some modification to incorporate the new scale of expression and interpretation for Somatic Cell Score.
Provided by: Canadian Dairy Network


