


Explore the reasons behind the drastic 69% drop in dairy family farm incomes in 2023. With rising costs and declining milk prices taking a heavy toll, how are farmers navigating these tough challenges?
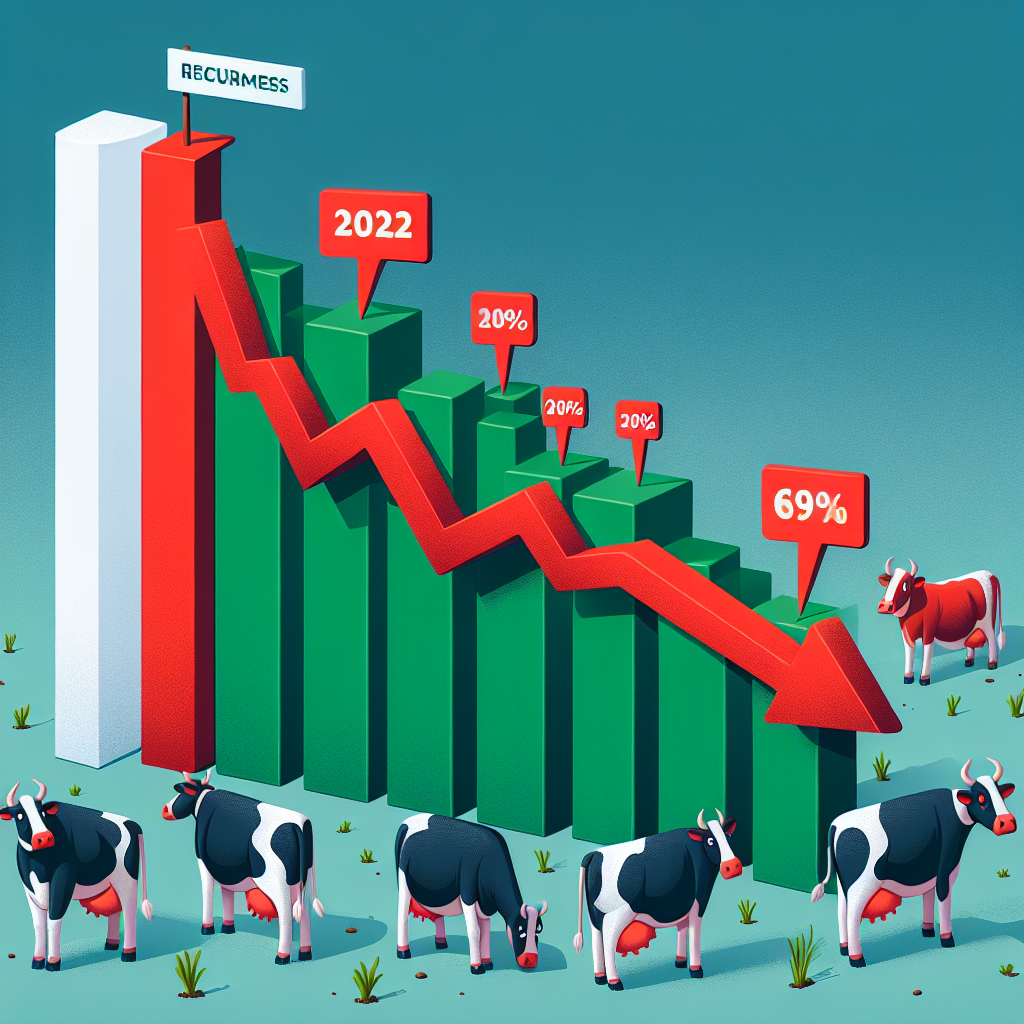
Imagine losing roughly three-quarters of your salary in one year. This is the hard reality for Irish dairy producers in 2023 when Family Farm Income (FFI) drops by 69%. The average FFI for the 15,319 dairy farms included in the National Farm Survey (NFS) decreased to €49,432. The primary reason was a dramatic drop in milk costs, which fell to barely 43 cents per liter. Unlike in 2022, when high prices buffered growing costs, high expenditures in 2023 outweighed lower milk profits. Energy, feed, and contractor expenses skyrocketed, offset marginally by decreasing fertilizer prices. Adverse weather and high operating expenditures contributed to a 4% decrease in milk output. Dairy producers must grasp these aspects to manage economic problems and support their livelihoods effectively.
| Year | Average FFI (€) | Milk Price (€/L) | Average Herd Size | Milk Production Per Hectare (L) | Direct Costs Per Cow (€) |
|---|---|---|---|---|---|
| 2022 | €159,103 | 0.65 | 95 | 12,152 | €1,540 |
| 2023 | €49,432 | 0.43 | 95 | 11,669 | €1,612 |
2023: A Year of Economic Turbulence for Irish Dairy Farmers
In 2023, I depicted a bleak picture of the Irish dairy farming industry, as shown by the National Farm Survey (NFS). The study included 15,319 dairy farms throughout the agricultural landscape, offering a comprehensive view of the industry’s overall health. The financial results were harsh, with an average Family Farm Income (FFI) of €49,432, a staggering 69% decrease from the previous year. This sharp year-on-year decline in FFI highlights the increased challenges from lower milk prices and persistently high input costs, reshaping the economic environment for Irish dairy producers.
The Buffer Crumbles: Impact of Plummeting Milk Prices on Irish Dairy Incomes
| Year | Milk Price (cent per liter) |
|---|---|
| 2021 | 35 |
| 2022 | 50 |
| 2023 | 43 |
| Source: Teagasc National Farm Survey | |
The sudden drop in milk prices to 43 cents per liter by 2023 has significantly affected dairy farm earnings. This drop contrasts sharply with the previous year’s record milk prices, which acted as a cushion against rising input costs. In 2022, higher milk prices offered a financial cushion for dairy producers, protecting them from increasing feed, energy, and other input costs. However, when milk prices fell in 2023, this safety net was unexpectedly eliminated, leaving dairy farms facing increased expenditures. This fast fall weakened profit margins, lowering farm family incomes and emphasizing the fragile character of agricultural markets, where price swings may considerably impact financial stability.
A Perfect Storm: High Input Costs and Economic Strain in 2023
| Cost Component | 2022 (€) | 2023 (€) | Year-on-Year Change (%) |
|---|---|---|---|
| Purchased Concentrate Expenditure | 64,774 | 61,535 | -5% |
| Direct Costs | 14,005 | 14,705 | 5% |
| Electricity, Car, and Phone | 10,930 | 12,243 | 12% |
| Hired Labor | 8,760 | 9,125 | 4% |
| Rent of Conacre | 8,894 | 9,783 | 10% |
| Other Overhead Costs | 8,418 | 8,250 | -2% |
| Building Depreciation | 17,267 | 13,814 | -20% |
| Machinery Depreciation | 19,474 | 20,259 | 4% |
| Machinery Operating Costs | 13,617 | 12,936 | -5% |
2023 has proved to be a challenging year for Irish dairy producers, as they face continually high input prices. Despite a slight decrease in fertilizer prices, which provided some comfort, the drop was insufficient to balance their total burden. Energy prices rose as global markets responded to geopolitical tensions and supply chain disruptions, affecting everything from milking operations to agricultural equipment. Meanwhile, concentrate feed prices rose as competition for raw resources and demand grew. Contracting costs also increased in 2023, indicating more significant labor and fuel costs that contractors had to pass on to farmers. These increased costs added to the financial burden on dairy farmers already dealing with low milk prices, resulting in substantial economic pressure.
Shifting Currents: Analyzing the 4% Decline in Irish Milk Production in 2023
| Year | Total Milk Production (M. litres) | Change (%) |
|---|---|---|
| 2021 | 8,200 | – |
| 2022 | 8,500 | +3.7% |
| 2023 | 8,160 | -4% |
In 2023, Irish milk output fell by 4% on average. The reduction was incredibly sharp in the fourth quarter due to high production costs, falling milk prices, and unfavorable meteorological conditions. This colliding trifecta generated a perfect storm for dairy producers. The minor decrease in fertilizer costs could not offset the high input costs caused by persistently high prices for electricity, concentrate feed, and contractual services. Combined with drastically reduced milk prices, the economic sustainability of many dairy enterprises was severely stretched.
Weather factors exacerbated farmers’ output challenges. Weather fluctuation decreased milk production and increased operational unpredictability, making it more difficult for farmers to plan and manage their resources effectively. The combination of these variables resulted in a significant drop in output during the fourth quarter, underscoring the sector’s susceptibility to economic and environmental challenges.
In this environment, actions to stabilize input prices and protect against market volatility may be critical in cushioning the dairy industry from future downturns. Furthermore, establishing techniques to better deal with severe weather patterns will be essential to ensuring Irish dairy producers’ long-term production levels and economic resilience.
Navigating Shifting Financial Currents: Key Farm Expenditure Changes in 2023
| Category | 2022 (€) | 2023 (€) | Year-on-Year Change (%) |
|---|---|---|---|
| Purchased Concentrate Expenditure | 64,773 | 61,535 | -5% |
| Other Direct Costs | 13,957 | 14,705 | 5% |
| Machinery Depreciation | 19,470 | 20,259 | 4% |
| Machinery Operating Costs | 13,622 | 12,936 | -5% |
| Car, Electricity, and Phone | 10,927 | 12,243 | 12% |
| Hired Labor | 8,772 | 9,125 | 4% |
| Rent of Conacre | 8,895 | 9,783 | 10% |
| Building Depreciation | 17,268 | 13,814 | -20% |
| Other Overhead Costs | 8,418 | 8,250 | -2% |
| Fuel, Building Maintenance, and Land Improvement | 5,000 (approx.) | 4,500 (approx.) | -10% |
The financial dynamics of 2023 demonstrated significant changes in several agricultural expenses for the typical dairy farm. Notably, concentrate feed cost reached €61,535, representing a 5% drop over the previous year. This led to an average feed amount of 1,207 kg per dairy cow, a slight decrease from 2022.
Other direct expenditures, which include various things necessary to everyday operations, increased by 5% to an average of €14,705. These costs include expenses for vital goods that maintain the farm’s seamless operation despite changeable economic situations.
Overhead expenses showed diverse patterns. While building depreciation fell 20% to €13,814, equipment depreciation increased 4% to €20,259. Despite the rise in depreciation, equipment operating expenses dropped by 5% to €12,936. A significant 12 percent increase in automobile, power, and phone service charges compounded the spending, resulting in an average expense of €12,243. Hired labor costs increased by 4%, reaching €9,125 on average, while conacre rental expenses increased by 10%, to €9,783.
In contrast, certain overhead expenses were reduced. Key examples include a 2% drop in other overhead costs, bringing the average to €8,250, and decreased fuel, building maintenance, and site improvement expenses, ranging from €3,000 to €6,000 on average.
A Staggering Shift: The Decline of Irish Dairy Farm Incomes in 2023
| Income Range (€) | 2022 (%) | 2023 (%) |
|---|---|---|
| <30,000 | 10% | 39% |
| 30,000 – 50,000 | 11% | 19% |
| 50,000 – 70,000 | 10% | 15% |
| 70,000 – 100,000 | 10% | 12% |
| >100,000 | 64% | 15% |
The Teagasc National Farm Survey shows that the economic environment for Irish dairy farmers has transformed substantially by 2023. The number of farms reporting an average Family Farm Income (FFI) of less than €30,000 increased significantly, reaching 39%. This compares sharply with 2022, when more farms were in the upper-income groups. Concurrently, the fraction of farms with the most significant revenue dropped from 64% in 2022 to 15% in 2023. The income distribution slump shows dairy producers have substantial financial issues due to low milk prices and high input expenses.
Disparities in Dairy Farm Income: Analyzing Farm Size and Operational Intensity
| Farm Size (hectares) | Average FFI (€) | FFI per Hectare (€) | Stocking Rate (LU/ha) | Milk Production per Cow (liters) |
|---|---|---|---|---|
| <30 | 15,000 | 500 | 1.8 | 5,000 |
| 30-50 | 37,500 | 1,250 | 2.1 | 5,300 |
| 50-70 | 50,000 | 1,000 | 2.3 | 5,400 |
| 70-100 | 65,000 | 950 | 2.5 | 5,600 |
| >100 | 85,000 | 850 | 2.6 | 5,700 |
Examining farm size and intensity showed a significant difference in average Dairy Farm Family Income (FFI) across farm size classes. This discrepancy is notably noticeable among bigger farm sizes, where FFI varies greatly. Figure 15 shows that smaller farms often face lower revenues, and more giant farms see a more excellent range of financial outcomes.
Smaller farms (usually 30 to 50 hectares) tend to report lower average FFI. This tendency may be explained by restricted economies of scale and more significant relative input costs. On the other hand, farms of 50 to 100 hectares frequently benefit from modest economies of scale, which may help offset certain fixed costs, increasing the average FFI. However, even within this mid-range group, the FFI may vary significantly depending on herd management tactics, input cost control, and market access.
The giant farms with more than 100 hectares show the most significant fluctuation in FFI. These farms have the potential to benefit considerably from economies of scale, but they also face particular problems that might affect profitability. For example, the more significant capital inputs necessary for extended operations and the difficulty of maintaining vast herds may result in substantial financial discrepancies in performance. Some big farms may attain very high FFIs on one end of the spectrum owing to efficient operations and good market circumstances. Others may suffer from high loan payment costs and milk price volatility, resulting in lower-than-expected profits.
Furthermore, the intensity of agricultural methods influences FFI. Higher-intensity operations, defined by higher stocking rates and more intense use of inputs, may increase gross production while increasing costs, especially in difficult economic climates such as 2023. This situation leads to a large variety of FFI results, even on farms of comparable size.
Although more giant dairy farms can attain higher average FFIs, they also have a more comprehensive revenue range. This diversity demonstrates the complex interplay between farm size, management approaches, and economic circumstances in creating financial outcomes.
Regional Disparities in Irish Dairy Farming: Challenges and Opportunities Across East, Midlands, North, West, and South
The variety of dairy farm architecture throughout Ireland’s regions highlights the varied problems and possibilities that farmers confront in various geographical zones. According to the 2023 Teagasc National Farm Survey, the East and Midlands, North and West, and South areas have unique land acreage, herd numbers, and financial performance, reflecting historical patterns and current economic trends.
On average, dairy farms in the East and Midlands region have the most significant land area, covering 77 hectares, and the highest herd numbers, averaging 117 cows. Financially, this area has a more significant average farm debt of €139,878, owing to considerable investments of €47,887 per farm. The FFI (Family Farm Income) for these farms is at €56,124. However, when corrected for unpaid work, it drops dramatically to €35,557 per unpaid labor unit, showing a dependence on family labor and a possible pressure on sustainability.
Meanwhile, the South area, regarded as the traditional dairy heartland, is home to most of Ireland’s dairy farms (72% of the total). The typical dairy farm in this area is 64 hectares in size, with 95 cows on the property. The financial parameters for the South show an average farm debt of €88,606 and an investment level of €45,495. The regional average FFI is €54,327. However, accounting for unpaid work, it climbs to €40,224 per unpaid labor unit, demonstrating a slightly healthier financial structure than the East and Midlands but with underlying stresses.
The North and West regions provide a contrasting image, with lower average farm holdings of 56 hectares and herd numbers of 72 cows. This area also has the lowest agricultural debt, at €67,570, and the most minor investment per farm, at €36,404. As a result, the FFI is much lower, at €28,906, and after accounting for unpaid work, the adjusted FFI drops to €12,722 per unpaid labor unit. These numbers indicate the fragility and financial restrictions of dairy farms in this area and the restricted capability for investments and expansion.
This regional research reveals severe inequalities in the Irish dairy industry, highlighting the need for region-specific policies and support systems to guarantee the profitability and sustainability of dairy farming across Ireland. Such tailored initiatives are critical for addressing farmers’ specific concerns, ranging from high investment needs in the East and Midlands to the financial resilience needed in the North and West.
The Structural Transformation of Irish Dairy Farming: Trends in Milk Production, Herd Size, and Land Use
Significant structural changes have transformed Irish dairy farms, as seen by major patterns in milk output per hectare, average herd size, and land usage. Despite periodic instability caused by lousy weather and shifting milk prices, the average amount of milk produced per acre has steadily increased since 2015. In 2023, milk output per acre fell 4% to 11,669 liters. Concurrently, the average milk output per cow decreased by 5% to 5,461 liters.
The average herd size has grown dramatically, from 64 cows per farm in 2013 to 95 cows by 2023. This rise in herd size corresponds to an increase in total livestock units, indicating that more animals were maintained as replacements.
Regarding land usage, dairy farms’ average utilized agricultural area (UAA) fell marginally, from 65.2 hectares in 2022 to 64.3 hectares in 2023. The average dairy pasture area was also reduced by 3% to 44 hectares. These trends highlight the dynamic character of Irish dairy production and the constant adaptations required to address economic and environmental issues.
The Bottom Line
In 2023, Irish dairy farmers experienced financial insecurity due to a dramatic reduction in milk prices and high production expenses, leading to a 69% loss in farm revenue. National milk output decreased by 4%, particularly in the fourth quarter. Although fertilizer prices were reduced, electricity, feed, and contracting costs increased. Machinery upkeep, labor, and land leasing all saw a rise in cost. Regional inequalities highlight financial issues in the East, Midlands, North, West, and South, with more giant farms seeing unique consequences. Farmers have adapted by changing herd numbers, land usage, and milk output. It is critical to look at other income sources and cost-cutting strategies. Policies that reduce price volatility and give input cost subsidies are required. Irish dairy producers’ perseverance and innovation are critical to ensuring a long-term, profitable future.
Key Takeaways:
- The average Dairy Family Farm Income (FFI) in 2023 was €49,432, reflecting a significant 69% decrease from the previous year.
- A sharp decline in milk prices to 43 cents per liter was a primary factor behind the reduced FFI.
- Despite a decline in fertilizer costs, other input costs such as energy, concentrate feed, and contracting increased, exacerbating financial pressures.
- Overall, Irish milk production decreased by just over 4% in 2023, with a notable falloff in the final quarter.
- Gross output on dairy farms typically decreased by 27% relative to 2022 due to lower volume and value of output.
- Production costs remained high, with only a 1% decrease from the previous year’s high levels.
- Average feed use per cow showed slight reductions but varied significantly based on specific farm characteristics.
- Overhead costs saw mixed changes, with some elements like building depreciation decreasing, while others like machinery depreciation and operating costs fluctuated.
- Regional disparities were evident, with the majority of dairy farms located in the South, which also had different financial and structural characteristics compared to other regions.
- Significant structural changes in Irish dairy farming included increases in herd sizes and changes in land use and production per hectare over recent years.
Summary:
In 2023, Irish dairy producers experienced a significant economic downturn, with an average Family Farm Income (FFI) dropping by 69% from the previous year. This decline was primarily due to a drop in milk costs, which fell to just 43 cents per liter. The National Farm Survey (NFS) showed a bleak picture of the Irish dairy farming industry, with an average FFI of €49,432, a 69% decrease from the previous year. Irish milk output fell by 4% on average, particularly in the fourth quarter, due to high production costs, falling milk prices, and unfavorable meteorological conditions. Key farm expenditure changes revealed significant changes in agricultural expenses for the typical dairy farm, with concentrate feed cost reaching €61,535, other direct expenditures increasing by 5% to an average of €14,705. Overhead expenses showed diverse patterns, with building depreciation falling 20% to €13,814, equipment depreciation increasing 4% to €20,259. Hired labor costs increased by 4% to €9,125, and conacre rental expenses increased by 10% to €9,783.
Learn more:
- Why Milk Costs More but Dairy Farmers Earn Less: The Global Dairy Dilemma
- US Dairy Farmers’ Revenue and Expenditure Rise Slightly in March
- Is 2024 Shaping Up to Be a Disappointing Year for Dairy Exports and Milk Yields?


