


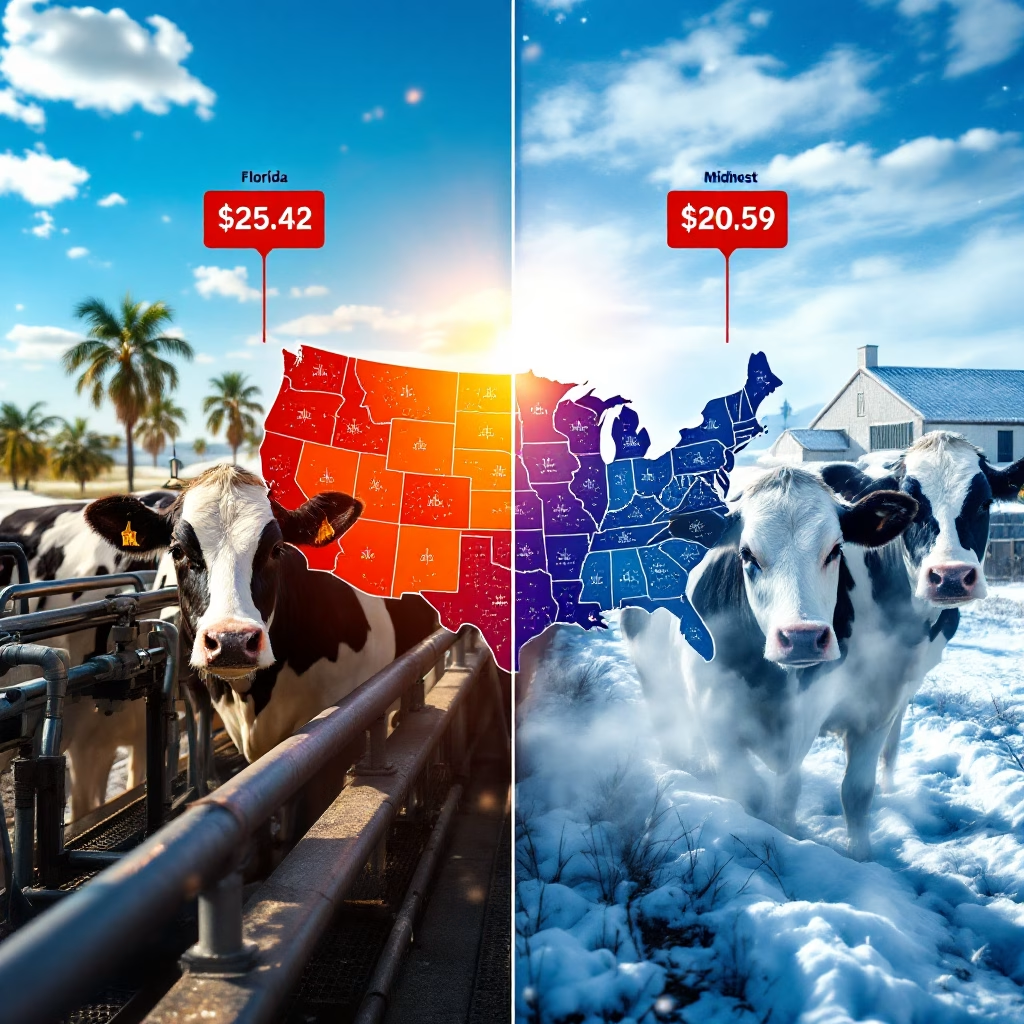
Florida dairy farmers earn $5.11 more per cwt than Midwest farms for identical milk. Is geography worth $1.28 million per year? June 1 changes everything.
EXECUTIVE SUMMARY: The February 2025 Federal Milk Marketing Order prices reveal a stark $5.11 per hundredweight divide between Florida ($25.42) and Upper Midwest ($20.31) producers, creating a $1.28 million annual advantage for identical 1,000-cow operations based solely on geography. This regional inequality highlights fundamental flaws in a system that undergoes significant transformation on June 1, when the return to the “higher-of” Class I formula, updated make allowances, and other changes take effect. Meanwhile, a dramatic shift in component values—with protein surging and butterfat declining—signals strategic production opportunities for forward-thinking producers. Smart dairy farmers are already preparing by shifting focus to protein production, calculating their June 1 impact, and implementing risk management strategies before market volatility intensifies.
KEY TAKEAWAYS
- Regional Price Gap: A $5.11 per hundredweight difference between identical milk in Florida versus the Upper Midwest creates “dairy haves and have-nots” based purely on location, not management quality.
- June 1 Formula Change: The return to the “higher-of” Class I pricing formula would have reduced February’s Class I price by 44 cents, suggesting the change may not benefit producers as promised.
- Component Value Shift: With protein values rising (up 20¢ to $2.53/lb) and butterfat falling (down 13¢ to $2.82/lb), producers should reassess breeding and nutrition programs to emphasize protein.
- Action Required: Dairy producers must prepare for June 1 by calculating their specific exposure to formula changes, adjusting production strategies to emphasize protein, and implementing risk management tools before prices decline.
- Depooling Impact: February’s narrow 28-cent spread between Class III and IV prices reduced depooling incentives, but March’s projected 46-cent spread could trigger Class IV depooling, affecting producer payments.
Florida dairy farmers are banking $5.11 more per hundredweight than their Upper Midwest counterparts for identical milk—highway robbery or fair market?
February’s milk check exposes a system that’s making some farmers rich while others barely survive.
With significant pricing changes coming June 1, here’s who stands to win and get the short end of the stick in Dairy’s great regional lottery.
The Cold, Hard Numbers: February’s Price Reality
February’s Federal Milk Marketing Order (FMMO) uniform prices tell a tale of two dairy industries. Prices increased in just three of the 11 FMMOs—those blessed with high Class I (fluid milk) utilization—while the other eight regions saw declines from January.
This pattern creates winners and losers based purely on geography, not management skill or milk quality.
The Florida order maintained its crown with an impressive $25.42 per hundredweight (cwt), climbing 38 cents from January. Meanwhile, Upper Midwest producers scraped the bottom at a measly $20.31 per cwt.

| FMMO Region | February 2025 Uniform Price | Change from January |
| Florida | $25.42/cwt | +$0.38 |
| Southeast | $24.32/cwt | +$0.22 |
| Appalachian | $23.65/cwt | +$0.15 |
| Northeast | $22.18/cwt | -$0.27 |
| Arizona | $22.02/cwt | -$0.31 |
| Pacific Northwest | $21.14/cwt | -$0.42 |
| California | $20.94/cwt | -$0.35 |
| Central | $20.75/cwt | -$0.29 |
| Southwest | $20.72/cwt | -$0.33 |
| Mideast | $20.67/cwt | -$0.31 |
| Upper Midwest | $20.31/cwt | -$0.38 |
| PRICE GAP | $5.11/cwt |
This $5.11 difference in identical products has producers questioning the fairness of a system that seems to play favorites. What does your region cost you each month?
For a 1,000-cow dairy producing 70 pounds per cow daily, this regional difference amounts to over $107,310 monthly—more than $1.28 million annually.
“A Florida dairy farm with 1,000 cows will earn $1.28 MILLION MORE annually than an identical Upper Midwest operation—purely because of geography. That’s not a pricing system; it’s a lottery.”
Bill Davidson, who milks 850 cows near Eau Claire, Wisconsin, feels the regional sting every month: “We’re producing the same quality milk with the same components as farms in Florida, but we’re getting over $5 less per hundredweight. That’s more than $800,000 a year, and our operation loses because of our zip code. How is that fair?”
Are Your Milk Classes Working FOR You or AGAINST You?
Class prices displayed similarly uneven performance in February. The Class I base price jumped to $21.27 per cwt, up 89 cents from January and a substantial $3.28 from February 2024.
But other classes faltered:
- Class II fell 50 cents to $21.08 per cwt
- Class III dipped 16 cents to $20.18
- Class IV took the biggest hit, plunging 83 cents to a 12-month low of $19.90
| Milk Class | February 2025 Price | Change from January | Change from Feb 2024 |
| Class I (base) | $21.27/cwt | +$0.89 | +$3.28 |
| Class II | $21.08/cwt | -$0.50 | +$0.55 |
| Class III | $20.18/cwt | -$0.16 | +$4.10 |
| Class IV | $19.90/cwt | -$0.83 | +$0.05 |
| Class III-IV Spread | $0.28/cwt | ↓ | Narrowest since Mar 2023 |
JUNE 1 ALERT: Your Milk Check Is About to Change
Mark your calendars for June 1, 2025, the day the dairy pricing system will undergo its biggest overhaul in years.
After months of hearings and negotiations, all 11 FMMOs approved amendments to pricing formulas that will fundamentally alter how your milk check is calculated.
The most significant change is the return to the “higher-of” formula for Class I milk pricing. This reverses the controversial “average-of plus 74 cents” formula that’s been in place for years.
Based on February’s numbers, this would have reduced the Class I base price by 44 cents per cwt—proving that what sounds good in a boardroom doesn’t always benefit farmers.
“The irony is stunning: The ‘higher-of’ formula that benefits farmers would have REDUCED February’s Class I price by 44 cents. Are we fixing the system or just reshuffling who gets squeezed?”
| Changes Taking Effect June 1 | Winners | Losers |
| Return to “higher-of” formula | High Class I utilization areas | Would have reduced Feb Class I price by $0.44/cwt |
| Updated make allowances | Processors gain increased margins | All producers face potential payment reductions |
June 1 also brings updated manufacturing allowances for processors—essentially increasing what they can deduct from your milk check.
The new make allowances include 25.19 cents for cheese, 22.72 cents for butter, 23.93 cents for nonfat dry milk, and 26.68 cents for dry whey.
The timing of these changes—deliberately set for World Milk Day—seems almost like a cruel joke to producers facing potentially reduced payments.
Maria Hernandez, whose family operates a 400-cow dairy near Orlando, Florida, sees both sides of the regional pricing debate: “Yes, we benefit from Florida’s higher prices, but our production costs are also higher. What matters to all of us is stability. These constant formula changes create uncertainty that makes it impossible to plan long-term.”⁷
FOLLOW THE MONEY: Component Shift Could Make or Break Your Dairy
Innovative dairy producers don’t just look at the bottom line—they follow the components.
February saw a dramatic shift as butterfat values plummeted about 13 cents to $2.82 per pound, their lowest level since July 2023. Meanwhile, protein values surged more than 20 cents to $2.53 per pound, hitting a four-month high.
| Component | February 2025 Value | Change from January | Trend |
| Butterfat | $2.82/lb | -$0.13 | Lowest since July 2023 |
| Protein | $2.53/lb | +$0.20 | 4-month high |
| Nonfat Solids | $1.55/lb | -$0.045 | ↓ |
| Other Solids | $0.48/lb | -$0.06 | ↓ |
“When protein is worth $2.53 and butterfat only $2.82 per pound, the market sends a clear signal: The era of fat-focused production is ending. The question is whether YOUR breeding program has gotten the message.”
This inverse relationship signals a critical shift in production strategy. Farms focusing on butterfat may need to reconsider their approach, while those with high-protein herds could see their advantage grow.
The gap between these component values tells a more precise market story than any press release—consumers are chasing protein, not fat.
Research from the Journal of Dairy Science has long shown that milk components vary significantly across farms and directly impact profitability under the FMMO pricing system.⁹ Smart producers can manage these components through strategic decisions about breed selection, lactation management, feed rations, and milking frequency.
The $5 QUESTION: Is Geographic Lottery Fair for Dairy Farmers?
The $5.11 gap between Florida and Upper Midwest prices exposes the growing inequity built into the FMMO system.
Originally designed to ensure fair milk prices across regions, today’s system has morphed into one that heavily favors certain areas—creating dairy haves and have-nots.
The System’s Historical Logic
Regional price differentials weren’t created in a vacuum. They were established to reflect actual economic factors: transportation costs to move milk from surplus to deficit regions, local supply and demand conditions, and higher production costs in certain areas. Florida’s high fluid utilization (Class I) and distance from major production regions historically justified higher prices to ensure adequate local supply.
But as milk production has consolidated and transportation systems have evolved, many industry experts from Cornell University and other institutions question whether today’s extreme regional price gaps truly reflect economic reality—or if they’ve become an outdated mechanism that arbitrarily rewards some producers while punishing others.
While the upcoming June changes will adjust Class I differentials, they’re unlikely to close this regional chasm. Divergent pricing guarantees that identical milk produced with identical care receives wildly different payments based on location.
This regional lottery undermines the FMMO system’s very purpose of creating an equitable playing field for all dairy producers.
| Regional Price Gap Impact | Monthly Loss per Farm Size |
| 100-cow dairy | $10,710 per month |
| 500-cow dairy | $53,550 per month |
| 1,000-cow dairy | $107,100 per month |
| 5,000-cow dairy | $535,500 per month |
Are YOU prepared for June 1? The time to adjust your business strategy is NOW.
POOLING EXPOSED: How Your Check Gets Manipulated
Think of milk pooling like a community fund: producers contribute milk, the fund collects revenue from all classes, and everyone gets a share based on complex rules. But here’s the catch—when prices align a certain way, handlers can withdraw their high-value milk from the pool, leaving less money for everyone else.
That’s deploying in simple terms, and it’s why February’s numbers matter to YOUR bottom line.
February’s tiny 28-cent spread between Class III and IV prices meant less incentive for this manipulation—but for how long?
February’s class price dynamics dramatically altered the pooling game. At just 28 cents per cwt, the spread between Class III and Class IV prices hit its narrowest margin since March 2023.
This tight spread reduced processors’ incentives to deploy milk, a practice that often leaves producers with the short end of the stick.
The result? Despite three fewer marketing days than in January, the total milk pooled in February barely declined, reaching 12.65 billion pounds, according to USDA pooling data.
Class IV pooling surged by 1.26 billion pounds to 2.7 billion pounds—the highest volume since April 2023—while Class III pooling dropped by 895 million pounds.
These shifts directly impact producer payments and expose how vulnerable the system is to manipulation.
MARCH WARNING: Prepare for Price Pressure
Looking ahead, March uniform prices will likely decline.
The March Class I base price has already been announced at $21.02 per cwt, down 25 cents from February.
Based on Chicago Mercantile Exchange futures prices as of March 13, both Class III and IV could drop substantially, with Class III projected at $18.25 and Class IV at $18.71—creating a 46-cent spread that reverses February’s trend and could trigger more Class IV deployment putting your March milk check at risk.
This forecasted decline comes just months before the June 1 pricing changes take effect—giving producers little time to adjust their business models before yet another seismic shift in the payment system.
Those prepared for these changes will survive; those caught unaware may not.
SURVIVAL GUIDE: Three Steps to Beat the System
February’s price data reveals more than just numbers—it exposes a system in transition that rewards those who understand its complexities.
The regional disparities, shifting component values, and upcoming formula changes create threats and opportunities.
1. PROTEIN POWER: Shift Your Production Focus
With protein values outpacing butterfat, review your nutrition program and consider genetic selection that emphasizes protein content.
According to research from the University of Wisconsin’s Dairy Innovation Hub, producers can increase milk protein by 0.1-0.2 percentage points through targeted nutrition strategies, potentially adding thousands in annual revenue.
Consult with nutritionists about amino acid-balanced rations and evaluate your breeding program to select for higher protein traits.
2. CRUNCH THE NUMBERS: Calculate Your June 1 Impact
Run detailed scenarios showing how the return to the “higher-of” formula will impact your specific operation based on your utilization and component levels.
Progressive Dairy’s analysis shows the impact will vary dramatically depending on your regional blend price and utilization rates.
Don’t wait for your co-op or milk handler to tell you what’s coming—do the math yourself.
3. HEDGE YOUR BETS: Risk Management is Essential
Consider futures contracts or options to protect against volatility during the transition period.
Even smaller producers should explore minimum price guarantees and Dairy Revenue Protection options before June 1 hits.
Innovative producers are already preparing for the June 1 changes by reassessing production strategies, considering component optimization, and exploring risk management tools.
As the pricing game changes, so must your approach to playing it. Those who adapt will thrive; those who don’t risk getting culled from an industry that shows little mercy to the unprepared.
“The dairy pricing system isn’t just complex—it’s deliberately opaque. Those who master its intricacies will survive June 1; those who don’t understand their milk check may not be writing checks much longer.”
The dairy pricing system may be complex, but one thing is crystal clear: knowing how to navigate it separates those who will survive from those who won’t.
February’s numbers are just the first sign of what promises to be a high-stakes year for America’s dairy farmers.
Learn More
- FMMO Reform Fallout: Who Benefits from the Return to “Higher-Of” Formula?
- Breeding for Protein: 5 Genomic Bulls That Will Maximize Your Component Values
- Dairy Risk Management Essentials: Protecting Your Operation from Market Volatility
 Join the Revolution!
 Join the Revolution!
Join over 30,000 successful dairy professionals who rely on Bullvine Daily for their competitive edge. Delivered directly to your inbox each week, our exclusive industry insights help you make smarter decisions while saving precious hours every week. Never miss critical updates on milk production trends, breakthrough technologies, and profit-boosting strategies that top producers are already implementing. Subscribe now to transform your dairy operation’s efficiency and profitability—your future success is just one click away.


