 Assessing a farm’s sustainability in today’s challenging markets requires evaluation of both production and financial metrics. Consultants have become so specialized that finding someone knowledgeable in both areas can be difficult. Smart decisions are made when both aspects are reviewed and the producer can examine the ripple effect of how a change in one area can impact another. One area that can create problems for even a well-managed dairy is taking out an owner draw that exceeds what the milk income can cover. A simple calculation method can be used to determine what the operation is able to cover for family living expenses.
A common metric that producers and consultants use in evaluating a herd’s performance is average milk production per cow per day. However, this number alone does not tell the complete story on how an operation is performing financially. Ultimately it comes down to the total annual pounds of milk shipped along with the current milk price to generate the income to cover all expenses. Table 1 illustrates an example of a 2018 cash flow plan examining the dairy enterprise only. This producer wants to keep owner draw at $90,000, similar to the previous year. This operation has done a good job of keeping direct, overhead, and feed expenses close to the budgeted amount. Loan payments are fixed throughout the year. The current gross milk price for 2018 is averaging $16.16/cwt. In order to keep owner draw at $90,000 the herd will need to average 79 pounds/cow/day for the year, assuming the milk price stays around $16.00/cwt. This herd has never shipped 5.7 million pounds on 200 cows, so trying to maintain this owner draw in 2018 will create a hardship for this operation. If the herd continues to maintain a 74 pound average, family living expenses would need to be reduced to $30,000. It is unlikely the family can live on that amount. The other option would be to milk more cows. Considering the added expenses that come with that scenario, it would be possible to keep owner draw around $70,000. The one bottleneck to the added cows and additional milk shipped is if the farm exceeds their base, which is very likely. The other options to consider are other sources of farm income or off-farm income.
There are some common themes that surface when working on cash flow plans. The first is actually budgeting for family living expenses. Many times this is an ambiguous number and just a guesstimate. Producers who develop and follow cash flow plans year after year usually are keeping good records and are accurately accounting for their owner draw and farm expenses. When accurately reported, family living expenses are often much higher than what was first budgeted.
The calculation method requires producers to examine what the expenses are and how much milk must be shipped to cover those expenses. Very rarely is this approach taken and that’s the reason so many operations are struggling with negative net income. The big question is how long will other off-farm income or other farm income subsidize the dairy enterprise? With less than stellar milk markets, very few dairy operations would still be in business if it were not for other income. The dairy enterprise alone should show a profit and provide the necessary income for a family to maintain a decent standard of living. There are still too many operations that do not know their numbers and are not operating as a business. The future of the family dairy operation depends on managing both the production and financial metrics.
Table 1. Determining the family living expenses to cash flow the dairy enterprise in 2018.
| Determining milk income needed | Dairy Enterprise Only, Current 2018 Plan | Dairy Enterprise Only, Adjust Family Living | Dairy Enterprise Only, Add More Cows |
|---|---|---|---|
| Number of milk cows | 200 | 200 | 220 |
| Expenses | |||
| Direct | $101,000.00 | $101,000.00 | $103,000.00 |
| Overhead | $191,000.00 | $191,000.00 | $198,000.00 |
| Family living | $90,000.00 | $30,000.00 | $70,000.00 |
| Taxes | $0.00 | $0.00 | $0.00 |
| Loan payments (principal + interest) | $225,000.00 | $225,000.00 | $225,000.00 |
| Total feed cost | $425,000.00 | $425,000.00 | $471,000.00 |
| Total outflow | $1,032,000.00 | $972,000.00 | $1,067,000.00 |
| Outflow covered by milk sales | $928,800.00 | $874,800.00 | $960,300.00 |
| Average milk price | $16.16 | $16.16 | $16.16 |
| Minimum pounds of milk shipped/year | 5,747,525 | 5,413,366 | 5,942,450 |
| Average production, lbs./day | 79 | 74 | 74 |
| Current milk production/cow/day | 74 | 74 | 74 |
Action plan for evaluating the income needed to cover expenses including family living expenses.
Goal – Develop a cash flow plan for 2018 budgeting in family living expenses.
- Step 1: Using the Penn State Excel worksheet, determine all expenses for 2018 including direct, overheads, feed costs, loan payments, and the desired owner draw needed for the family.
- Step 2: Take the outflow minus all non-milk income divided by the expected milk price to determine the pounds of milk needed to be shipped for the year. Divide the amount by the number of cows milking to determine the average production per cow.
- Step 3: Evaluate if the pounds of milk shipped is realistic for the herd and make adjustments as needed.
- Step 4: Monitor pounds of milk shipped monthly to make sure the herd is on track. Check expense lines to ensure everything is staying close to the budget planned.
Economic perspective:
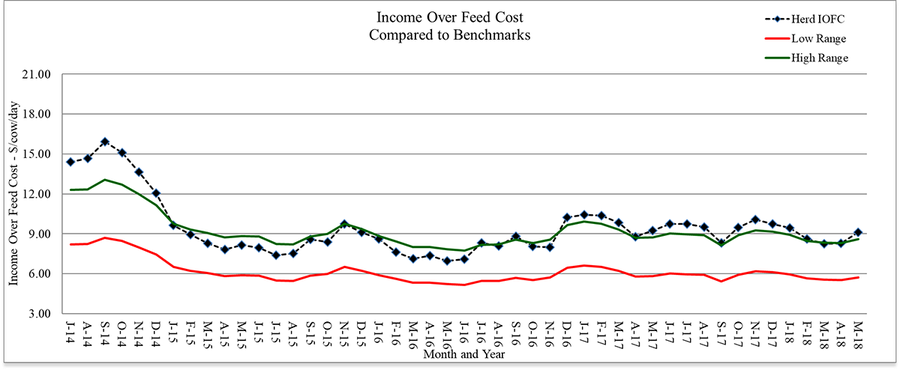
Monitoring must include an economic component to determine if a management strategy is working or not. For the lactating cows income over feed costs is a good way to check that feed costs are in line for the level of milk production. Starting with July 2014’s milk price, income over feed costs was calculated using average intake and production for the last six years from the Penn State dairy herd. The ration contained 63% forage consisting of corn silage, haylage, and hay. The concentrate portion included corn grain, candy meal, sugar, canola meal, roasted soybeans, Optigen and a mineral vitamin mix. All market prices were used.
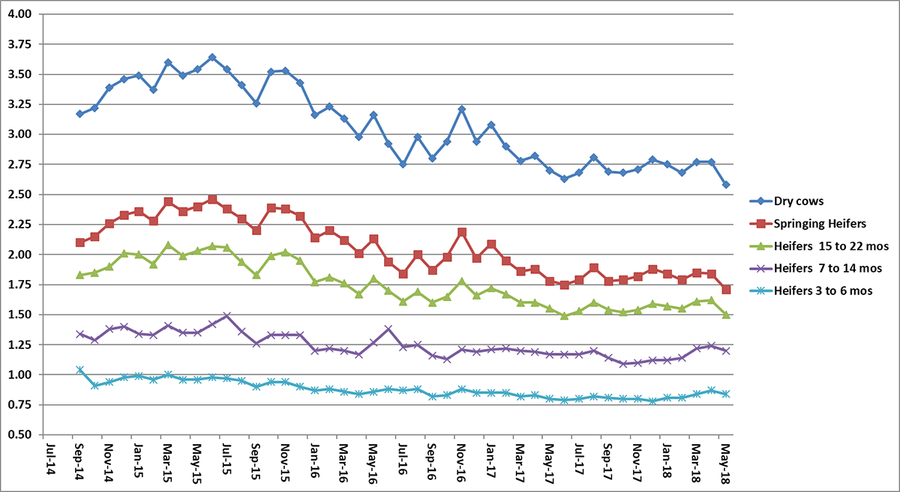
Also included are the feed costs for dry cows, springing heifers, pregnant heifers and growing heifers. The rations reflect what has been fed to these animal groups at the Penn State dairy herd. All market prices were used.
Income over feed cost using standardized rations and production data from the Penn State dairy herd.
Note: Penn State’s May milk price: $17.08/cwt; feed cost/cow: $5.22; average milk production: 84.0 lbs.
Feed cost/non-lactating animal/day.
June 2018
Source: extension.psu.edu


