Usually, the Bullvine does not come back quickly to a topic just covered. But when specifically asked to add further light on a topic, we leap at the opportunity to add clarity with further information. After publishing the article “Which Breeding Index is right for you?” we received questions and comments from readers and Facebook friends that stimulated us to dig deeper.
Readers’ Questions
- Can you provide analysis on Jerseys, as they are gaining in popularity?
- What about comparisons of bull index groupings for Canadian sires?
- How significant are the differences between the bull index categories?
- I live in the UK and use both US and Canadian sires, I would be interested in knowing if I can use TPI and LPI and NM$ and Pro$ interchangeably?
These are all excellent questions?
Study Premise
Let’s recall the premise of the original article. Our premise was “the average of a group of bulls, selected using a particular total merit index, will be what a breeder can expect to obtain in the genetic merit of their herd when that certain index is used over a period.”
Of course, a breeder will pick and choose sires and will not use all the sires in any grouping. Therefore the results obtained can and will differ from the average. However, the average will be a very good indication of the results from using any particular total merit index.
Total Merit Indexes Studied
Some dairy cattle breeders follow only one breeding strategy, others use more than one strategy in their herd, but almost all breeders use the facts and figures to help them achieve their goals and objectives.
To assist breeders, we choose four total merit indexes to compare expected results:
- Conformation/ Type Index (when selection is based on type only)
- Production Indexes (Fat + Protein Yield, as 70% of milk goes into milk products)
- Breed recommended Total Merit Indexes (TPI, JPI, LPI, …)
- Economically Weighted Total Merit Indexes (NM$, CM$, Pro$, …)
Sire Average Index Comparisons
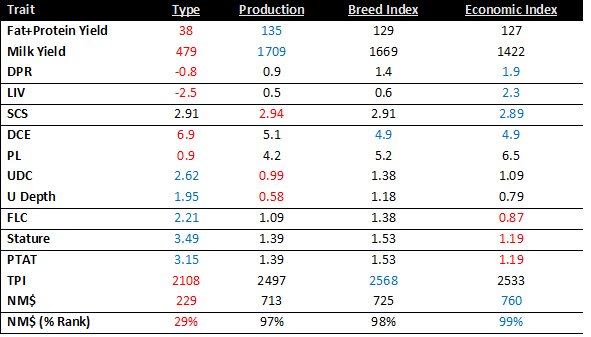
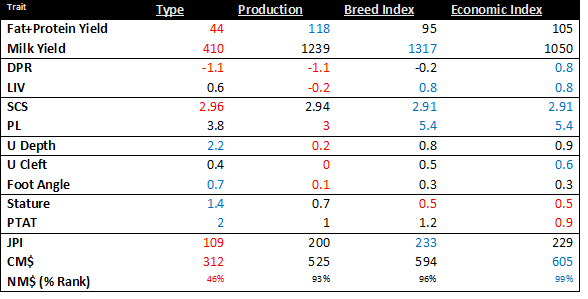
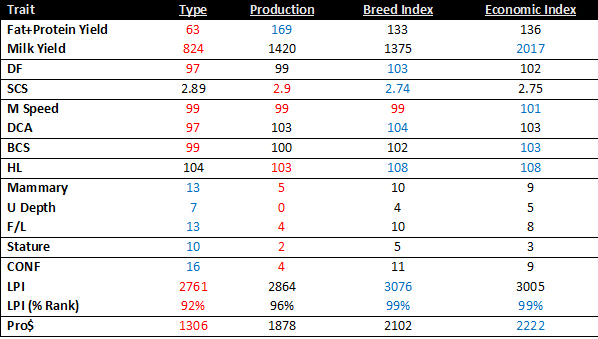
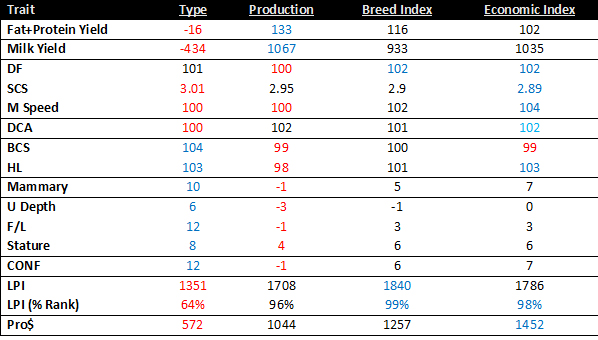
The tables that follow are the average proofs for the top active US and Canadian Holstein and Jersey proven sires, with semen available for sale, as ranked and published in December 2016. Table 1 is a replication of the table contained in our first article. The number color coding is: red = lowest/worst; and blue = highest/best. The scale of and range in proofs depends on the base used for the publication of proofs.
Table 1 Average Proof for Top Twenty Active US Proven Holstein Sires (Dec’16)
Table 2 Average Proof for Top Ten Active US Proven Jersey Sires (Dec’16)
Table 3 Average Proof For Top Twenty Active Canadian Holstein Sires (Dec’16)
Table 4 Average Proof For Top Ten Active Canadian Proven Jersey Sires (Dec’16)
The Take Home Messages on Indexes
Holstein Sires: The highest sires for breed and economic indexes came out superior most often. Highest production sires did not rank lowest for traits as often as most top type sires. With management, health and longevity traits receiving the focus in 2017, NM$, CM$ and Pro$ indexes are recommended as the total merit indexes to use when doing the first sort for sires to use.
- Jersey Sires: Since the number of Jersey sires being proven is not as large, the averages and comparisons may not be As with Holsteins, the breed and economic indexes come out on top more often. In the US JPI and CM$ are very similar. However, in Canada Pro$ is superior to LPI when it comes to the Jersey sire proof averages. The high type sires definitely are inferior for production and most important management traits. The highest production sires do not have the longevity and management traits that most commercial breeders want to have in their herds.
- Highest Type Sires: These sires will satisfy breeders wanting to breed for the niche show market. Otherwise, breeders using high type sires will continue to quickly fall behind for production, fertility, DCE and other management traits. Significantly increased stature (and size) comes with selecting for type for both breeds in both US and Canada. Compared to other total merit indexing alternatives, when a sire’s type proof is used as the primary selection number, breeders can expect to fall behind the progress being made by breeders using the highest sires for production, breed index or economic index.
- Highest Production Sires: No doubt about it these sires leave the most production. However, with breeders today wanting animals that are longer lived and more trouble free, these sires are only likely to be the ones of choice for breeders with extremely good management and that have the labor force that can identify problems quickly. The highest production sires were most often below average for reproduction and other management traits.
- Highest Breed Index Sires: TPI, JPI, and LPI have stood the test of time as indexes that identify top sires. TPI and LPI put direct and indirect emphasis on traits that many commercial breeders consider as frills (i.e. stature, balance, and style). Sires that rank highest for breed indexes are usually at or near the top for all traits we studied. All Holstein and Canadian Jersey breeders wanting the little extra in type should feel confident in using their breed indexes when sorting sires. On the other hand, US Jersey breeders cannot expect as much type but more production from following JPI as their index of choice.
- Highest Economic Index Sires: For Holstein and Jersey breeders focused on milk for their revenue source with cows that are healthy, fertile and trouble free then NM$, CM$, and Pro$ are the best ways to compare and choose sires. These indexes are at or near the top for most traits and overall come out on top as compared to the other three ranking systems that we studied. Breeders wanting to reverse the trend for larger and larger cows will find these indexes will do the best job.
- Indexes for Young Sires: With anywhere from 50% to 70% of semen sold coming from genomically evaluated sires, the selection of sires not yet daughter proven is an important matter. The Bullvine recommends that the same rationale be used for proven or genomically evaluated sires when it comes to which total merit index to use. And as has been written and often said, for genomically evaluated sires do not ‘put all your eggs in one basket’ – in other words, use 5-20 doses from any one young sire and then move on to other young sires.
- Overall Use of Total Merit Indexing Alternatives: Step #1 is to objectively predict the genetic merit your herd should have in three and then ten years. Their years corresponds to daughters of the sires being used just now. Step #2 is to have a plan for what you wish to achieve from your breeding program (Read more: What’s the plan? And Flukes and Pukes – What Happens When You Don’t Have a Plan) Step #3 is to then match the total merit index option to your plan. Choosing the incorrect total merit index alternative for your needs could mean that the cows in your herd in a decade are totally wrong. We have seen it where the son or daughter taking over the herd from their parents have cows that do not do a very good job for the next generation. Foresight is important. Breeding involves a considerable amount of vision.
The Bullvine Bottom Line
From this study, The Bullvine can recommend that breeders can expect similar results from using the current national US or Canadian total merit indexes. The challenge ahead will be for breeders to keep up as more total merit indexes that include new and novel traits come into use. Our best advice to progressive breeders is to work closely with a trusted genetics supplier and have them advise you when it comes to the total merit index that is best for you. For the majority of dairy farms using an economic index will fit their program best.
Get original “Bullvine” content sent straight to your email inbox for free.


Leave a Reply
You must be logged in to post a comment.