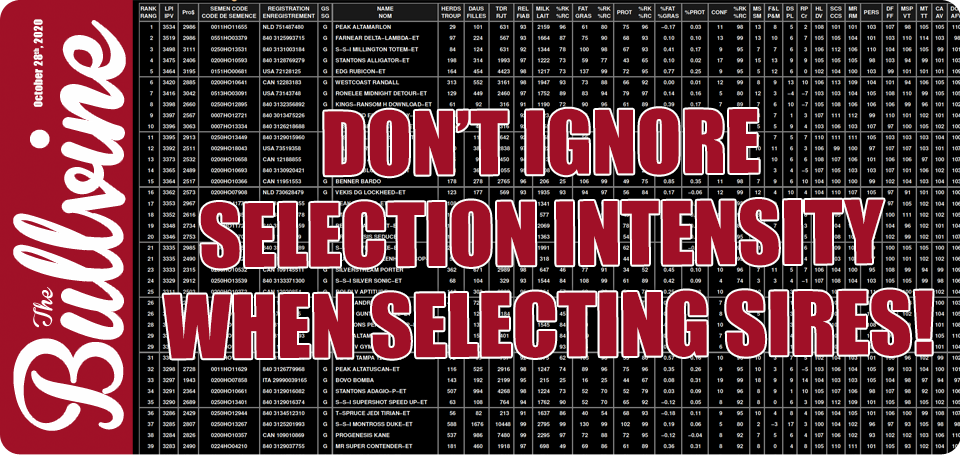
Only top-ranked sires should be good enough to be used in a herd’s breeding program. However, too frequently, this is not the case, when it comes to economically important functional traits. This is not because dairy cattle breeders do not consider functional traits to be important. Often it is because of not understanding the method of expressing functional trait genetic indexes. Or it might be because of a lack of awareness of current breed averages for functional traits. In some cases, it might be because of the lack of awareness of the index level needed for a sire to be an elite transmitter for a functional trait.
Know What Factors Govern Genetic Advancement
There are four components that make up the formula for determining the annual rate of genetic improvement in a herd or a breeding population. Three of the components are: 1. Accuracy of the genetic index (aka REL); 2. The amount of true genetic variability for a trait (something breeders cannot influence); and 3. generation interval (time between parents and progeny).
To calculate the annual rate of improvement the numerator (accuracy x selection intensity [see below] x genetic variability) is divided by the denominator (time in years between progeny and the average age of the parents). The accuracy or ‘REL’ can vary from 20-35% (Parent Average) to 60-75% (Genomic) to 95-99% (Progeny Proven). Generational Interval can vary from 2-3 years for animals with genomic parents to 7+ years for progeny of older and proven parents. It is a breeder’s choice if they choose lower accuracy and rapid generation turnover (using genomic indexed parents) or high accuracy and slow generation turnover (using progeny proven parents).
Selection Intensity (%RK) Matters
The fourth component in measuring the rate of genetic improvement is the intensity of selection (as expressed by %RK). It is the degree of superiority breeders require for a trait when selecting / mating parents.
Aim For Guaranteed Genetic Advancement
Sires with breed average genetic indexes (45%RK to 55%RK) should not be expected by breeders to produce a group of progeny that are superior in a trait.
To be assured of advancing a herd for a trait, the sires used must be at least +1 standard deviation (67%RK) for the trait. For more guaranteed improvement, sires used should be +2 standard deviations (95%RK).
Apply Selection Intensity to Longevity (PL USA or HL CAN)
There are many functional traits for which data is captured on dairy farms and then transmitted to national animal/herd databases. A particularly important functional trait, Longevity (PL/HL), has been selected for this article to explain selection intensity. Tables 1 and 2 contains trait averages and index values needed for improvement for twelve traits.
Most dairy farmers want as many as possible of their cows to live to produce into fourth and later lactations. The extra months that cows remain in a herd reduces the number of replacements needed and gives added lifetime production. Sires with a high PL usually achieve that higher rating because of a combination of above-average ratings for daughter fertility, livability, disease resistance and health. This is the reason why PL is a particularly important number to look at and compare when selecting sires.
It is important to note that the average PL for active proven US Holstein sires is not zero as many may expect it to be. It is +2.3. Therefore, any proven Holstein sire below +2.3 is not a breed improver for PL. For active proven US Jersey sires the average PL is +1.8.
It must be noted that those are just the averages. To be breed improvers and to be elite breed improvers the Holstein PL’s need to be +4.5 (Improver) and +6.7 (Elite). For Jersey sires those values are +3.8 (Improver) and +5.8 (Elite).
For the other US dairy breeds the PL’s values for Average, Improver and Elite proven sires are: Ayrshire — +1.3/+4.3/+7.3; Brown Swiss — +0.7/+3.5/+5.2; Guernsey — +0.6/+2.3/+4.0; Milking Shorthorn — +0.4/+2.1/+3.5; and Red & White — -1.1/+0.9/+ 2.9.
Genomic Sires Should Have Even Higher PL’s
The PL values for marketed US genomic sires are considerably higher than for proven sires. Similar, to the situation for most other traits, breeders should require higher values for genomic sires to allow for some degree of over-estimation. The Average, Improver and Elite PL values genomic sires can be found in Table 2 and are 50+% higher than for active proven sires.
Canada Publishes Functional Traits Indexes Differently Than The US
Canada publishes functional trait index on a scale where the population average is 100 with a standard deviation of 5. The average for functional traits for active Canadian proven sires is estimated to be in the range of 100 to 103. The values for Improvers and Elite can be expected to be 106 and 111 for daughter-proven sires and even higher for sires with only genomic indexes. In short, when reviewing a Canadian indexed sire, if his index for a functional trait is less than 103, he is quite likely below breed average. Worthy of note is the fact that Lactanet/CDN publishes %RK’s for all sire indexes that are not published on the ‘100’ scale.
Pertinent US Index Levels for Twelve US Traits
Tables 1 and 2 show that there is a considerable variation between traits in Average, Improver and Elite index values for twelve important US dairy cattle traits.
Average indexes for active proven sires (Table 1) are available on The CDCB site, yet when The Bullvine surveyed dairy farmers, few knew those averages. There were also few who knew the values for Improvers (67%RK) and Elite (95%RK) … an unfortunate situation.
Table 1: Index Levels (August 2020) For Active Daughter Proven US Sires
| Holstein (562 sires) | Jersey (123 sires) | |||||
| Trait | Average* | Improver** | Elite*** | Average* | Improver** | Elite*** |
| Productive Life (months) | 2.3 | 4.5 | 6.7 | 1.8 | 3.8 | 5.8 |
| Somatic Cell Score | 2.91 | 2.75 | 2.59 | 2.99 | 2.86 | 2.73 |
| Daus Preg Rate | -0.3 | 1.3 | 2.9 | -0.2 | 1.8 | 3.8 |
| Sire Calving Ease**** | 2.5 | 1.9 | 1.3 | n/a | n/a | n/a |
| Daus Calving Ease**** | 3.2 | 2.5 | 1.8 | n/a | n/a | n/a |
| Milk Fever | 0 | 0.1 | 2.2 | 0.1 | 0.2 | 0.3 |
| Ketosis | 0.8 | 1.5 | 2.2 | 0 | 0.4 | 0.8 |
| Milk (lbs.) | 692 | 1526 | 2360 | 225 | 999 | 1773 |
| Fat (lbs.) | 37 | 72 | 107 | 23 | 53 | 83 |
| Protein (lbs.) | 26 | 50 | 74 | 15 | 39 | 63 |
| NM$ | 325 | 592 | 859 | 203 | 387 | 571 |
| CM$ | 336 | 610 | 884 | 217 | 409 | 601 |
* Average – index average for all sires
** Improver – minimum index level needed for a sire to be 67%RK (+1 Standard Deviation)
*** Elite – minimum index level needed for a sire to be 95%RK (+2 Standard Deviations)
**** The publication scale for SCE and DCE changed in August 2020. Numbers are for both proven and genomic sires.
Given that almost 70% of dairy semen sales are for genomic evaluated sires, it is important that Average, Improver and Elite index values be known and used. Table 2 provides those genomic index levels for 3,002 Holstein and 437 Jersey sires.
Table 2: Index Levels (August 2020) For Marketed Genomically Evaluated US Sires
| Trait | Average* | Improver** | Elite*** | Average* | Improver** | Elite*** |
| Productive Life (months) | 3.9 | 5.9 | 7.9 | 3.2 | 4.7 | 6.2 |
| Somatic Cell Score | 2.84 | 2.71 | 2.57 | 2.92 | 2.81 | 2.71 |
| Daus Preg Rate | 0.2 | 1.5 | 2.8 | 0.3 | 2.9 | 4.5 |
| Sire Calving Ease**** | 2.5 | 1.9 | 1.3 | n/a | n/a | n/a |
| Daus Calving Ease**** | 3.2 | 2.5 | 1.8 | n/a | n/a | n/a |
| Milk Fever | 0.1 | 0.2 | 0.3 | 0.1 | 0.2 | 0.3 |
| Ketosis | 1.3 | 1.8 | 2.3 | 0 | 0.3 | 0.6 |
| Milk (lbs.) | 868 | 1459 | 2010 | 383 | 1032 | 1681 |
| Fat (lbs.) | 58 | 85 | 112 | 33 | 55 | 77 |
| Protein (lbs.) | 38 | 55 | 72 | 23 | 41 | 59 |
| NM$ | 527 | 736 | 945 | 326 | 572 | 718 |
| CM$ | 549 | 765 | 984 | 347 | 600 | 753 |
* Average – index average for all sires
** Improver – minimum index level needed for a sire to be 67%RK (+1 Standard Deviation)
*** Elite – minimum index level needed for a sire to be 95%RK (+2 Standard Deviations)
**** The publication scale for SCE and DCE changed in August 2020. Numbers are for both proven and genomic sires.
In Reality – Genetic Improvement Depends on Using Top Sires
The practice of only using the best sires for the important traits is a key factor in advancing an animal, a herd and a population. Using average rated sires will result in the cow family and the herd quickly falling behind. Using top genetics is paramount for dairy farmers to stay viable, competitive and sustainable.
The Bullvine Bottom Line
The intensity applied to selecting and using the best sires really does matter. The %RK of a sire’s trait index is a quick way of knowing where the sire ranks in the population for the trait. The age-old genetic improvement advice always holds true – Use the Best. Ignore the Rest.
Step #1 is to prioritize the traits a female or herd needs. Step #2 is to only purchase semen or embryos that will advance your animal or herd. Step #3, when mating cows and heifers, use Improver or Elite sires for traits where the female is not above average. Breeding is a numbers business. Use the numbers to your advantage.
Get original “Bullvine” content sent straight to your email inbox for free.
[related-posts-thumbnails]


