Since the very first genomic young sire lists were published in April of 2011, it certainly has been a very bumpy ride for the dairy breeding industry. Top sire lists are changing almost monthly. Contract sires seem to go cold even before breeders have a chance to breed their animals. This has many breeders feeling dizzy and asking “Does this genomic index thing really work?”
We here at the Bullvine decided to take a closer look. We took the Top 20 gTPI sires from April of 2011 and compared them to the Top 20 proven sires from April of 2014 to see who performed better over the past three years. The reason we are using the top 20 sires is that based on semen sales, most breeders, when using high index sires, prefer to stick to the very top of the list. Therefore, doing a comparison on the top 200 or even 100 sires would not be an accurate representation based on actual usage. The following is what we found.
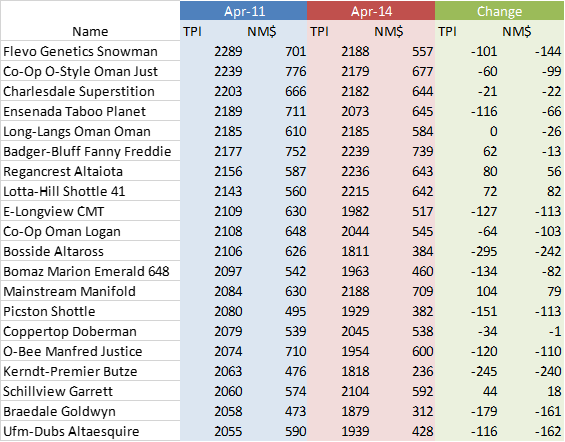
TABLE 1 – Top Genomic Sires April 2011 to April 2014
The top 20 Genomic Sires from April 2011 dropped about 10% upon receiving their official daughter proofs in April 2014. Key areas that saw significant decline were DPR (57%), PTAF (31%), PTAM (27%), PL (24%) and PTAP (26%). This tells us that the genomic markers used in April 2011 for these traits were not as accurate as say SCS, SCE, DCE, UDC and PTAT, which saw less significant declines from April 2011 to April 2014.
TABLE 2 – Top Proven Sires April 2011 to April 2014
On average, the top proven sires from April 2011 held up pretty well on the April 2014 results seeing only 3% decline. Though interestingly we do see the same trend as in the genomic sires where the PL, DPR, PTAF lead the way with the greatest declines. Also of interest are the changes in ranking. In April 2014 the top three sires from this list were Badger-Bluff Fanny Freddie, Regancrest Altaiota, and Lotta-Hill Shottle 41 none of which were in the top 5 in April 2011’s top proven sire list.
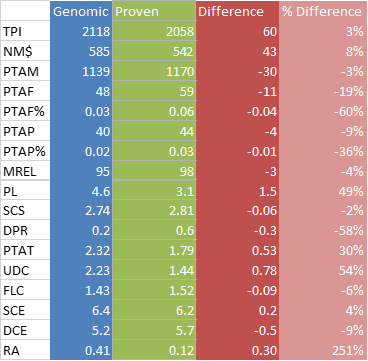
TABLE 3 – Comparison of Top Genomic and Proven Sires from April 2011 (April 2014 values)
If you had used the top 20 genomic sires from April 2011 rather than using the top 20 proven sires from April 2011, you would have come out 3% ahead. More importantly let’s look at each sire did in the actual ranking.
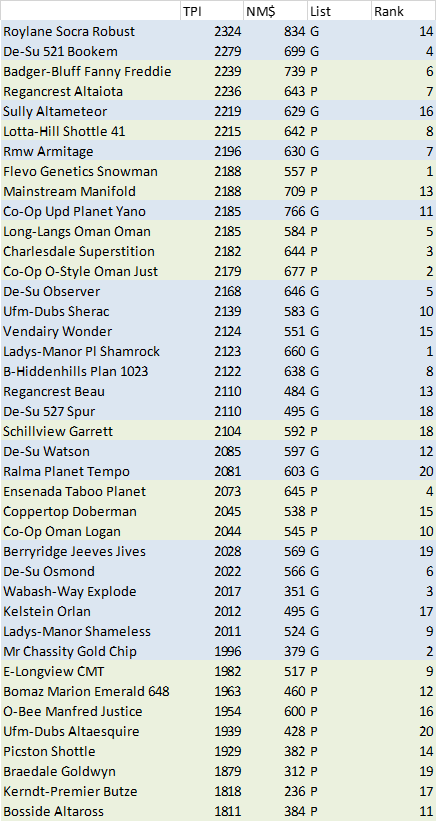
TABLE 4 – Ranking of Top 20 Genomic and Top 20 Proven Sires from April 2011 in April 2014 values
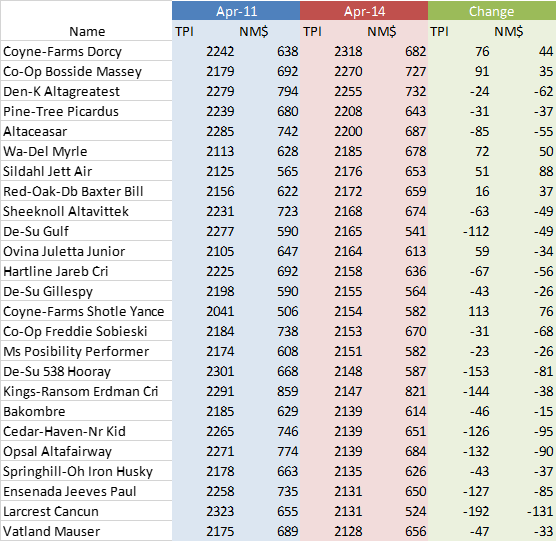
Interestingly none of the top 7 sires in April 2014 were from the top 3 on the April 2011 Top Genomic or Top Proven Sires list. In fact, the top proven sire in April 2014 was Robust, who was 14th on the Top 20 Genomic Sires in April 2011. The top Genomic Sire from April 2011, Shamrock, is actually in 17th spot on this list. That is more than 200 points behind Robust, who in April 2011 was 169 TPI points behind Shamrock. That is a 370 point swing between these two sires. When you think about this from the effects it has on your breeding program, owners of daughters from Ladys-Manor Pl Shamrock, Mr Chassity Gold Chip, and Wabash-Way Explode who once thought they would have the next list toppers for sure. Now they find themselves (on average) behind daughters of Roylane Socra Robust, De-Su 521 Bookem, Sully Altameteor, RMW Armitage, Co-Op Upd Planet Yano, De-Su Observer, UFM-Dubs Sherac, and Vendairy Wonder. When they were making their mating decisions back in April 2011, breeders thought the first group would surely outperform the second.
Analysis reveals an even more alarming situation than this. What it shows us is that sires that were not even on the Radar back in April 2011, ended up outperforming the top 20 Genomic sires from April 2011. In fact, 4 of the 10 sires from April 2011 were not in the top 20 Genomic or Proven Sires in April 2011, and 25 of the top 30 proven sires from April 2014 were not on the top 20 Genomic or Proven Sires lists in April 2011.
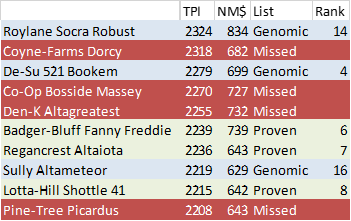
TABLE 5 – Top 10 Proven Sires April 2014
TABLE 6 – Top 40 April 2014 Proven sires that were missed
While a few of these sires may not have been missed because they were about to receive their proven daughter proof shortly, the majority fall into a situation where they were just not as high ranking as the top Genomic sires from April 2011 but they held their values much better.
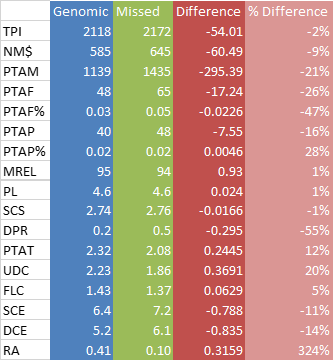
When looking at the 25 sires that were in the top 40 proven sires in April 2014 that did not find themselves in the top 20 Genomic or Proven Sires in April 2011, a strong trend starts to show itself. All of these sires were within 15% of the top genomic sire from April 2011, Roylane Socra Robust. This tells us is that you can’t only use the top 10 or 20 genomic sires, if you expect to have the best results in your breeding program. In fact, you need to consider sires that are within 15% of the top genomic sire. When you compare the top 20 Genomic Sires from April 2011 to these 25 sires you find the following:
TABLE 7 – Comparison of Top 20 Genomic Sires from April 2011 to Missed Sires
Applying this analysis to today’s breeding strategy shows us that we cannot just use the top 20 Genomic sires that are available, in order to have the best long term results. Instead, we need to use sires that fall within 15% of the top current genomic sire, Cogent Supershot, who has a current gTPI of +2625. That means all sires that are 2231 TPI currently could easily be in the top 10 proven sires in April 2017. That will be a list of sires that has over 600 bulls on it. Even if you remove the two proven sires (Robust and Dorcy) as well as those sires that are older and about to receive daughter proofs shortly, you are still left with over 500 genomic sires to choose from. That means that currently there are over 500 genomic sires that could be in the top 10 proven sires in April 2017.
The Bullvine Bottom Line
While many breeders battle to get their hands on the early release semen of the top 10 genomic sires, and A.I. units are putting extremely high prices on this semen, analysis of performance data from the top sires in April 2011 shows us that these sires are not necessarily going to outperform the other available sires. Breeders who used sires like Ladys-Manor Pl Shamrock, Mr Chassity Gold Chip and Wabash-Way Explode now find themselves behind sires such as Den-K Altagreatest, Pine-Tree Picardus, and Altaceasar. These were all sires that in April of 2011 were not even on most breeders’ radars. While genomic indices are an excellent tool for helping develop a short list of sires to use. Performance data shows us that sires that are within 15% of the genomic sires can still produce a top 10 sire. For your breeding program, this means that you need to take a look at all sires who are within 15% of the top sires and consider them for use. This will help you develop your own shortlist, and then using corrective mating tools like GPS (Read more: gPs– Genetic Profile Systems – Dairy Cattle Breeding Made Simple), will help you determine exactly which of these sires will perform best on a mating by mating basis. You can’t just use the top 20 Genomic Sires and expect to get ahead of everyone else. Past performance shows this just doesn’t work.
Not sure what all this hype about genomics is all about?
Want to learn what it is and what it means to your breeding program?
[related-posts-thumbnails]





Okay, I’ve been commenting on this on twitter so let me elaborate here. Since I don’t know how to get access to this data let me make a suggestion for something you might try (i’d be happy to do it if you emailed me the file!). For every trait, for all your classes of bulls, what is the correlation between the 2011 and 2014 breeding value?
What we’d expect, and what would tell you to keep using those top genomic bulls, is that there is a positive correlation between 2011 and 2014, and that the correlation is not wildly different between bulls in top 20 and bulls in say 200-500. You’ve found a few bulls who were in 200-500 who really improved, but a few also really tanked, and most probably stayed about the same.
For the top 20 bulls, i’d expect that their ‘top’ ranking was partially due to model noise. Its not really making a highly accurate delineation between the top 20 and the rest of the top 500, but its strong enough to count. So while several of htose bulls dropped hard, 3 of them stayed in the top 10! Overall, as you note they outperformed the proven bulls. Now you could have randomly chosen the wrong ones if you’re not actually selecting bulls evenly across the top 20. But maybe you should be.
Its important to note that even though this group dropped 10% it doesn’t mean they’re bad, or that their old breeding values don’t correlate with their new breeding values. I’d also expect that the models have improved with so many more observations added in.