What dairy breeders are discovering about the gap between traits that theoretically eliminate bulls and the ones that actually prevent collection and sale
EXECUTIVE SUMMARY: The traits that should disqualify bulls increasingly don’t—and that gap is costing commercial producers real money. While genomic screening has driven lethal haplotype carriers below 2% according to Lactanet data, problematic traits like elevated SCS and marginal udders now get marketed with management caveats rather than screened out. Operations ranging from small tie-stalls to 20,000-cow multi-state enterprises share a striking philosophical alignment: cow families and validation matter more than catalog numbers alone. GenoSource tracks cow families across generations—their matriarch, Miss OCD Robust Delicious, Holstein International Cow of the Year in 2018, still contributes embryos today. McCarty Family Farms discovered that roughly a quarter of their parentage records were incorrect before implementing systematic tracking that now achieves compliance in the mid-to-high 90s. Canadian operations like Walnutlawn, Lovholm, and Bosdale have bred World Dairy Expo champions while focusing on cow families rather than chasing the latest rankings. Their shared conviction: genomics tells you what genes an animal carries, but pedigree analysis reveals whether families actually transmit predictably. Commercial producers can close this gap through greater sire diversification, realistic expectations about young genomic predictions, and systematic tracking of what actually works in their own herds.
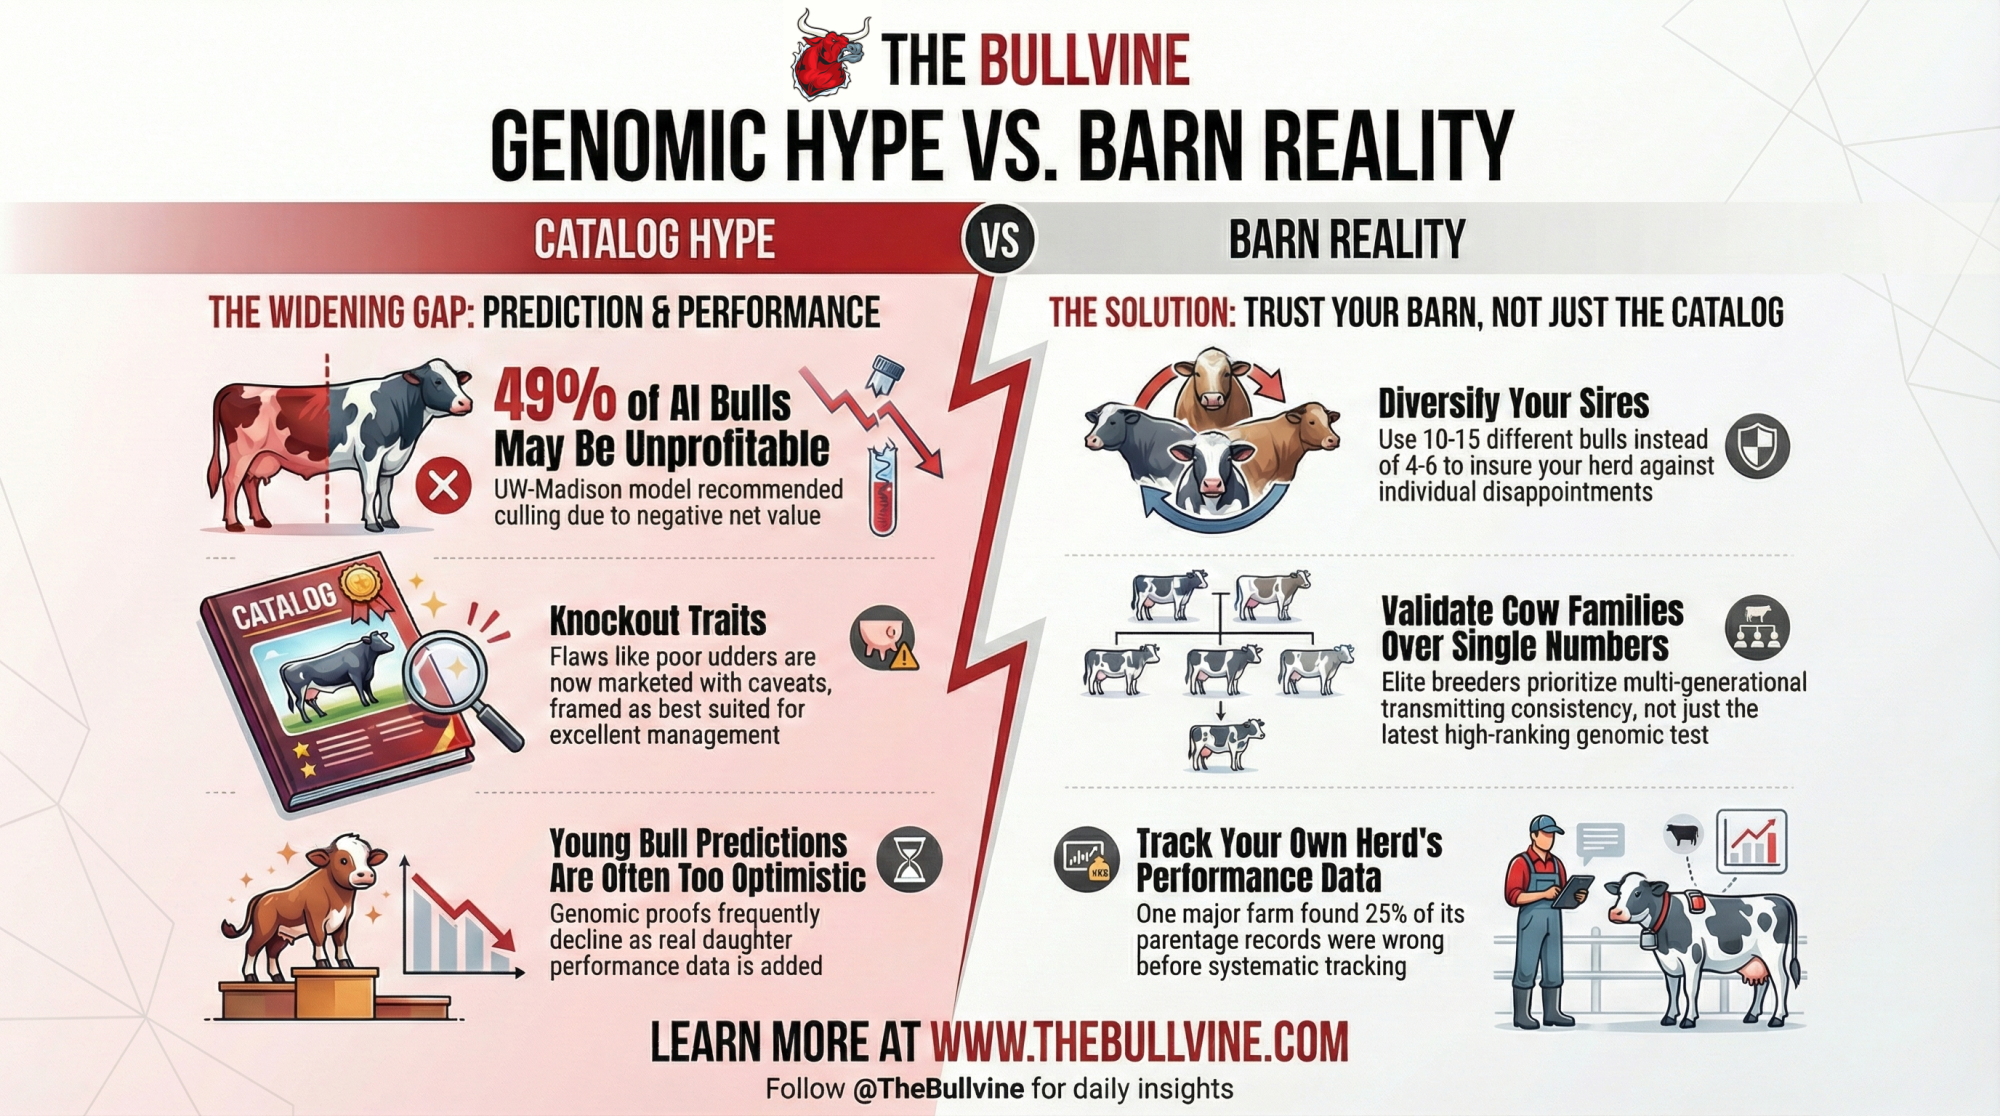
Here’s a number that caught my attention when I first saw it: according to a 2023 paper in Animals describing the BullVal$ decision-support model developed at the University of Wisconsin-Madison, when researchers applied their economic framework to actual AI company inventory, they recommended culling 49% of bulls because their projected net present value was negative.
Nearly half. That’s not a typo.
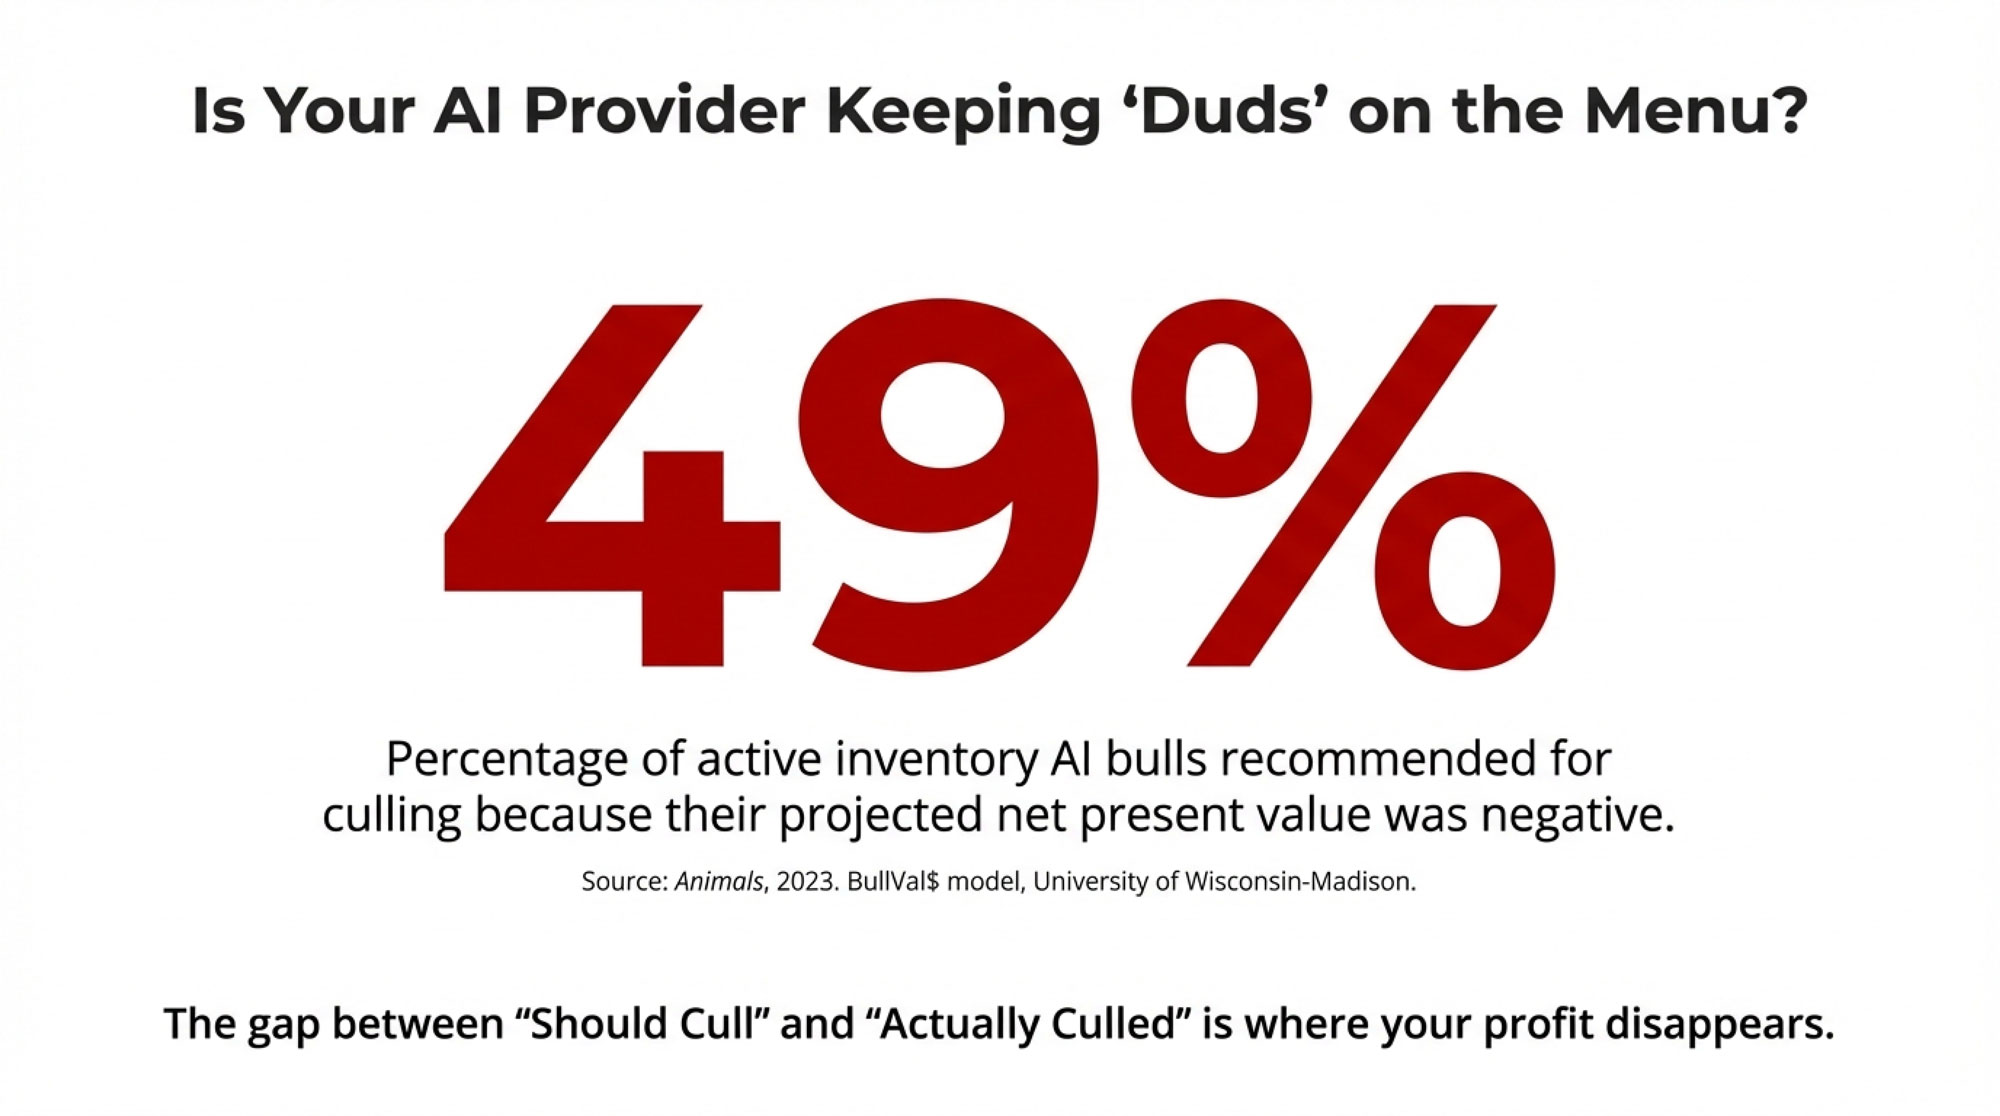
Whether those bulls were actually removed from service? The paper doesn’t say. And honestly, that gap between “should cull” and “actually culled” tells you a lot about how knockout traits really work today.
For decades, the industry operated on a pretty straightforward premise: certain genetic weaknesses could render an otherwise elite bull unmarketable. Terrible udders on a high-production bull? Knockout. Daughters that couldn’t get pregnant despite great indexes? Knockout. These single-trait failures were supposed to disqualify bulls regardless of their other merits.
But the reality has gotten more nuanced. The traits that actually prevent bull collection have narrowed considerably, while the traits that probably deserve more scrutiny often get marketed around rather than screened out. With component prices holding strong and butterfat premiums rewarding production efficiency, the economic stakes of genetic decisions have rarely been higher. Understanding this dynamic matters whether you’re running 200 cows in Vermont or 5,000 in the Central Valley.
What Actually Constitutes a Knockout Trait Today
Let’s start with what genuinely prevents a bull from being collected and marketed. Based on industry data and published research, true knockouts fall into surprisingly narrow categories.
Physical impossibilities remain absolute barriers. Bulls that can’t produce viable semen, have poor libido, or produce semen that doesn’t survive freezing simply can’t generate revenue. Studies on breeding bull disposal consistently show that subfertility issues—especially poor semen quality, inadequate libido, and poor semen freezability—are among the leading reasons bulls get culled from AI programs. These physical limitations account for the vast majority of young bull removals, not genetic trait concerns.
Genomically verifiable defects create binary decisions. Haplotypes like HH1 through HH6, which cause embryonic loss or calf mortality, are now routinely screened via genomic testing. Genetic evaluation centers like CDCB publish carrier status for these defects on most bulls marketed in North America—it’s become standard practice.
The screening has been effective. Lactanet reports that for Canadian Holsteins born between 2020 and 2023, carrier frequencies for HH1 through HH4 are now below the 2% level. HH5 carriers have dropped to close to 5%, and HH6—discovered only in 2019—has reached nearly 2% for 2023 births. The newer concern is Early Onset Muscle Weakness Syndrome (MW), which Lactanet added to its routinely published evaluations in 2024. Because it’s a more recent addition to screening panels, carrier frequency remains higher and warrants continued attention. But for the established haplotypes, genomic testing has largely solved the problem before bulls ever reach collection—exactly what the technology was supposed to do.
| Trait Category | Industry Performance | Current Status | Feedback Loop Speed | Farmer Action Needed |
| Lethal Haplotypes (HH1-HH4) | ✓ Solved | Below 2% carriers | Immediate (genomic test) | Trust genomic screening |
| HH5 Haplotype | ⚠ Improving | ~5% carriers | Immediate (genomic test) | Verify carrier status |
| Somatic Cell Score (SCS) | ⚠ Unresolved | Bulls >3.00 SCS still marketed | 1-2 lactations | Apply personal cutoffs |
| Inbreeding Accumulation | ✗ Worsening | Doubling annually vs. pre-genomic era | 3-5+ generations | Diversify bloodlines now |
| Young Bull Prediction Accuracy | ✗ Overstated | Common 100+ NM$ downward drift | 5-6 years (daughter proof) | Mentally discount 10-15% |
| Stature Extremes | ✓ Self-corrected | Market shifted to moderate | 1-2 lactations | Select <+2.0 stature |
You either carry the mutation, or you don’t. There’s simply no gray zone to work around.
Market-specific requirements have emerged as conditional knockouts—and they vary more by geography than most North American producers realize.
For Jersey programs in some regions, sexed semen production capability has become nearly essential. In VikingJersey herds, sexed semen usage reached 72% of all dairy inseminations by March 2021, according to VikingGenetics. In Norway, 99% of VikingJersey semen sales are sexed. In the United States, the trend is growing but less dramatic—Journal of Dairy Science data shows Jersey sexed semen usage increased from 24.5% to 32.1% between 2019 and 2021. Still, a Jersey bull that can only produce conventional semen faces a shrinking market regardless of his genetic merit.
| Market/Region | Breed | Sexed Semen Usage (%) | Implication for Bulls |
| Norway | Jersey | 99% | Cannot produce sexed = unmarketable |
| VikingJersey Herds (Mar 2021) | Jersey | 72% | Sexed capability near-essential |
| United States (2019) | Jersey | 24.5% | Conventional bulls still viable |
| United States (2021) | Jersey | 32.1% | Growing pressure for sexed capability |
A2A2 status has become essential for producers targeting A2 milk premiums—a consideration that barely existed ten years ago.
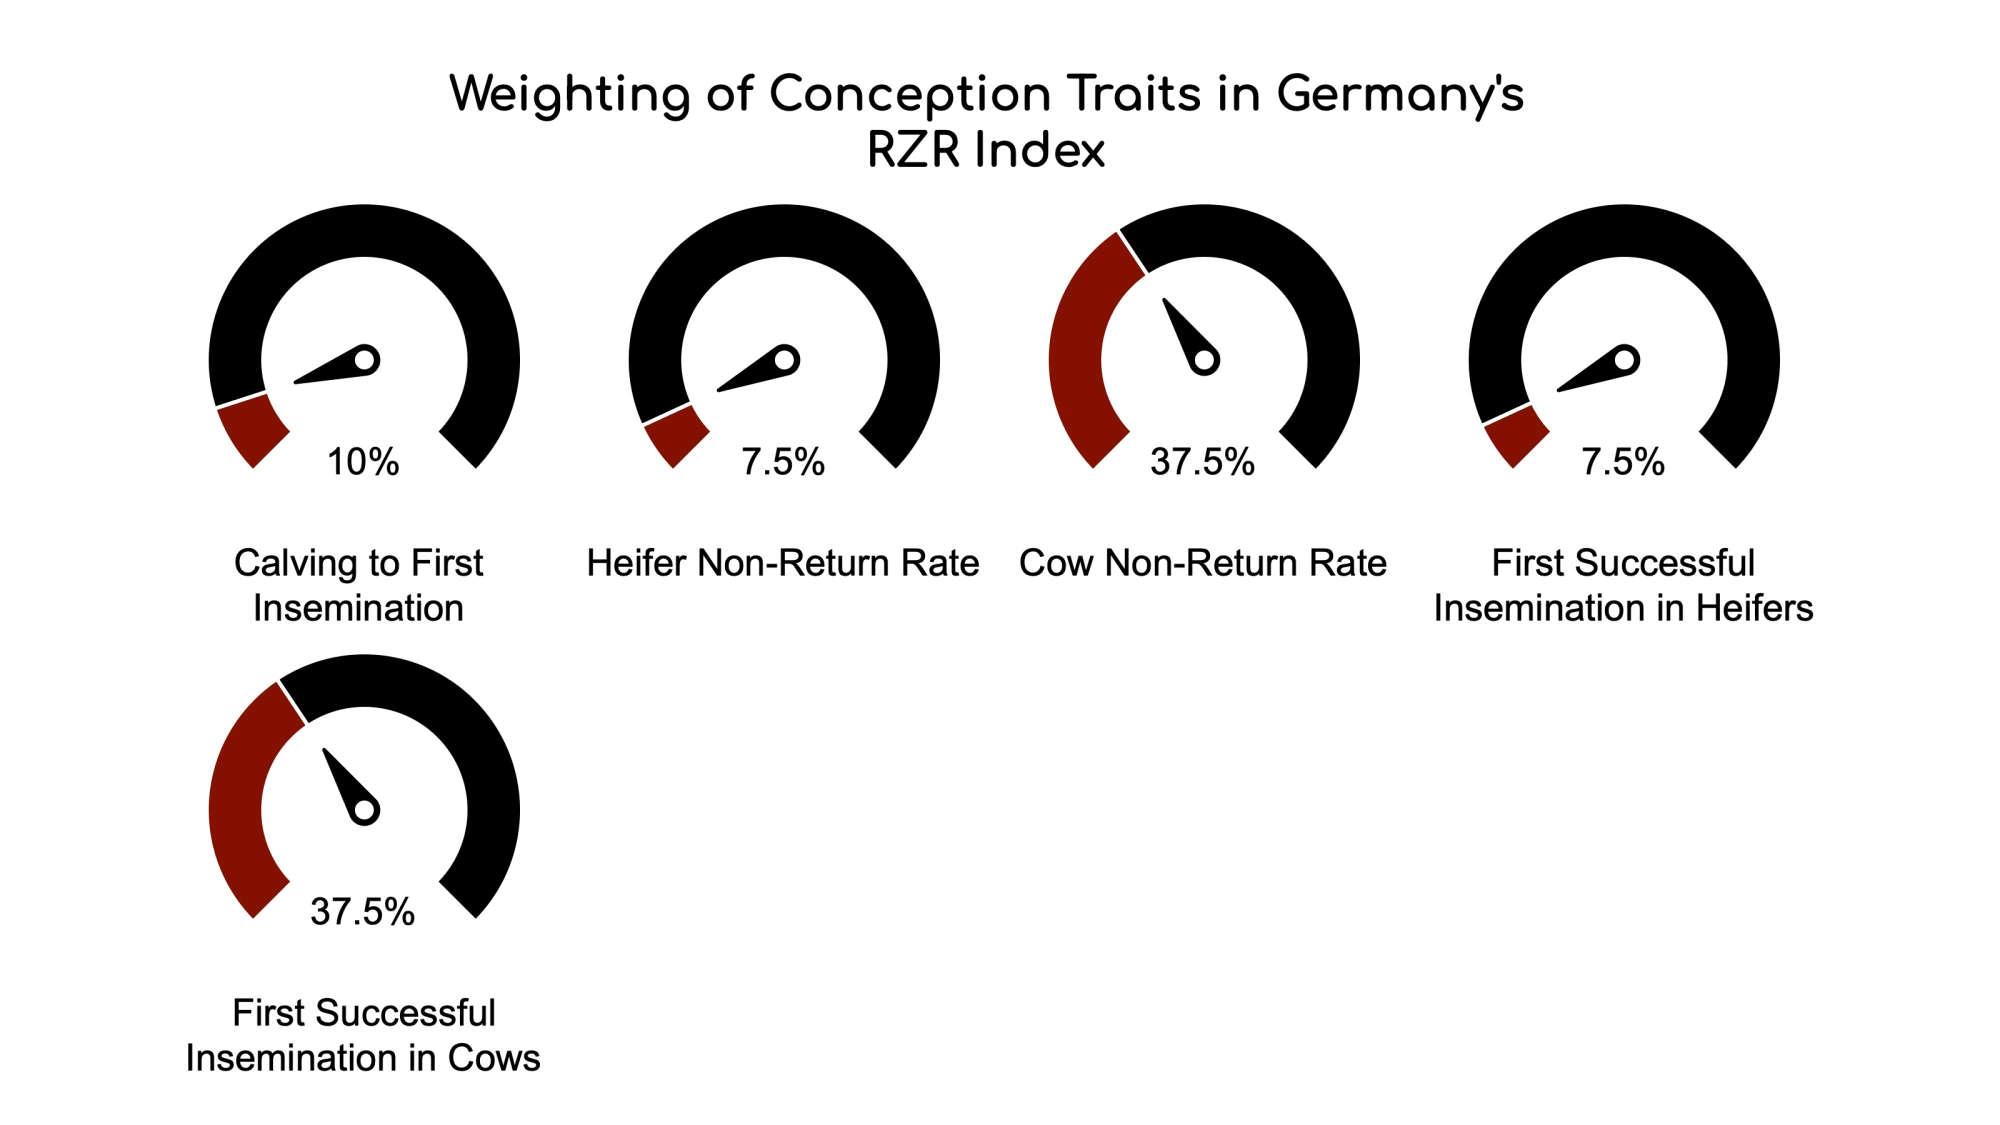
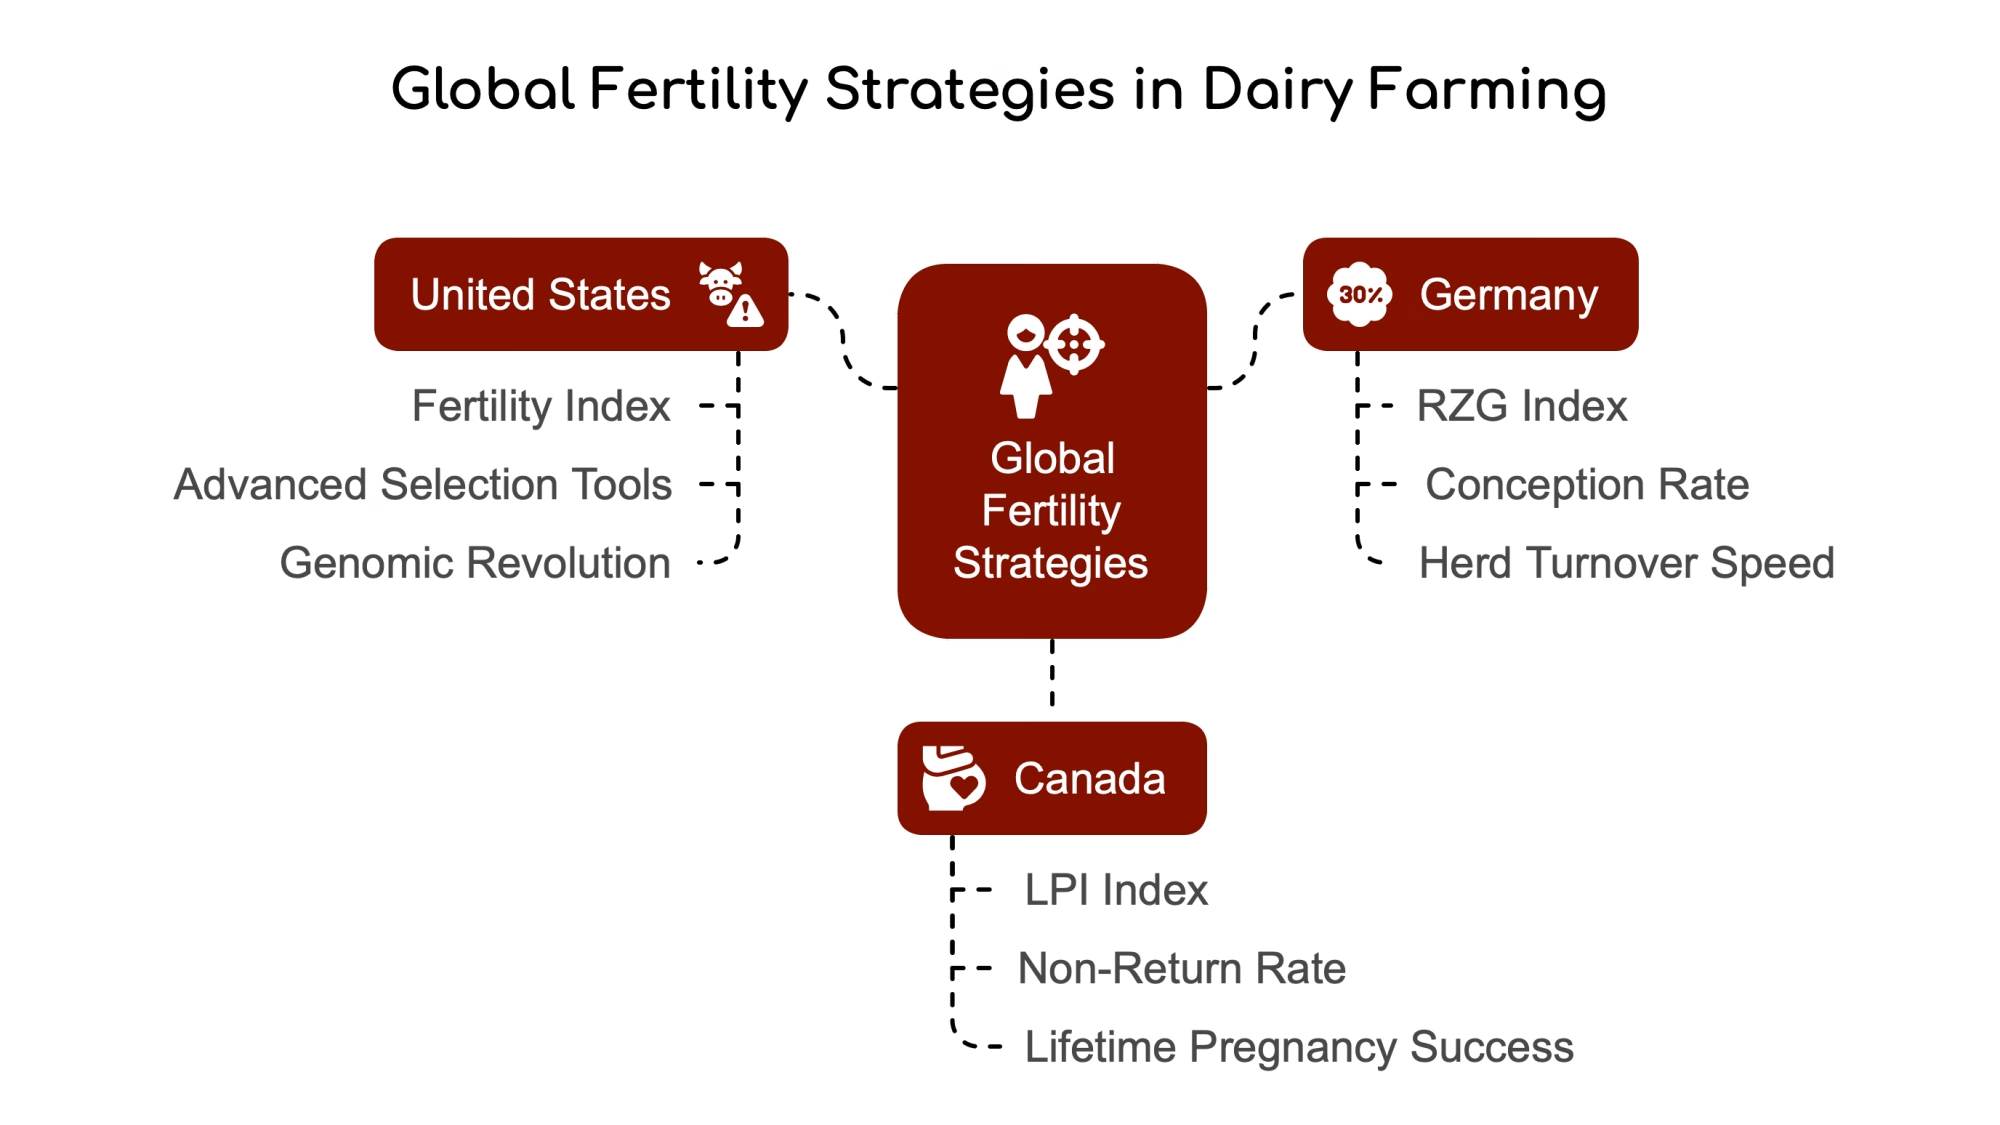
In Dutch and Flemish markets, the NVI total merit index places substantially more weight on functional traits—longevity, health, udder health, fertility, and claw health—than on production, according to CRV documentation. That’s a fundamentally different emphasis than TPI’s production-heavy weighting. Buyers in these markets apply stricter thresholds for feet and legs, udder health, and milking speed than typical US selection criteria.
What does that fragmentation mean practically? A bull that ranks elite on TPI may look mediocre on NVI or RZG because those indexes weigh traits so differently. Getting a sire that fits all systems requires more, not less, due diligence, as genomic selection has expanded internationally.
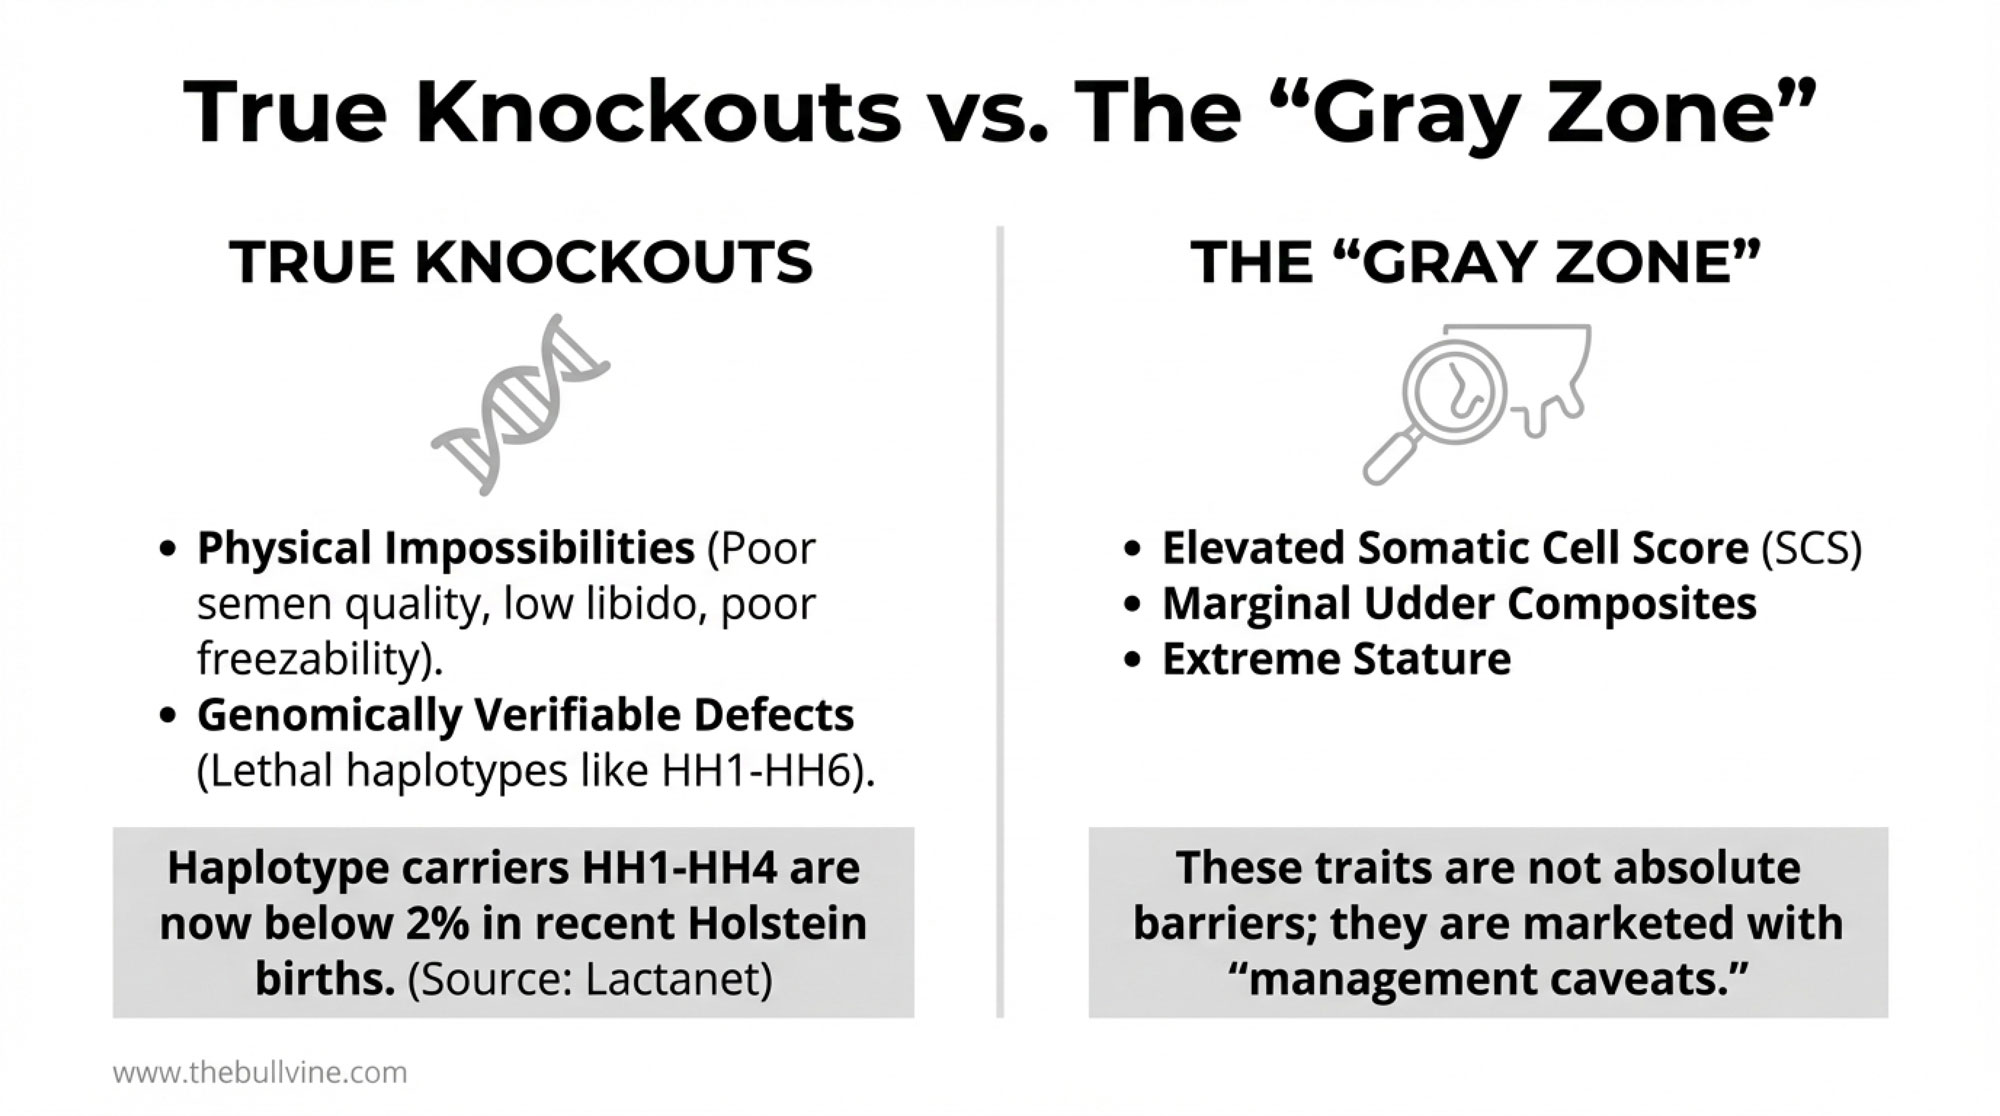
The Gray Zone: Traits That Deserve Attention But Don’t Stop Collection
Experienced breeders often report similar patterns when it comes to somatic cell score. Bulls with SCS predictions around 3.00 or higher tend to leave daughters with noticeable cell count issues. The correlation isn’t perfect, but it’s consistent enough that many elite operations treat elevated SCS as a serious concern regardless of other merits.
You’ve probably noticed this in your own cows. Genetic evaluations consistently show that higher SCS breeding values are associated with a higher genetic predisposition to mastitis, which is why many breeders treat elevated SCS as a red-flag trait when choosing sires.
But here’s the market reality—elite genetics operations represent a small fraction of total semen purchases. When a breeder decides not to use a bull because of concerning SCS, the AI company’s sales numbers barely register the difference. They’ve already moved thousands of units to commercial operations that evaluated the NM$ ranking and placed orders.
Regional Threshold Differences
What constitutes a knockout varies substantially by market—and understanding those differences matters if you’re selling genetics internationally or evaluating bulls developed for other markets.
European buyers, particularly in the Netherlands and Belgium, tend to apply harder cutoffs on functional traits than North American selectors. The Dutch-Flemish NVI devotes substantial weighting to health, fertility, longevity, and conformation, with claw health and saved feed costs explicitly included since 2018. A bull borderline on udder health or feet and legs might move thousands of units in Wisconsin but struggle to gain traction in the Dutch-Flemish market. Conversely, some international markets still use raw milk volume as a primary screening threshold—which might seem outdated to producers focused on fat-plus-protein economics, but reflects local pricing structures.
The practical implication: when evaluating an imported bull or one heavily marketed for “global” appeal, check how he actually ranks in his home market’s index system. Elite TPI doesn’t guarantee elite LPI, RZG, or NVI performance—and the gaps can be substantial.
Industry geneticists at major AI companies acknowledge that severely negative mammary scores effectively disqualify bulls in most international markets. That sounds like a knockout trait. But what actually happens when an elite genomic bull tests at + with a slightly negative udder composite?
In practice, the marketing materials emphasize his exceptional production genetics and outstanding feet and legs. The udder concern gets mentioned—but perhaps framed as “best suited for herds with excellent management protocols.” Let me be direct about what that language means: when a catalog says a bull is “best suited for excellent management,” it’s a signal that his daughters will need him. The bull gets collected. The semen gets sold. And to be fair, in many well-managed operations, those daughters may perform just fine.
This isn’t meant as criticism of AI companies—they’re responding to market signals and customer demand. But it does mean commercial producers benefit from understanding that “knockout trait” and “marketed with management caveats” represent different categories.
The Stature Correction: How Trait Priorities Actually Shift
Perhaps no trait better illustrates how genetic priorities evolve—and why some corrections happen faster than others—than stature.
For decades, the dairy industry selected for taller cows. Show rings rewarded height. Classification systems scored it positively. The prevailing assumption was that a bigger frame meant bigger capacity for high production.
That’s changed. Tall bulls that would have commanded premiums a decade ago now face resistance in many markets—a change driven largely by commercial producer feedback rather than show ring preferences.
What changed wasn’t the underlying biology. What changed was that commercial producers—particularly those with freestall facilities—accumulated enough direct experience to question the institutional preference for height. Many breeders with freestall operations learned the same lesson independently: their tallest cows didn’t hold up as well in the stalls, often ending up moved to alternative housing or culled earlier than expected.
Research eventually caught up to what farmers were observing. A Canadian Dairy Network analysis found that stature had essentially no meaningful correlation with herd life compared with other functional traits—despite decades of positive selection for tall cows. European research has similarly shown that very heavy cows are often less efficient than moderate-weight animals, producing less milk per unit of feed intake at the extremes of body size.
Why did the stature correction actually work? A few key characteristics made the difference:
The problem was visible within individual herds. Farmers could see their tall cows go lame, struggle with stall fit, and get culled earlier. Attribution was relatively clear—tall cows had specific, observable problems that were harder to blame on nutrition or management alone. The solution was straightforward: select for moderate stature. And crucially, there was no competitive penalty—shorter bulls still carried high genetic merit for production.
This last point matters enormously. When you can address a problem without sacrificing production, the market tends to self-correct. When fixing a problem means accepting lower genetic merit… those corrections stall. Sometimes for decades.
The Problems That May Not Self-Correct
Here’s where the conversation gets more complicated—and more important for long-term planning.
Inbreeding rates are increasing. A 2022 study in Frontiers in Veterinary Science analyzing Italian Holstein populations found that genomic inbreeding has been increasing measurably since the adoption of genomic selection, with annual genomic inbreeding growth roughly doubling compared to the pre-genomic era. Studies in Dutch-Flemish, French, and North American populations show broadly similar patterns.
Why doesn’t this trigger a market correction like stature did? Probably because inbreeding depression manifests through diffuse symptoms—slightly lower fertility here, slightly higher disease incidence there, somewhat shorter productive life. No individual producer can easily identify inbreeding as the specific cause of their herd’s challenges. The effect appears real, but it’s invisible primarily at the individual farm level.
Genomic predictions for young bulls tend to be optimistic. Canadian and US evaluation centers have documented that daughter proofs for genomically preselected sires often drift downward relative to their original genomic predictions. The mechanism makes sense: when you genomically test millions of animals and select the absolute best fraction of a percent as bull mothers, you’re selecting from an already pre-selected population. The genomic model assumes something closer to random sampling. Reality works differently.
We’ve seen this pattern play out as daughter data accumulates. Several heavily-used young sires from 2021-2022 have come in meaningfully below their original predictions—in some cases by 100 points or more on NM$. The pattern isn’t universal—some bulls hold or even improve—but the downward drift is common enough that mentally discounting those catalog numbers reflects reality better than taking them at face value.

What does this mean practically? Consider this scenario: if you’re selecting bulls at +900NM$ expecting +$900 performance, but reality delivers something closer to +$720, that’s a meaningful gap in genetic merit you’re not capturing. Across 100 replacement heifers per year, that kind of shortfall adds up to real money—potentially tens of thousands of dollars annually in genetic value you expected but didn’t receive. That’s not a published industry average; it’s a realistic scenario producers should be prepared for when relying heavily on young genomic bulls.
Heat tolerance is becoming increasingly relevant. Genetic and management research has highlighted a tension between high production and heat tolerance. Higher-producing cows generate more metabolic heat, making them more vulnerable to heat stress in hot, humid conditions—a relationship that Lactanet and other organizations have flagged in their heat-tolerance extension materials.
This tension between genetic selection and climate adaptation may not self-correct through normal market mechanisms. The feedback is slow, attribution is difficult, and any producer who prioritizes heat tolerance typically accepts some trade-offs in production metrics. For operations in the Southeast or Southwest, this is already pressing. Upper Midwest operations have more runway, but increasingly intense summer heat events are changing that calculus.
The Feedback Loop Challenge
What really distinguishes problems that get market correction from problems that persist?
Stature got corrected because problems became visible in 1-2 lactations, cause-and-effect was reasonably clear, solutions didn’t require sacrificing production, and individual farmer decisions aggregated into a market signal.
Challenges like inbreeding accumulation, genomic prediction bias, and heat tolerance adaptation may persist because problems emerge gradually across 3-5+ lactations, attribution is genuinely difficult at the individual herd level, solutions often involve trade-offs against genetic merit, and there’s no clear mechanism for individual observations to aggregate into market pressure.

Here’s a concrete timeline that illustrates the problem: A bull marketed heavily in early 2021 produces daughters that start calving in late 2022. You get meaningful first-lactation performance data by mid-2024. By the time you have enough information to evaluate whether he delivered on his genomic promise—late 2025—you’ve already bred to his sons and grandsons for two or three generations. If there’s a problem, it’s already propagated through your herd before you knew it existed.
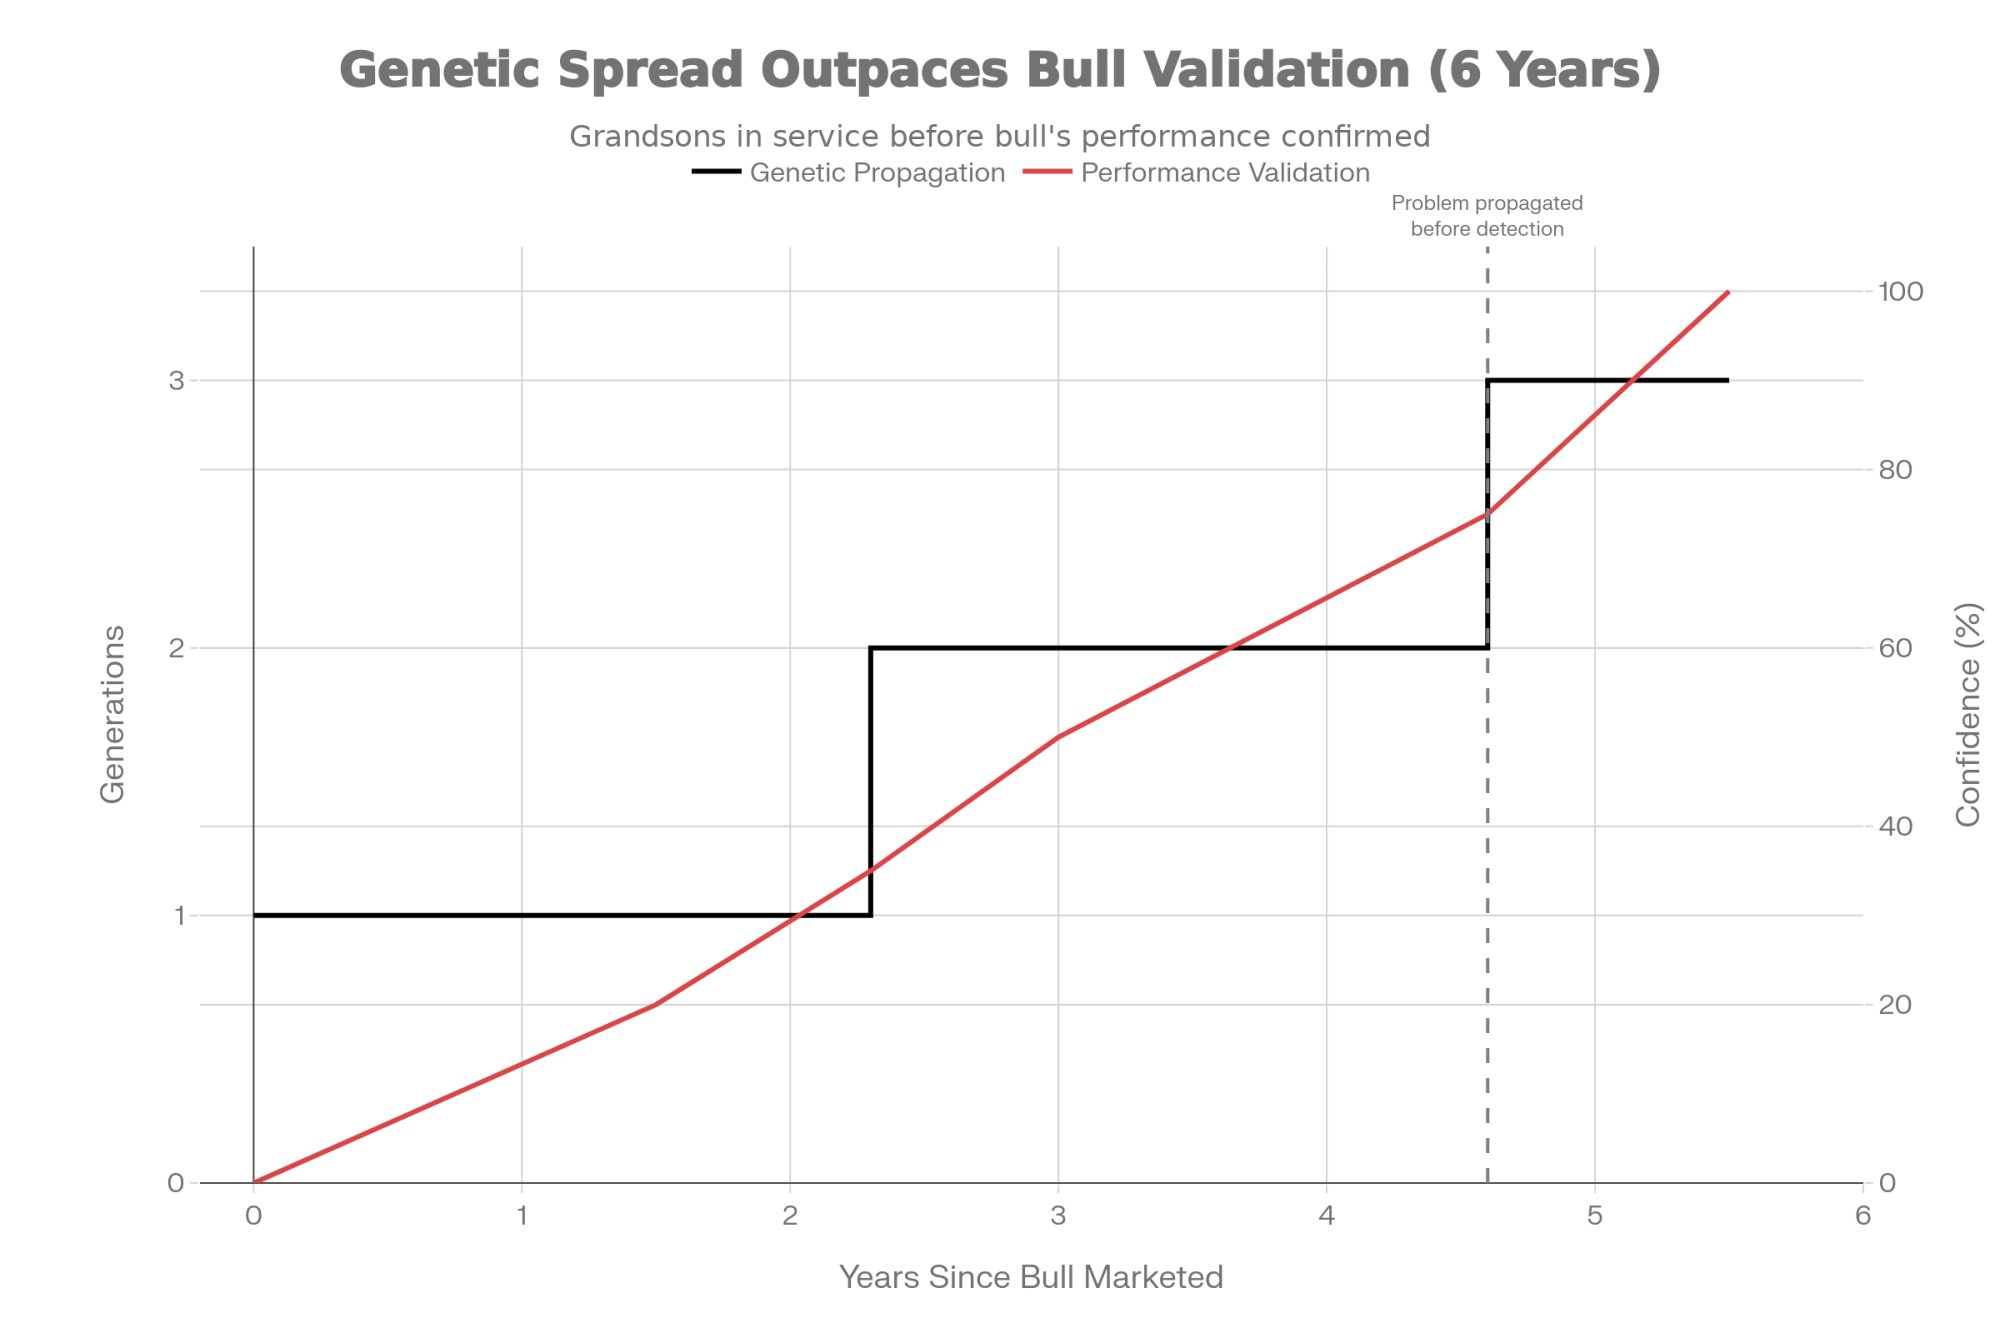
Genomic selection now proceeds in 2-3 year cycles—generation intervals have dropped from around 5 years pre-genomic to as low as 2.3 years for some selection pathways. But daughter performance feedback still takes 5-6 years to accumulate. The math doesn’t work in the producer’s favor.
To be fair, genomics has delivered substantial progress on many traits—something AI company geneticists rightly point to when defending the system. US data from CDCB and Holstein USA show that rates of severe calving difficulty have dropped substantially over the past few decades as breeders have consistently selected for calving ease. But calving ease had characteristics that enabled rapid correction: immediate feedback, clear attribution, and universal agreement that it was worth addressing.
The traits that concern forward-thinking breeders today often lack those same characteristics.
What Elite Operations Do Differently
Two operations—one placing around 200 bulls into AI annually from a large Iowa herd, the other managing the largest registered Holstein herd in the United States across multiple states—share a striking philosophical alignment with smaller, elite breeders: cow families and validation matter more than catalog numbers alone.
The Genomic Validators
“We’re not afraid to mate apparent opposites. Progress requires calculated risks,” says Kyle Demmer, COO of GenoSource, a family-owned Iowa operation that’s become a global genetics powerhouse since eight families combined their herds in 2014. But those calculated risks aren’t blind bets on genomic numbers—they’re grounded in cow-family evaluation spanning generations.
When GenoSource CEO Tim Rauen discusses his favorite cow, the answer isn’t their highest-testing heifer. It’s T-Spruce Jaela 47718 VG-87. As Rauen explained in The Bullvine’s profile of the operation: “Out of her, already more than 50 sons, grandsons, and great-grandsons have left for AI, so she will truly have a lot of influence.” That’s not a genomic prediction—that’s multi-generational transmitting consistency you can actually verify.
Their legendary Miss OCD Robust Delicious proves the point even more dramatically. Named Holstein International Cow of the Year in 2018, this bovine matriarch still contributes valuable embryos to their program today. Her genetic fingerprint is evident across their top GTPI sires. Rauen notes that Delicious combines high genetic merit with strong mammary traits and efficiency, which is why her influence shows up in so many of GenoSource’s highest-ranking bulls. In an industry where youth often reigns supreme, Delicious demonstrates that longevity and productivity can validate genomic promise—but only if you’re tracking results long enough to see it.
GenoSource’s approach to show cattle reinforces this philosophy. Their three-time World Dairy Expo champion Ladyrose Caught Your Eye-ET isn’t just a show animal—sixteen of her daughters score VG-87 or higher and are productive members of working herds, according to The Bullvine’s coverage. That’s the kind of validation genomics alone can’t provide.
The operation tests a large number of bull candidates annually, placing around 200 in AI programs with companies such as Select Sires, Semex, ABS, and others. But what separates GenoSource from operations that simply chase genomic numbers is their insistence on tracking cow families across generations—verifying whether genomic promise translates into barn performance.
The Data-Driven Approach at Scale
At McCarty Family Farms—2025 World Dairy Expo Dairy Producers of the Year, operating the largest herd of registered Holsteins in the United States across Kansas, Nebraska, and Ohio—the approach scales differently, but the principle holds.
“Unlike managing by feel, we allow the data to drive many of our decisions,” Ken McCarty has explained. But critically, that data isn’t just genomic predictions—it’s actual performance systematically tracked across their operation.
When the McCartys first implemented comprehensive genomic testing, they discovered something sobering: roughly a quarter of recorded parentage in their herd was incorrect. As Ken reflected in interviews, how can you drive appropriate genetic progress or make the breeding decisions that will propel your business forward with that kind of foundational error? Today, after overhauling data capture and mating systems, their monthly compliance reports for mating recommendations consistently reach the mid-to-high 90% range.
McCarty’s standardization approach offers a template for commercial operations. Each farm operates the same synchronization protocols, treatment protocols, breeding strategies, and vaccination strategies. This consistency across their multi-site operation creates the statistical power to identify which sire families actually deliver—and which disappoint.
Since the early 2010s, they’ve increased both milk yield and overall output per cow substantially as the operation expanded, reflecting the combined impact of genetics, nutrition, and management changes. Their focus on genetic enhancement of milk protein content, which is notably harder to improve via diet than butterfat, serves both customer demand and sustainability goals.
Ken acknowledges they haven’t abandoned traditional cow sense—they’ve augmented it with technology and analytics. Being able to sharpen the focus on traits where the herd may be deficient has been transformational, he notes. Their newest facility in Rexford, Kansas, completed in 2023, reflects this commitment to both scale and precision management.
The Common Thread
What GenoSource and McCarty share with smaller elite breeders isn’t rejection of genomics—both operations embrace genomic testing extensively. What they share is a conviction that validation matters.
GenoSource tracks cow families across generations. Jaela’s 50+ descendants to AI, Delicious still producing and contributing embryos, Captain’s daughters showing up in global herds while his grandsons continue the legacy. McCarty standardizes protocols specifically to enable performance comparison—consistent data entry, identical definitions across locations, real-time feedback on what’s actually working. Both prioritize multi-generational transmitting consistency over single-point genomic tests.
Rauen captures the philosophy when discussing their flagship bull GenoSource Captain: “Captain’s consistency across generations is unprecedented. His daughters dominate global herds while his grandsons, like Garza, continue the legacy.” Consistency—that’s what genomic predictions alone can’t guarantee.
The practical application for commercial producers is clear: when evaluating bulls, verify how the cow family has performed across multiple generations and multiple environments. Check if daughters from that line actually delivered on the genomic promise in similar operations to yours. Elite operations at every scale don’t trust catalog numbers alone.
Proof of Concept From Small Herds
While operations like GenoSource and McCarty demonstrate these principles at commercial scale, it’s worth noting what smaller operations have accomplished. Recent Bullvine profiles have highlighted Canadian herds such as Walnutlawn, Lovholm, and Bosdale, which have bred World Dairy Expo champions and amassed impressive numbers of Excellent-classified cows relative to their herd sizes.
“Cow families are probably number one,” says Michael Lovich of Lovholm Holsteins. “If I don’t like the cow family the bull comes from, we won’t use him. When I see bulls that are out of three unscored dams, I don’t care what the numbers are.”
Their cows average considerably longer productive lives than the industry norm. When you can keep cows productive that much longer than average, your entire economic model shifts.
The common thread across all these operations—whether 72 cows or approaching 20,000—is disciplined focus on cow families and consistent transmission, not just chasing the latest bull rankings.
Practical Strategies for Commercial Operations
Given these market realities, what can commercial producers actually do? You can’t completely insulate yourself from system-wide dynamics—but you can meaningfully reduce your exposure.

| Strategy | Bulls Used | Avg. Genetic Merit | Risk if 2 Bulls Disappoint | Annual Cost/Cow | Verdict |
| Concentrated “Elite” | 4-6 bulls | Top rankings (+NM$) | $20,000-$40,000 lossacross 3-4 years(40-50% of breedings affected) | $0 genetic trade-off+ high disappointment risk | High risk |
| Diversified Insurance | 10-15 bulls | 85th-95th percentile(20-30 NM$ lower) | $4,000-$8,000 lossacross 3-4 years(15-20% of breedings affected) | $8-15/cow(~50 lbs milk/lactation)genetic trade-off | Insurance wins |
| Proven Bull Hedge | 10-15 bulls(30% proven) | Similar to diversified+ reliability premium | $2,000-$5,000 lossacross 3-4 years(proven bulls anchor herd) | $12-20/cow(proven semen premium+ moderate genetic lag) | Best risk-adjusted |
Diversify more than conventional wisdom suggests. If you’re currently using 4-6 bulls, consider spreading across 10-15. The genetic merit trade-off is real—you might average 20-30 NM$ lower across breedings compared to concentrating in your top picks. On a 500-cow herd, that’s foregone genetic potential.
But here’s the math that matters: if two of your concentrated bulls disappoint significantly—which happens more often than catalog marketing suggests—you’ve absorbed that loss across a large portion of your herd. When you spread breedings across more sires, individual disappointments hurt less. The insurance usually wins.
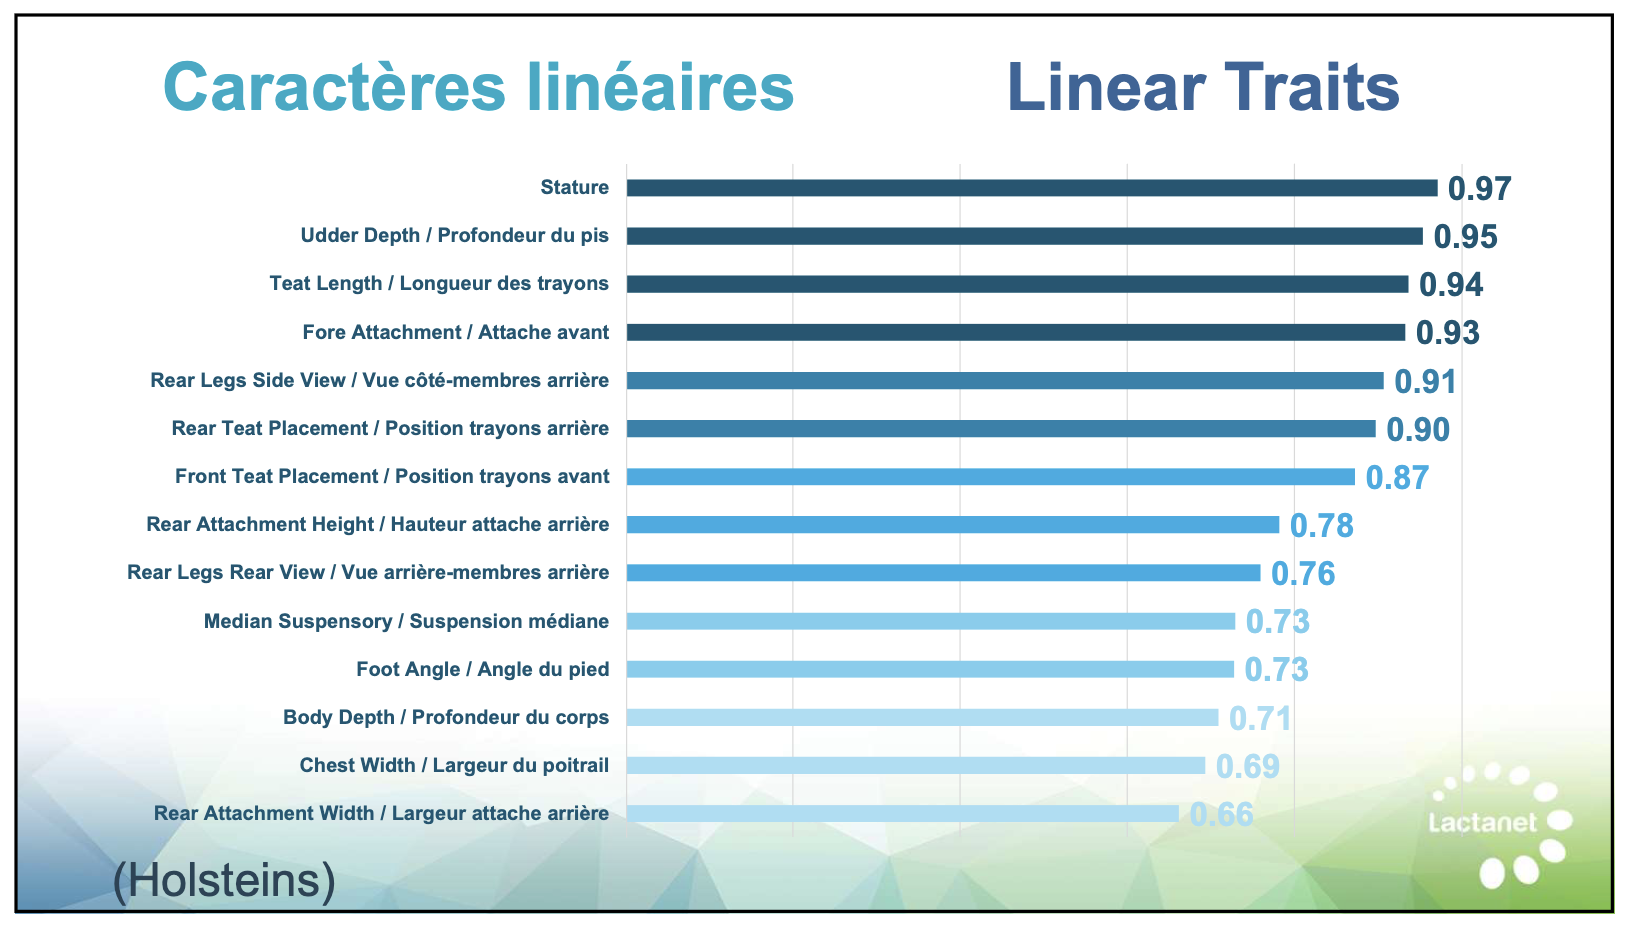
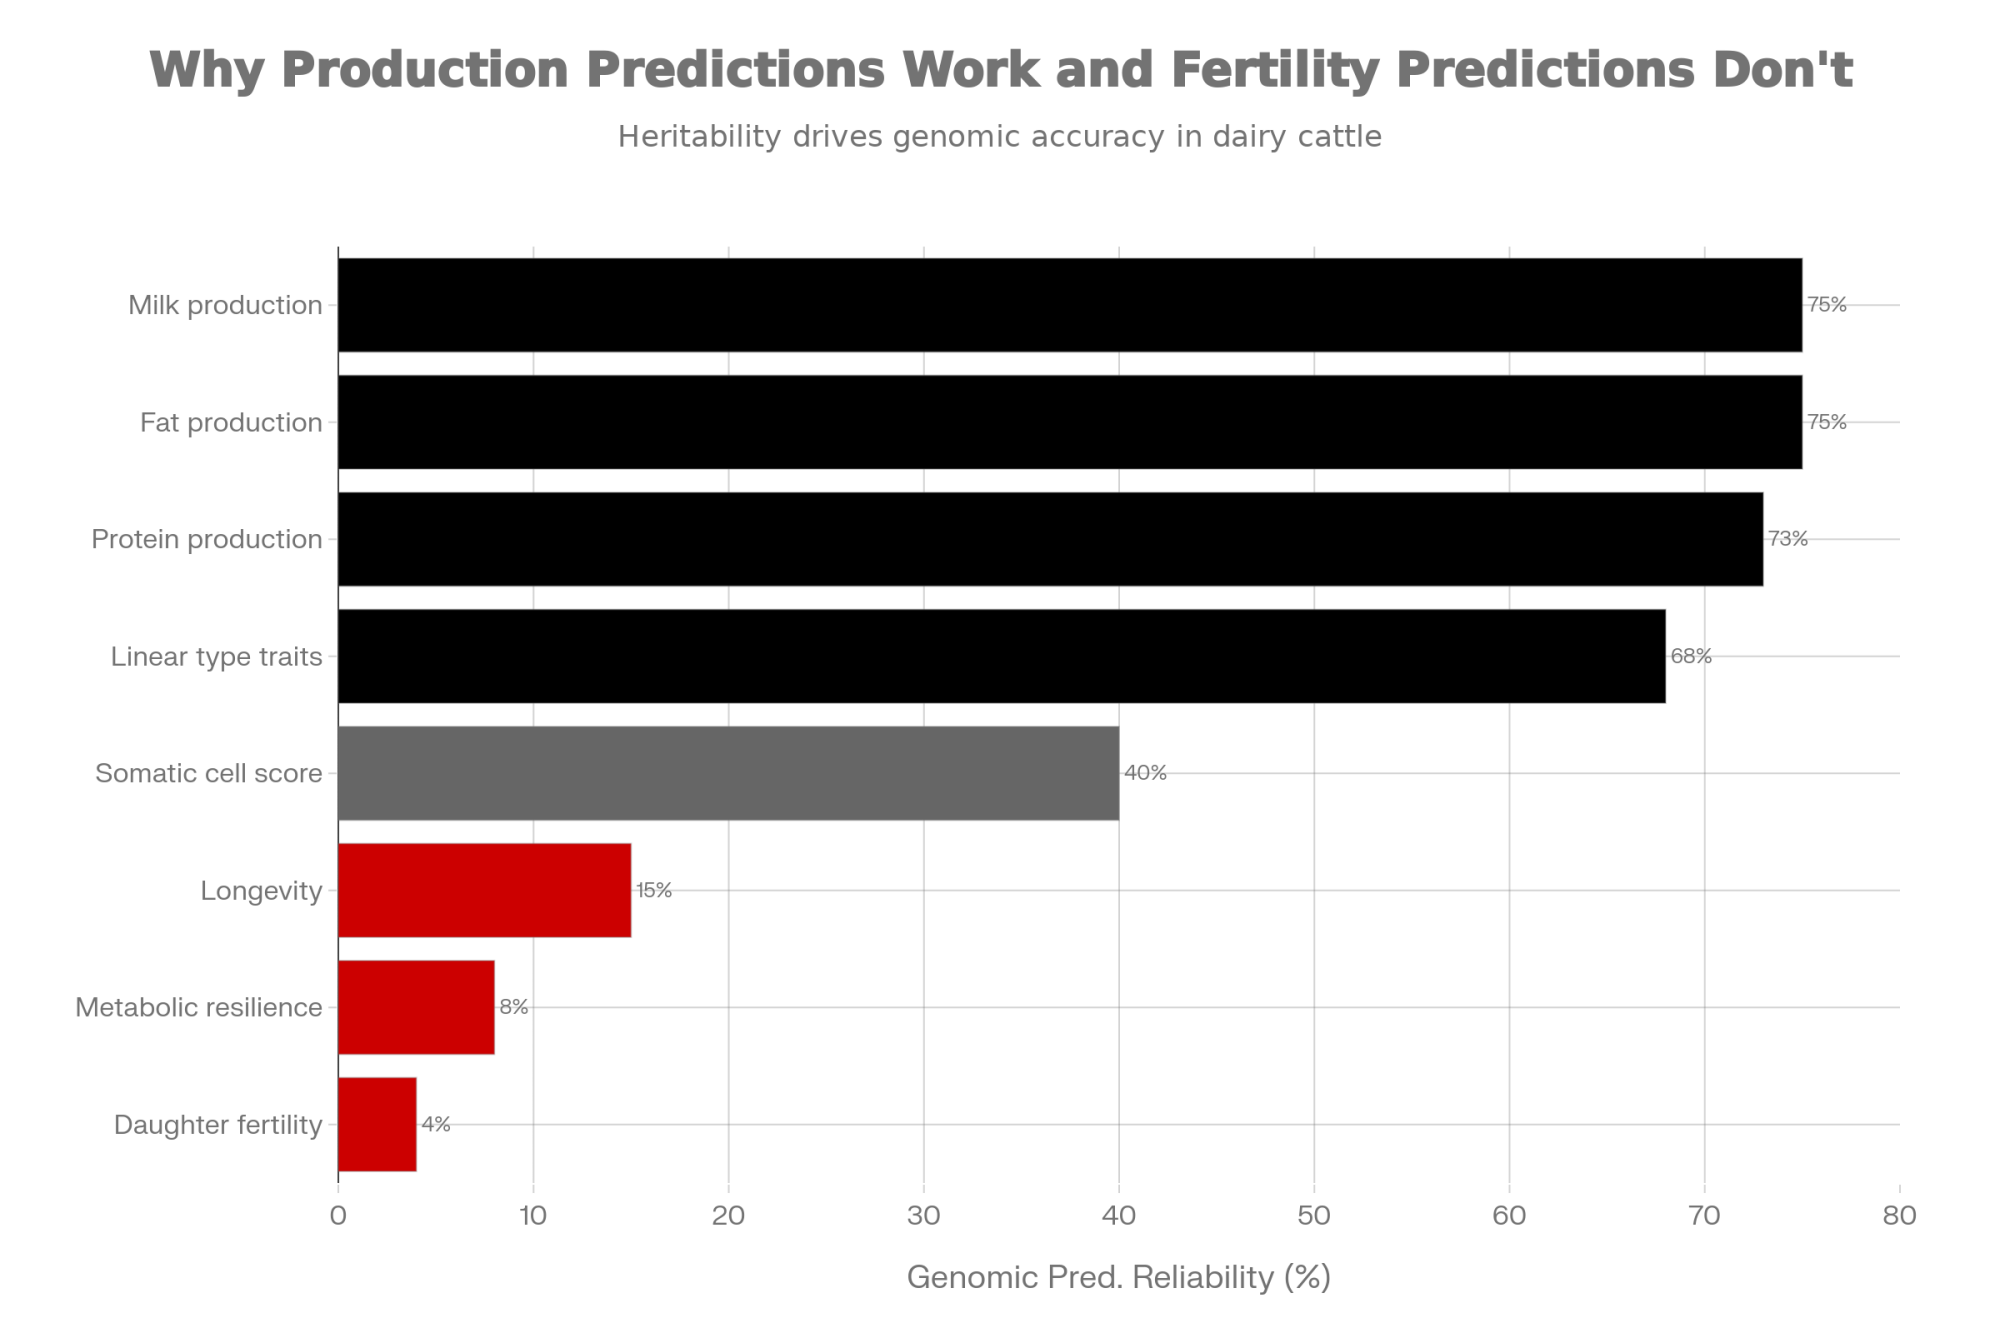
Recognize which predictions deserve more confidence. Production traits (milk, fat, protein) and linear type traits have relatively strong genomic prediction accuracy—reliability often above 70%—because they’re highly heritable and measured on enormous reference populations.
| Trait Category | Reliability(%) | Confidence Level |
|---|---|---|
| Milk production | 75% | High – Trust prediction |
| Fat production | 75% | High – Trust prediction |
| Protein production | 73% | High – Trust prediction |
| Linear type traits | 68% | High – Trust prediction |
| Somatic cell score | 40% | Medium – Moderate confidence |
| Longevity | 15% | Low – Skepticism warranted |
| Metabolic resilience | 8% | Low – Skepticism warranted |
| Daughter fertility (DPR) | 4% | Very Low – Near guesswork |
Daughter fertility (heritability around 4%), metabolic resilience, and longevity have substantially lower prediction accuracy. When choosing between bulls with similar production indexes, consider breaking the tie based on proven functional traits from older bulls in the pedigree.
Develop your own red flag checklist:
- SCS above +2.8 (potential mastitis pressure—could cost $100-200/cow annually based on university extension estimates)
- Stature above +2.0 (mobility and facility-fit considerations)
- DPR below -1.5 (reproduction concerns worth investigating)
- Extreme production combined with a negative udder composite (potential antagonism)
- Heavy concentration of single bloodlines in recent generations (inbreeding risk)
Consider the 85th-95th percentile rather than chasing top rankings. Bulls in the 85th-95th percentile typically deliver strong genetic gain without the extreme trait combinations that sometimes accompany absolute top rankings. You might sacrifice 50-100 pounds of milk per lactation—call it $8-15 per cow annually at current component prices—but potentially avoid antagonisms that accompany extreme selection.
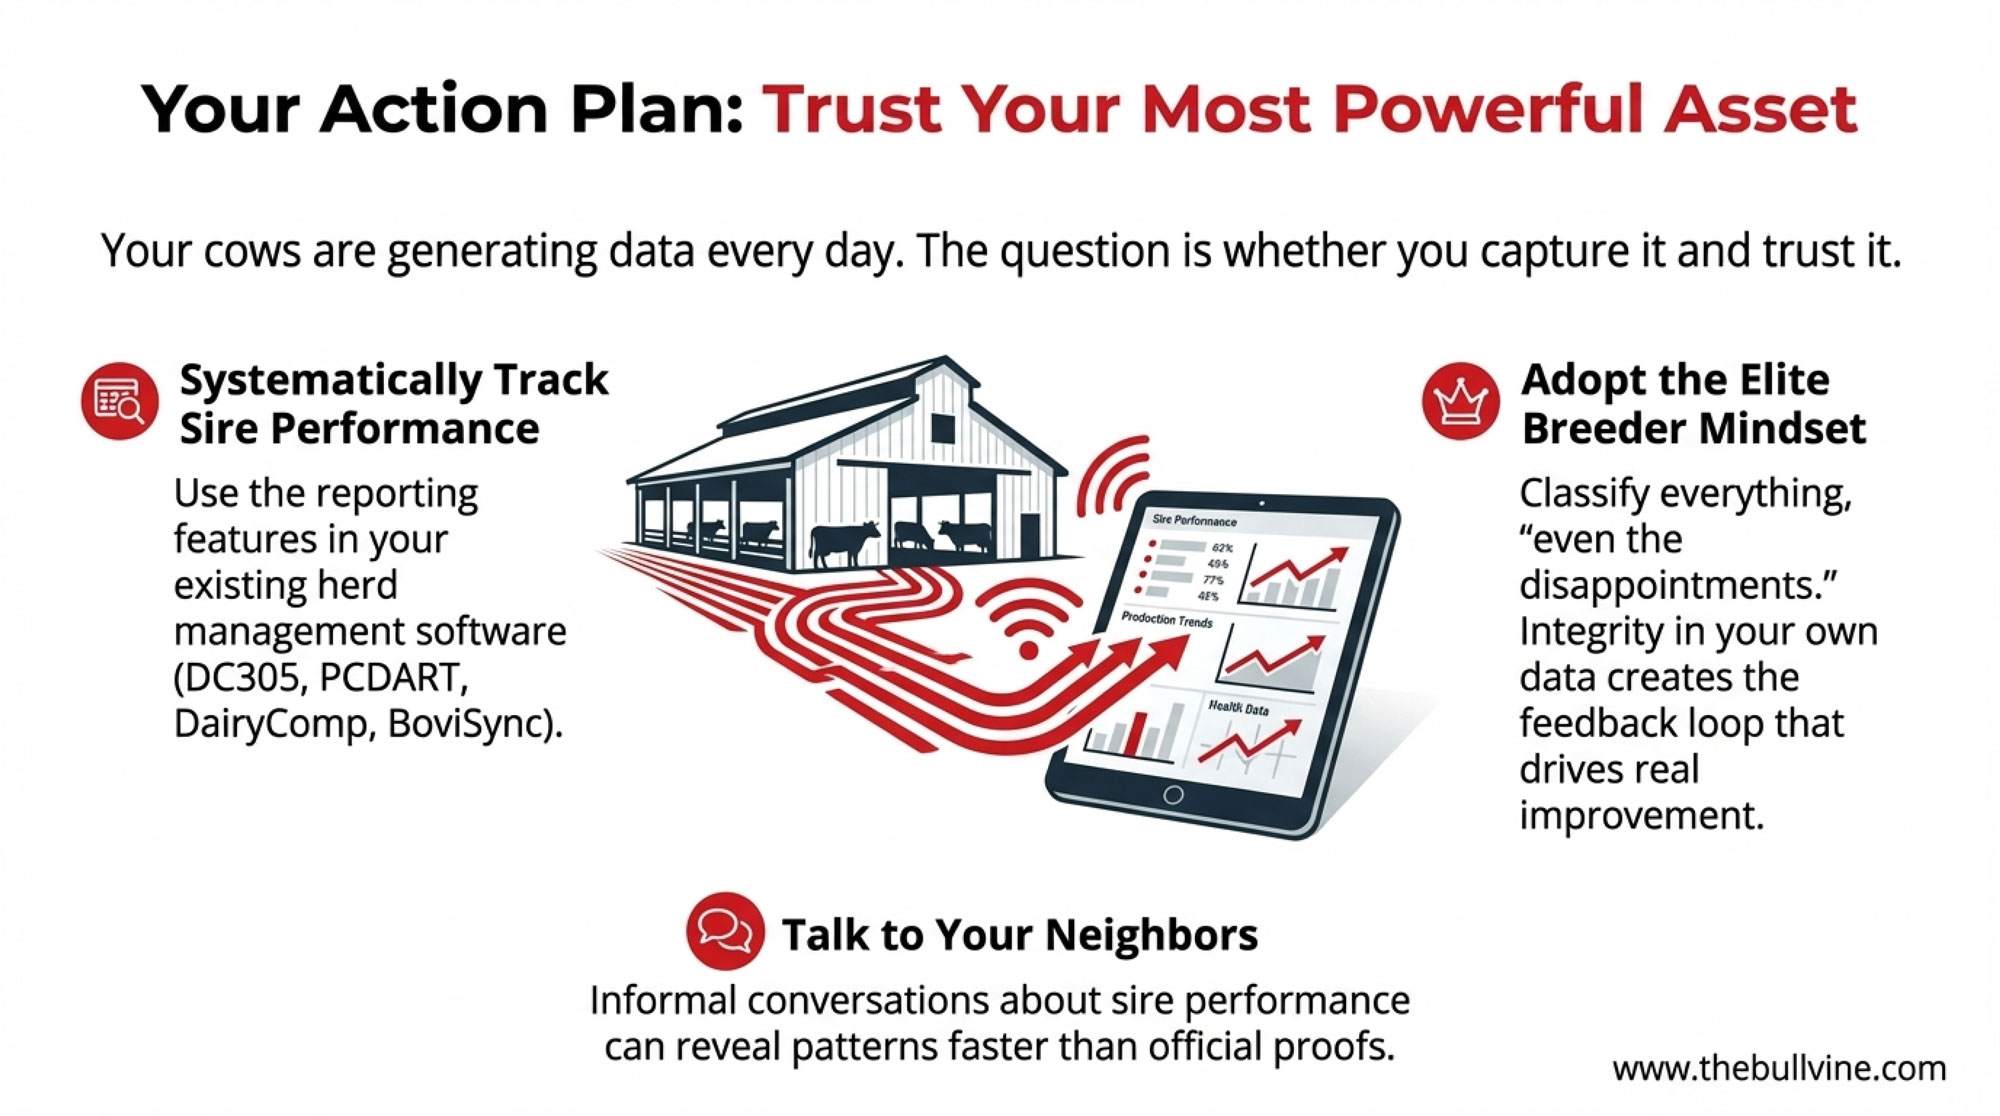
Track performance systematically in your own herd. Most modern DHI programs and herd management software—DC305, PCDART, DairyComp, BoviSync—can generate sire-based performance reports when appropriately configured. After 3-4 years, you’ll start seeing patterns emerge. When three consecutive bulls from the same bloodline show similar problems in your operation, that’s a signal worth acting on.
Learn from operations that actually track results. McCarty’s discovery that roughly a quarter of their parentage records were incorrect before implementing systematic tracking should concern every producer who hasn’t verified their own data quality. Their subsequent improvement to compliance in the mid-to-high 90s shows what’s possible when you take data integrity seriously.
Use proven bulls strategically. You can’t use daughter-proven bulls exclusively without falling behind on genetic progress. But for your best cow families, your older cows that have already proven their value, and animals with reproductive challenges? The predictability of proven genetics has genuine worth.
What This Means for Your 2026 Breeding Decisions
With the spring breeding season approaching and proof updates coming in April and August, here’s how to put this analysis to work.
- Before your next semen order: Pull your current bull lineup and honestly assess concentration. How many distinct sire lines are you actually using? If fewer than 8-10, you’re probably overconcentrated.
- Apply realistic expectations. When evaluating young genomic bulls, remember that daughter proofs often come in below initial predictions. If a bull is still attractive, assuming some regression from his current numbers, proceed. If your enthusiasm depends entirely on that top-end number being accurate, that’s a warning sign.
- Ask better questions of your AI rep. Instead of “who’s your hottest young bull,” try: “Which bulls have you seen daughters from, and how are they holding up?” Good reps appreciate being treated as consultants rather than order-takers.
- For Southeast and Southwest operations: Heat tolerance should already be a significant factor in your bull selection. Don’t wait for more data—the direction is clear.
- For Upper Midwest and Northeast operations: You have more runway on heat tolerance, but start tracking summer performance by sire now. The data you collect this year will inform decisions in 2027-2028.
- For Canadian producers: The same principles apply to LPI—the prediction mechanics and preselection dynamics work the same way, even if the index construction differs.
Looking Ahead
Heat tolerance is transitioning from academic interest to practical necessity. Lactanet and other organizations are beginning to publish heat tolerance metrics worth monitoring.
Feed efficiency selection is entering mainstream genetic programs, which introduces complexity. French national research has highlighted the importance of preserving robustness and reproductive performance while pursuing efficiency gains—flagging concerns about excessive body condition loss during the transition period when cows are genetically selected for extreme efficiency.
Early data on residual feed intake shows it’s heritable (estimates generally range from 0.12 to 0.38), which means we can select for it. Whether aggressive selection before we fully understand the reproductive and health implications makes sense is worth careful consideration.
Regional data-sharing cooperatives represent one mechanism that could strengthen market feedback. If 10-15 commercial dairies in your area agreed to pool anonymized daughter performance data by sire, you’d collectively have enough statistical power to identify performance patterns years before official evaluations reflect them. Your local DHI cooperative or breed association can tell you what’s available in your region.
Six Things to Do This Breeding Season
The system won’t protect you from genetic disappointment. AI companies are doing their job: selling semen. Your job is the hard part—living with the results. A 72-cow tie-stall operation has bred World Dairy Expo champions by trusting cow families. A 20,000-cow operation discovered that a quarter of its parentage records were incorrect before fixing them. Your job is to find your own version of that balance: diversify against the bulls that won’t deliver, be realistic about predictions that may be optimistic, and track what actually works in your barn. That’s not cynicism. That’s what people who breed elite cattle have been doing all along.
- This week: Pull your current bull lineup. Count distinct sire lines—if you’re under 8-10, start planning to diversify.
- Before your next order: Be realistic about young bull predictions. If he’s still your pick, assuming some regression from catalog numbers, proceed with confidence.
- This breeding season: Reserve your proven bulls for your top 20% cow families and any animals with reproduction challenges.
- Within 90 days: Set up sire-based reporting in your herd management software. The capability is probably there—you just haven’t configured it yet.
- This season: Verify your parentage data before trusting it for your genetic decisions. What McCarty found wasn’t unique; it’s what they found when they actually looked.
- This year: Start a conversation with 3-4 neighboring operations about comparing sire performance informally. Shared observations over coffee can reveal patterns that help everyone.
Your cows are generating information about which genetics actually work in your operation. The question is whether you’re capturing that information systematically—and whether you trust it as much as you trust the marketing materials.
Key Takeaways
- True knockouts have shrunk to physical impossibilities and verified genetic defects. Lactanet data shows haplotype carriers HH1-HH4 are now below 2% in recent Holstein births. Meanwhile, traits like elevated SCS and marginal udders get marketed with “best suited for excellent management” caveats—translation: his daughters will need it.
- Be realistic about young bull predictions. Canadian and US evaluation centers have documented that genomic proofs for heavily preselected sires often decline when daughters are added. That gap between expectation and reality can cost you meaningful genetic progress over time.
- Validation beats prediction at every scale. GenoSource tracks cow families across generations—Delicious is still contributing embryos after being named the 2018 Cow of the Year. McCarty discovered roughly a quarter of their parentage records were wrong before implementing mid-to-high 90s mating compliance. Canadian operations have bred WDE champions by focusing on cow families rather than catalog rankings. The common thread: multi-generational transmitting consistency.
- Diversify harder than you think you should. Use 10-15 bulls, not 4-6. When concentrated bulls disappoint, you’ve absorbed that loss across a large portion of your herd. Spreading breedings means individual disappointments hurt less. The insurance math usually wins.
- Your cows are generating data—use it. Elite operations from small tie-stalls to multi-state enterprises track sire performance systematically. The question isn’t whether that information exists; it’s whether you trust your barn data as much as the marketing materials.
Complete references and supporting documentation are available upon request by contacting the editorial team at editor@thebullvine.com.
Learn More
- The $315-Per-Cow Genetic Breakthrough That’s Rewriting Everything We Know About Milk and Fertility – A $315-per-cow dividend is the target of this 18-month roadmap that converts genomic data into repeatable fertility gains. It delivers specific monthly milestones to ensure your high-index investment actually pays off on your bottom line.
- The Butterfat Reckoning: $337 Million Lost in 90 Days – And Your Herd’s Best Trait May Be Next – Secure a 5-year advantage by anticipating the shift where over-selected butterfat becomes a liability. This analysis exposes the “component reckoning” and delivers the strategy you need to align breeding decisions with future processor demand.
- The Year Dairy Lost $6.7 Billion: The Bullvine’s Top 15+ Articles of 2025 – Arms you with the “survival architecture” industry disruptors use to defy consolidation. This analysis exposes the GenoSource and McCarty playbook for collective investment and vertical integration, providing the blueprint for building a resilient, multi-generational business moat.
 Join the Revolution!
 Join the Revolution!
Join over 30,000 successful dairy professionals who rely on Bullvine Weekly for their competitive edge. Delivered directly to your inbox each week, our exclusive industry insights help you make smarter decisions while saving precious hours every week. Never miss critical updates on milk production trends, breakthrough technologies, and profit-boosting strategies that top producers are already implementing. Subscribe now to transform your dairy operation’s efficiency and profitability—your future success is just one click away.