Archive – Page 5

Why you should get rid of the bottom 10%

Before there was Donald Trump, there was Jack Welch, one of America’s greatest business leaders in history. During Jack Welch’s 20-year career as chairman and CEO of General Electric, GE’s company value rose 4000%.  That is a 200% per year growth rate.  More than 50 times that of the average company.  How did Jack do it?  He got rid of the bottom 10% of GE’s employees every year.

Such bold and committed action could also apply in dairy farming. Although most of us are so entrenched in our own operations that we cannot always be objective. But we should be objective. Managers must make the tough decisions. Are you ready to Fire the Bottom 10%?  Management choices or decisions could very well be significantly dragging down your profits.

Random Poll

So The Bullvine polled dairy producers asking them:

“In managing your dairy enterprise, if someone said to you fire the Bottom 10% in order to increase your profits what would you do?”

The following four management areas were the ones the producers identified as their top “fire the bottom” moves.

Heifer Rearing

Producers tell us that the easiest and quickest change they can make is to stop raising all their heifer calves. In the past selling springing bred heifers or recently calved in first calvers was a revenue source. Some long for those days to return. The reality is that those days in North America are not about to reoccur with increased use of sexed semen and producers finding ways to retain still profitable older cows.

One producer in expansion mode dropped his heifer numbers back and used the barn space and feed to milk more cows. He did it using the heifer sized free stalls for a group of 22-26 month old milkers. Another producer changed his program to lower feed costs using a very high forage diet for all milking females thereby needing more cows to fill his daily milk shipments. His plan is that by dropping from 75 to 65 pounds of milk per cow per day he will have less cow turnover, a shorter calving interval and more profit per cow per day of productive life. Profit per cow per day (sometimes referred to as daily return over feed costs) is a term all producers are now using extensively.

Some producers report selling all heifer calves to a heifer raiser with the option of buying back needed replacements at $200 over going market price for any of his own heifers. He is very satisfied with them and he knows their ancestry. The only limiting factor being he must take care not to cause his farm any biosecurity problems with the reintroductions. He is considering testing his reintroduction for common diseases. But still sees that new cost much outweighing the cost for feed, labour or capital costs associated with raising his own replacements.

Reproductive Performance

Producers tell us that reproduction is their biggest thief of profits. Changing reproductive performance is not easy to put in place. Steps being taken include: not breeding back cows or heifers that have a history of poor reproductive performance; milkers requiring a fourth breeding are not rebred;  purchasing heat monitoring systems; creating a group of cows 60 days in milk until confirmed pregnant or a decision is made not to rebreed and using high genomic bulls instead of AI.

Other producers have worked with specialists and redesigned their transition cow program. Many report excellent results relative to calving, no retained placentas or metritis, quick entry into the milking string and high percent of first heats post calving by 50 days in milk. They have found a savings in staff time handling problems and maintaining detailed records.

Still other producers have handed off heat checking to their AI technician with very good results. It is one less job for the milkers and animal feeders to do.

Animal Health

Producers share about the frustration with the excessive time required by a sick cow, or a lame cow or a sick calf. ‘If only we did not have to be taking an extra twenty minutes per day to deal with each animal with a health problem, besides the drugs cost  and lost milk’.

One producer shared how he has built an expensive barn and manure handling system only to find that the number of cows with feet problems has exploded. His thinking is that producers are too willing to accept lameness, feet problems, foot trimming, footbaths, loss of milk, treatment costs and other detrimental issues as a cost of doing business. To that he added that in the end he had to spend even more money to re-design his housing system and now he has sand wearing out his equipment.  He actually longed for the good old days when cows could walk on dry natural surfaces.

Few of the producers see a way clear of health problems. This suggests that, as an industry, we need to think – if what we are doing isn’t working for us we definitely need to step back from the problem and find effective approaches to handling animal health.

Technology

Producers have given this topic much consideration and many have implemented changes. The list was quite long but it often does not hurt to repeat what producers are doing. The list includes: install robotics; milking the cows less than 120 days fresh 3x; hiring out the field work to a custom operator thereby eliminating labour and capital cost; capturing more cow information at every milking in both parlour and tie stall barns, (as mentioned above) heat detection systems; training and assigning specialty jobs to staff; purchasing software programs that capture and analyze data so manager can make quick accurate decisions and the list went on. In all cases it appears that dollar cost-benefit criteria were used to base decisions on. Definitely this is an area that producers feel more comfortable with. Which is reassuring given that the average herd size is growing and wage rates are increasing.

The Bullvine Bottom Line

Jack Welch earned a reputation for brutal candor in his meetings with executives. He rewarded those in the top 20% with bonuses and stock options. Sometimes as dairy breeders we are guilty of looking at our operations as a way of life and not as a business.   The hard truth is the dairy business decisions need to be based on dollars. Firing poor performers is not just good for your dairy business, it’s necessary. Where do you draw the firing line?


Not sure how much to spend on that great 2 year old or heifer?
Want to make sure you are investing your money wisely?
Download our Dairy Cow Investment Calculator.



Top Sires North American Breeders Are Using

top13of2013Three times a year every breeder and dairy cattle enthusiast pours over the newly released bull proofs or genomic indexes. We review the rankings to see if the bulls we are using or are planning to buy are near the top of the lists.  It seems every year we hear about another bull that has had a million doses of semen sold in his lifetime. All that is exciting information however it does not necessarily translate into the improvement that needs to occur in a population of dairy cattle. So what does tell the story of sires contributing to advancement?

Milking Daughters

In fact, in addition to the sons a bull has enter AI, it is the number of milking daughters of a bull that determines the contribution he will have on the breed. The Bullvine decided to investigate the female registrations by sire to determine which bulls breeders are actually using.

Population geneticists tell us that about 25% of the improvement in a population comes from the sires that produce the milking daughters. By comparison the contribution from the sires of AI young sires is 43%, the contribution from the dams of AI young sires is 25% and the contribution from the dams of the milking females is 7%. Even though the sires of milking daughters contribution is not the most important factor in an Al breeding population, it is the most important factor that breeders have control of in their herd.

Canada – 2012

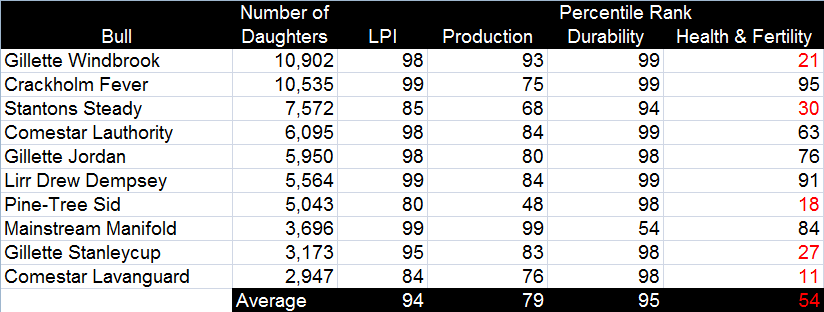
The ten sires with the most registered daughters in 2012 in the Canadian Holstein Herdbook accounted for 23% of all female registrations. All ten sires were daughter proven and all listed in Table 1.

Table 1     Sires with the Most Registered Canadian Daughters (2012)

mshtable1

Click on image for enlargement

Every sire has his own merits and limitations. In our analysis the Bullvine decided to consider the Percentile Rank (%RK) each sire has for each of LPI and its three major components – Production, Durability and Health & Fertility. The ranges in and overall averages for %RK for these ten sires are very revealing. Even though these sires are 94%RK for LPI it can be seen that Canadian breeders put more emphasis on Durability (think Conformation) at 95%RK, moderate emphasis on Production at 79%RK and little emphasis on Health & Fertility at 54%RK.

Only one sire is below 94%RK for Durability and only two sires are below 75%RK for Production. However a very limiting factor to genetically advancing Canadian Holsteins is the fact that only four sires, Fever, Dempsey, Manifold and Jordan, are over 75%RK for Health and Fertility.  The fact is that little attention is being paid to Daughter Fertility when breeders use sires. That should concern us all.

What’s Happening in 2013

Holstein USA provides on its website a report called “High Registry Activity by Bull”. The report is updated daily and is for the most recent two week time period. The following is the report for April 22, 2013 (registrations April 08 to April 19).

Table 2             Sires with the Most USA Daughters (April 2013)

mshtable2

Click on image for enlargement


It is worthy of note that Mogul, McCutchen, Gold Chip and Supersire are all genomically evaluated bulls without any daughters included in their indexes. The other six sires are all daughter proven.

The Bullvine does not have the Percentile Rank tables for the USA bulls so the numbers in Table 2 are their actual index numbers. However the results are very similar to the top ten Canadian sires in 2012. TPI, PTAT, UDC and FLC are all relatively high index numbers on average. And the indexes for Net Merit, SCS and Milk are moderate to high. However standing out as being below average is Daughter Pregnancy Rate (DPR). So USA breeders, like their Canadian counterparts, are also not placing emphasis on a breed problem – fertility.

The Numbers Tell the Story

One question we had was “How much are genomic sires being used?”. Table 2 shows four genomic sires in the top ten in the USA. In fact in the top thirty most used American sires in 2013 there are eleven genomic sires. That compares to three in the top thirty in Canada in 2013. Breeders in the USA are making much more use of sires with genomic evaluations than Canadian breeders are.

The proof of the pudding is in the eating. The sires that advance a population are the ones that breeders use not the ones that top the ranking lists.

The Bullvine’s assessment on the sires breeders are currently using is:

  • Production – Maintain the current amount of emphasis
  • Type / Durability – the emphasis can be diminished
  • Health & Fertility – the emphasis needs to be increased

The Bullvine Bottom Line

Given that many breeders tell The Bullvine that they wish to genetically improve health and fertility in their herds, it is time for breeders and AI organizations to become much more discriminating in these areas. Young sires entering AI will need to genomically rank in the top 25% of the population for DPR or DF. Many sires currently getting use in North America do not measure up for health and fertility. The genetic merit of sires selected and used in the coming years needs careful re-consideration.

Indexes are like having a compass. First you have to know where you want to go. Then you have to USE the information or you could still wind up lost.


Get original “Bullvine” content sent straight to your email inbox for free.


Where is the Balance in Balanced Breeding?

Over the past couple of weeks I have heard numerous references to the word ‘balance’ when referring to the dairy cattle breeding industry. Do we over use the term? Or worse still do we use it incorrectly? At this moment I am thinking ‘yes I don’t think we do justice to the word when it comes to genetically advancing our dairy cattle’. But let’s take a look at how we do use the term.

Numerous Interpretations

Two weeks ago at the Quebec Holstein Spring Show (Read more: Do We Speak the Same Language? and Quebec Spring Show Results) I had the opportunity to converse with a veteran dairy farm manager from Europe who spoke to me about balancing his time between breeding better cattle and the economics of running a successful dairy farm.

A week ago today a breeder, who was about to receive his Canadian Master Breeder Shield, defined for me balanced breeding as placing equal emphasis on production and type when he selects bulls and culls cows (Read more: Holstein Canada Annual Meeting 2012 – From Coveralls to Niagara Falls).

Last Thursday at the Ontario Dairy Discovery Show (Read more: Ontario Spring Discovery – Nothing Slipped Past Judge “Crack” and Ontario Spring Discovery Results) a breeder who regularly exhibits cattle at all levels described to me that balanced breeding was breeding for type and then feeding for production.

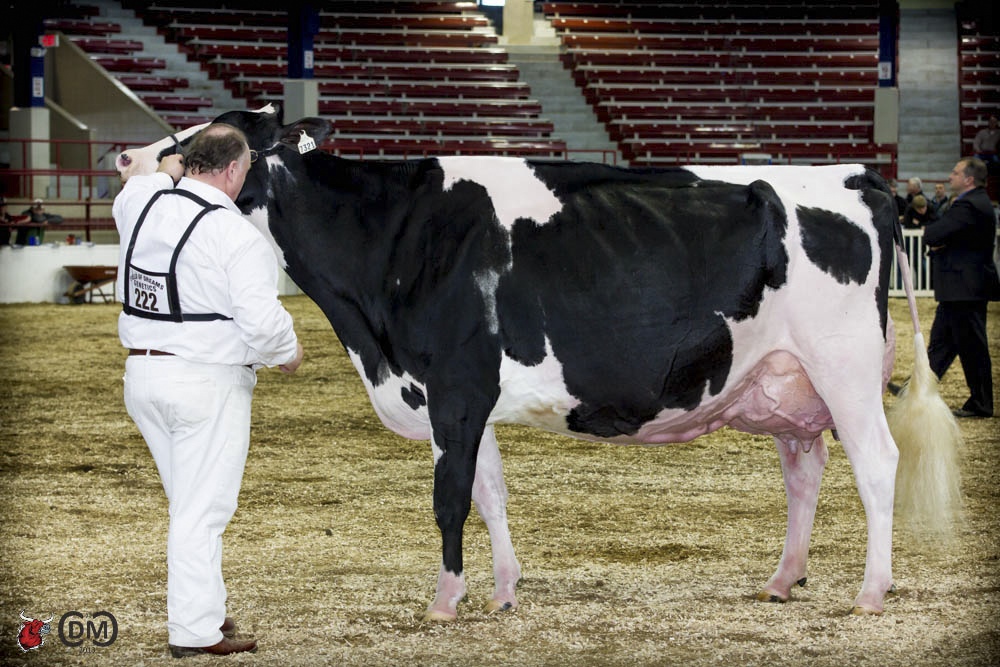
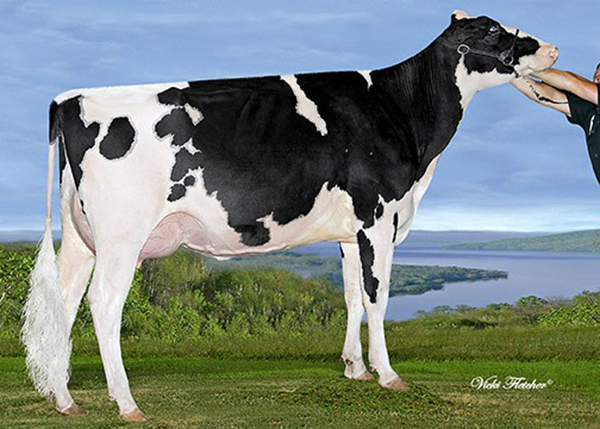
RF GOLDWYN HAILEY EX-97-CAN Considered by many to be one of the most balanced conformation cows in the history of the Holstein breed.

RF GOLDWYN HAILEY EX-97-CAN
Considered by many to be one of the most balanced conformation cows in the history of the Holstein breed.

On Friday at the Canadian Holstein Annual Meeting, an attentive audience heard Chief Classifier, Tom Byers (Read more: TOM BYERS: “THAT’S CLASSIFIED!”), describe that a cow’s parts need to be in balance. “That varies depending on whether you are looking at a just fresh 24 month old heifer or a mature cow 120 days in milk in her sixth plus lactation” said Byers.

This past Monday, as I attended the New York Spring Holstein Show (Read more: RF Goldwyn Hailey Rides to the Top Spot at NY Spring Carousel and New York Spring Holstein Show 2013 Results), I heard balance or balanced used in four other ways.  A sire analyst spoke about getting the sires of sons from a balance of daughter proven and genomic evaluated bulls. Richard Keene past Holstein USA Director and very well respected cattle judge used balance in two different ways. First he spoke about the importance of balancing the emphasis being placed on cows and bulls in genetic advancement. Secondly he spoke about balancing the needs several ways – breed improvement, lifetime milk production, profits cows return to the enterprise and serving senior versus junior members. And finally the 2013 NY Holstein Spring Show Judge Michael Heath spoke about a cow having balance between dairyness and enough capacity to consume, balance in her mammary system and balance between high at the front end and ability to walk with ease.

Are you still with me?  So many uses of the word. I am sure you may be able to add other ways that you use the word balance. So why so many ways of interpreting balance?

Digging Deeper

Like beauty, balance appears to be in the eye of the beholder or the reality of the breeder.

Gerrit Wensink, EastGen Director, who milks 400 cows using six robots he feels that the Canadian Holstein Cow has improved her conformation to the point where in sire selection his emphasis is on milk component percentages and calving ease. Whereas some breeders, who will be dispersing their herds in the next few years, want to have animals for sale that will bring the highest price. And then other breeders may want to maximize revenue per stall, profit per cow per day or daily production of fat & protein per cow. Still other breeders want to minimize costs.  Minimal labour per animal, minimal health problems, the lowest replacement cost per cow per year or put in a different way the lowest reproduction costs per cow per year.

So each of us has a different definition of what Balanced Breeding means to us.

Breed Guidance

To assist breeders, organizations have developed total merit indexes that breeders can use in selection and culling. Holstein USA ranks animals using the TPI™ index. Canadian breeders have the LPI (Read more: Everything You Need To Know About TPI and LPI and TPI™ and LPI – Marketing or Mating tools?). And USDA geneticists rank animals using the Net Merit index. In fact almost every country, region or continent has a total merit index. All these indexes have many traits included with each weighted according to economic values. Breeders are encouraged to use these indexes for both genetic and marketing purposes. Yet do they in fact maximize both breed advancement and breeder profitability?

Some History – Current Needs

At various times in their histories breeds have identified major needs and focused on those needs. Holstein have genetically address low butterfat content, deep udders and high somatic cell counts. While the other breeds have all addressed low volume of milk produced. But what are breeders’ current most major needs? Genetically for the Holstein breed they could well be rear foot conformation, fertility and perhaps even feed efficiency. Are they the same for all cow housing systems? Are they different for in tie stall barn pipeline milked, parlour milked or robotically milked cows (Read more: Robotic Milking: More than just automation it’s a new style of herd management).  And yes beyond the cow, breeders also face the challenges and opportunities associated with animal welfare and increasing the profit per cow per day of life.

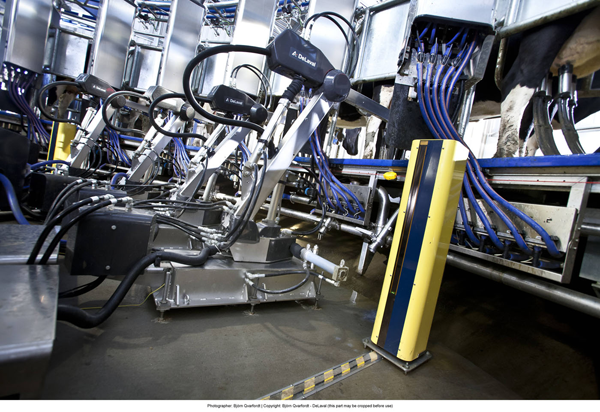
Robotic Milking

One young South American dairy couple recently told me that they see it quite differently. They want to breed for fat & protein yield plus fertility and manage for conformation and health. So they are only using the highest genomically evaluated Holsteins bulls for fat, protein and fertility that they can find anywhere in the world. Their idea is to drive up revenue per cow and keep costs under control.

Considering all factors, some of which may not have a genetic component, when breeding for improvement it gets to be a big challenge and perhaps we could even say complicated.

The Reality Is

There is no such thing as uniformity of breeder needs when it comes to Balanced Breeding. Total merit formulas are for the average but do not address the top priorities. For instance breeding for enhanced rear feet is very difficult as the trait is not uniformly measured and what genetic differences are known are lost when a Feet & Leg rating is produced for a bull. Definitely when it comes to the genetic difference between animals in genetic merit for fertility, we are just starting to scratch the surface.

For interest sake the Bullvine has produced articles that change the emphasis placed on traits (Read more: Bullvine Performance Index (BPI – Top Sires December 2012 and Top BPI Heifers from Around the World ) and we even produced a bull index for daughter feed efficiency ((Read more: 30 Sires That Will Produce Feed Efficient Cows). Some AI organizations also produce their own bull ranking indexes that place emphasis on major breed needs. However all of these total merit indexes come up with numbers that water down the greatest genetic needs. The end result is that we select for so many traits that we average everything out and make less than optimal progress for the areas of greatest need.

The reality is we will not make significant progress for the areas of greatest genetic need until breeders routinely use the bulls that rank in the top 1-5% of the breed. For traits like feet and female fertility for milking cows there are not even listing produced that give the top ranking bulls of the breed. How can breeders address their biggest needs when they do not have access to the best bulls there are genetically.

The Bullvine Bottom Line

Balance Breeding formula are for the masses but not for the breeders truly committed to improving their herds for their greatest genetic needs. Total merit indexes are a good first sort tool for getting a short list of bulls. However breeders truly interested in genetically attacking their most limiting traits, in improving their herds and in having the facts to show when marketing their genetics, it is time to rethink if the Balanced Breeding is the right approach. To move forward genetically requires that breeders select only the best and ignore the rest.


Get original “Bullvine” content sent straight to your email inbox for free.


8 Ways DNA PROFILING Your Whole Herd Will Improve Your Breeding Program

DNA profiling is a complimentary tool for the discerning breeder who is committed to genetic advancement for three reasons:

  • More accurate genetic selection
  • Increased profit
  • More effective management

Added to these three is the potential for breed advancement. Therefore, using DNA analysis is definitely a win-win-win situation.

Higher Quality Cattle – Better Genetic Selection

There are already the industry leading early adopters (5%) who quickly recognized the benefits of DNA profiling.  Since the dairy industry ranks every animal in the world (Indexes), a new tool that is able to genetically rank every animal in your herd makes sense. The Bullvine has compiled the top 5 ways that DNA analysis can fine tune your selection decisions beyond the elementary keep, cull or sell.

  1. Identify genetically superior heifers to maximize their value and use for extended reproductive work (ET)
  2. Identify heifers to cull or use as embryo recipients
  3. Identify heifers within a cow family that are more likely to be the ones to carry on the family
  4. Identify AI or natural use sires that will assist in achieving a herd’s genetic plan
  5. Identify heifers to be sold as herd replacements.  As the overall genetics of your herd improves, even lower-end cull heifers will likely make good-quality replacement heifers when sold.

Progress is all about maximizing the potential of every animal.  DNA profiling is an identification tool which not only provides the above five points – and perhaps more – but also has three other quick-to-appreciate advantages.

  1. Provides a jump on genetic information well in advance of a bull being proven
  2. Provides the best available index values for health and fertility traits
  3. At the simplest level, provides verification of parentage.

If you’re still hesitating, ask yourself how often a new practice gives you eight ways to advance?

On Farm Profit Could Win by a Hair

Everyone can appreciate the financial incentive of raising the genetic level of your herd. Beyond that there are additional financial incentives from costs saved and revenue generated. The logistics of raising dairy animals is all about efficiently using space and resources. Heifer rearing costs are generally accepted between $2.75 and $3.25 per heifer per day. With DNA analysis at $45 to $60 per animal there is immediate payback. Do the calculations for a 100 cow herd? The revenue from and growing costs saved by selling the lowest four calves will more than pay for the testing of all female calves.

On Farm Management: Better timing – Identified culling

It isn’t only proactive elite breeders who focus on performance and added value. Even those who are most skeptical about trends perk up their ears when positive examples start piling up.  Breeders with specific goals relating to high performance, long herd life, or top show type can appreciate a tool that helps accurately identify specific attributes.  Furthermore, using DNA analysis to level out the peaks and valleys in freshening rates allows breeders to keep steady numbers in the calf hutches and heifer pens. More accurately identifying your own cattle makes it that much easier to market them to the specific needs of buyers.  The genomic numbers become part of promoting animals in ads, social media and in the barn. Not only is it a genetic tool but a full-disclosure marketing tool, when the information is available to all buying and selling scenarios.

Industry Advancement: Pedigree accuracy – Breed purity

Much like requiring RFID tags for all animals, a DNA profile has the potential to add much to the breeding stock industry

–          Will assist in improving low heritability traits: health and fertility

–          Allows for a breed society to require that all males registered be DNA profiled

–          Allows for a breeding company to require that all daughters in a sire’s proof be DNA profiled and parentage verified

–          As more herds sample their females for genomics, expect the technology to become more accurate and cost-efficient

How & When – Determine Your Strategy

There is not one procedure or process that will work for all herds.  Determine the simplest, most accurate steps available to you. The suggested best practice is testing every heifer calf at one day of age or by 30 days of age.  Determine how the following choices could work for you.

–          DNA profile as close to registration as possible. The sooner the better.

–          Chose which panel.  Low density unless for bulls for AI or top heifers to be sold

–          Even if a breeder may not practice ET, the top 15% should be bred to the highest genomic sires for total index, type, production or health and fertility.

–          The middle range  should be bred using sexed semen

–          The bottom 10% could be sold as  embryo transfer recipients or bred to beef semen

Question for Breed Associations to Ponder

Is it in fact a good long term strategy to have DNA analysis remain optional or should it be mandatory some time in the future? __Optional? __Mandatory?

The Bullvine Bottom Line

DNA Profiling will allow the vast majority of breeders to sort, select and sell females according to their personal herd strategies and mate retained heifers for more rapid genetic progress.  The benefits to individual breeders and the Holstein breed as a whole will be measureable.  What are you waiting for?


The Dairy Breeders No BS Guide to Genomics


Not sure what all this hype about genomics is all about?

Want to learn what it is and what it means to your breeding program?

Download this free guide.


Canadian LPI Rescaling Explained (April 2013)

Understanding and correctly using genetic indexes is important to breeders who derive a significant portion of their profit from dairy cattle breeding decisions. Major changes in the expression of indexes do not occur frequently but when they do occur it can be a time of confusion and perhaps lack of trust. The Canadian total index, LPI, has been used for over twenty years by Canadian breeders, as well as by breeders from other countries who source genetic material from Canada. When changes occur in the LPI indexing system, as is the case just now in April 2013, it is important that the reasons for the changes and the results be understood and incorporated into breeders’ decision processes.

Why Change?

For some time now the LPI values, especially for Holsteins, have been increasing quickly for all animals but it has been most noticeable for animals that have genomic evaluations. Breeders questioned how these young animals with indexes that are about 65% reliable can be significantly superior to recently proven top end bulls and active cows with their own performance values. As most breeders refer to the absolute LPI number, significant differences between the leaders on the various listings left doubt in accuracy in breeders’ minds. For breeders who think is bottom line terms and do not follow the LPI numbers closely, comment were often heard about the fact that numbers are numbers but it is annual cow profit that pays the bills, expands the business and sends the kids to college. Point being that the LPI difference between animals over-stated the net dollar difference between animals. These questions, comments and concerns were heard loud and clear by the CDN’s Genetic Evaluation Board so it studied the matter and took action.

LPI Scaling

The extreme range (-3500 to +3500) in Canadian Holstein LPI values had many drawbacks. It assigned most older long-lived profitable cows a negative value thereby telling a story that was not true and limiting the saleability of their subsequent generation. It assigned values that indicated significant differences between animals when the actual dollar differences were not that large. And due to the scaling effect for animals at the very top of the breed it gave values far exceeding the actual differences.  This latter point was especially true for bulls and heifers with only parent averages and genomic evaluations.

While studying possible solutions, CDN noted that in other major dairy breeding countries the scale for their total merit index is much much smaller than Canada’s 7000 point range. CDN decided to adopt a publication methodology for the LPI similar to what the TPI™ has used for many years. That involves calculating a value and adding a ‘constant’ to it.

New LPIs

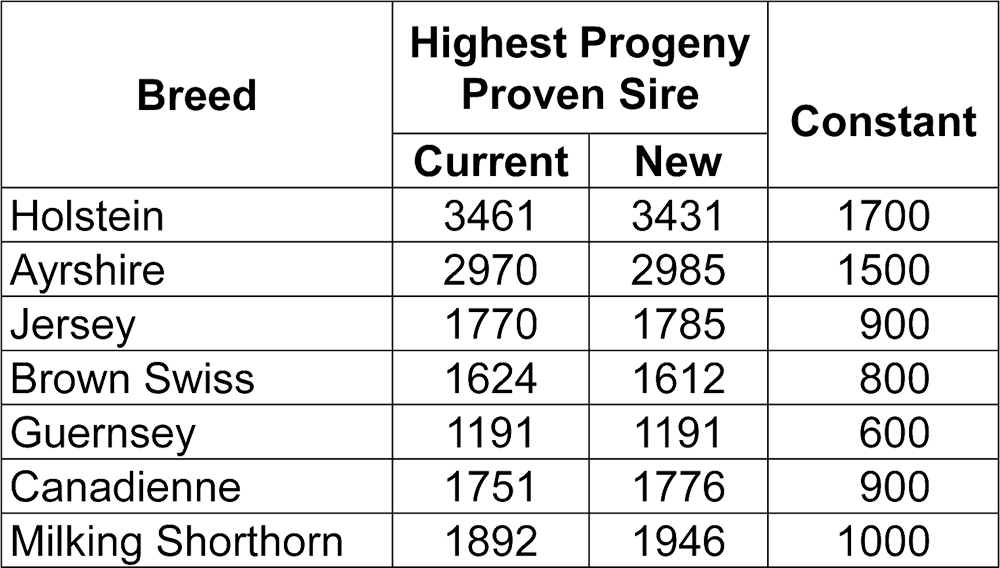
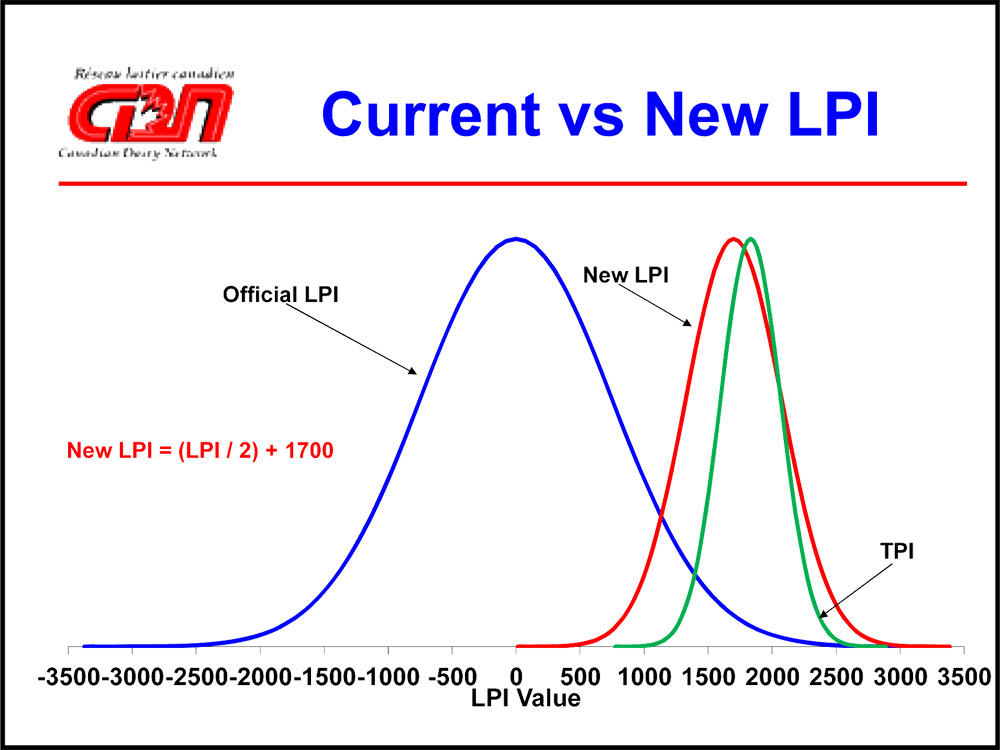
Effective April 09, 2013  the new LPI formula is ½ Previously calculated LPI  + Constant.

cdnfigure1

Note that the highest progeny proven sires do not change in value.

currentvsnewlpi

Note that the range in values of Holstein LPIs is now much more similar, although slightly more, than the range for  Holstein TPI™

Sire LPIs

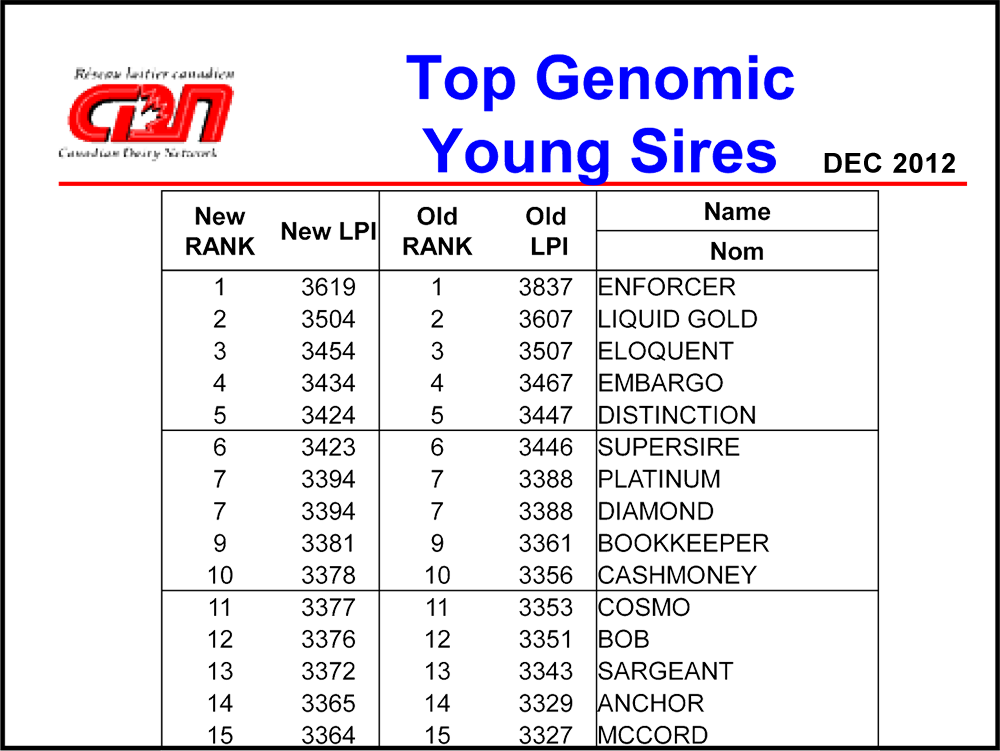
It is important to note that this re-scaling of LPI does not re-rank animals. But it does bring the progeny proven sires and genomically evaluated young bulls much closer in their values.

toplpigenomicsiresdec2012

It is important to remember that LPI is the Canadian system for ranking animals according the weights assigned to the numerous genetic indexes of important for lifetime profit. For Holsteins the weights at 51% Production, 34% Durability and 15% Health and fertility while for Jerseys those weightings are 57%, 33% and 10% respectively. Breeders wanting to place more or less emphasis on the various can calculate their own rankings using  the CDN calculator available at www.cdn.ca or going the Bulvine’s bull listings for alternative ranking systems (Read more: Bullvine Performance Index (BPI) – Top Sires December 2012).

Using Genetic Indexes

Indexes are a very constructive tool to genetically breed better animals for the future. As genetics is less than half of the reasons animal differ in profitability, much depends on breeders to not only produce the animals that will be profitable but also to feed and manage them.  Some suggested ground rules to follow when making sire or heifer selections are:

  • Use LPI, TPI™ or Net Merit are you primary list reduction tool for sires or herd replacements
  • Always check out the index values for the traits important to you (i.e. protein, fat, feet & legs, udders, SCS, fertility,..). Eliminate animals from the list that do not meet your requirements.
  • A quick way to eliminate animals is to use % RK (percentile rank).
  • Animals below 75% RK for any yield or conformation traits will likely leave progeny that reduce your profit.
  • Animals below 60% RK for health and fertility traits will not move your herd ahead for these traits of emerging importance.

The Bullvine Bottom Line

Even though the method of expressing genetic indexes may differ from trait to trait or country to country, it is always important to have a plan on what you want to improve genetically  in your herd and then to select the sires or replacement females that will produce the results. The re-scaling of the LPI values will come closer to the actual dollars amount animals return in their lifetime profit and will more accurately compare older and younger animals. By all means keep your genetics current and on target to your needs. It is best to throw out the semen from low indexing bulls. Buy high ranking genetics. It always pays big dividends.


Get original “Bullvine” content sent straight to your email inbox for free.


Data Systems in the Future – Are We Ready?

Three times in the past two weeks serious dedicated dairy cattle breeders have asked the Bullvine questions that we too have been wondering about.

QUESTION 1: Why do we accept breeders collecting DNA samples but not owner recorded milk weights?

QUESTION 2: Why can’t milk weights from robotic systems be considered for publication purposes?

QUESTION 3: Why don’t milk recording programs take all relevant details about a cow when the milk yield data is captured?

We decided to turn those queries into a think piece so that even more breeder input can be brought into the discussion.

The Reality Is

The current data included in national data bases is based on what was the norm a couple of decades back. As well it is based on the previously accepted fact that only human eyes could determine if a recording was accurate or unbiased.

Times have changed. Today robots milk cows without human oversight. Technology is coming out every year on ways to capture more details that can help in breeding, feeding and managing dairy animals.

It is true that individual owners own their animal’s data. They paid for its capture, but only through having all the data for dairy cows in one or inter-linked data systems will breeders be able to advance their animals as quickly as possible.  No one breeder is an island onto themselves so the approach must be to use and make available all the animal data.

The reality is that it is time to put energy and resources into addressing the needs and possibilities when it comes to the data captured, stored and reported.

Capturing Cow Data

In both robotic and large herds owners do not milk the cows. The computers or cow milkers have no bias towards any one cow. Also systems are being used in some tie stall barns where the RFID tag identifies the cow and the system electronically captures the yield. In these systems the data is captured for each and every milking.

QUESTION 4: Why is that data not available for others to see?

QUESTION 5: What can be more accurate than recording every milking?

Surely we are not prepared to argue that eight to ten single milking observations in a lactation by a third party person is more accurate than every milking captured by the milking system.

Canada found twenty years ago that owner recorded milk weights and collected milk samples were accurate enough for sire proving purposes. Data that is 95% accurate is much superior to no data at all.

In the foreseeable future there will be parlour systems that can instantaneously provide readings for butterfat %, protein %, SCS, milk temperature and hormone levels and we expect in time readings for fat composition, protein composition and a host of other readings. Wow won’t that be useful information to use to breed, feed and manage?

Question 6: Will this further information be moved off the farm into the national data system?

Just last week it was reported at the Progressive Dairy Operators Conference that RFID ear tags may have use for measuring temperature and ear movement to monitor heats in tie stall barns. That is interesting.

Data Starts Early

Calves are to be identified at birth with RFID tags.

Question 7: Why is it not possible to use technology that now exists to collect a piece of the ear tissue for DNA analysis?

That way every animal would have a DNA profile at birth. With the very interesting things we are learning on DNA profiles and heifer management, we have just scratched the surface of this crystal ball.

Calves are now being fed by computers from day three or four of age. There will potentially be a very useful data set there that can be of great benefit when determining genetic merit, feeding programs and management practices.

Let’s Dream the Possible Dream

But it does not end there! Many other details and data sets exist that are not part of the national data base but that can be useful for animal traceability, food safety (mastitis and other drug treatment), foot care, reproduction, production limiting diseases (i.e. Johnes), pedometers, rumen boluses (i.e. temperature),… and the list goes on.

Question 8: Are plans being made to link all dairy cattle data bases?

But Is It Official?

In the past, if a piece of information could not be authenticated then it could not be published.  In the future, every farm using genetics to advance their animals will, out of necessity, need to capture and use more data than they have ever had to in the past. Official and unofficial applied when breeders were or were not prepared to trust the method of data capture.

In today’s world there are many systems of marketing and commerce that are monitored as necessary but without a third party observing every event. Breeders are routinely putting on Facebook events about their cows, including their milk yields, an animal’s profit per day, flushing history and ability to come into heat when milking 120 pounds per day. The world of dairy cow information is changing and changing quickly.

QUESTION 9:  What does the current “official” actually mean in the bigger future scheme of things?

The Bullvine Bottom Line

THE ALMOST FINAL ANSWER: Future data standards will need to address that more information will be needed and that data must be universally available. Breeder input is needed now to guide the development of future standards for data captured, stored and reported.


Get original “Bullvine” content sent straight to your email inbox for free.


Cow Mobility: One Step Forward or Two Steps Back?

The udder may be a cow’s most prized physical asset, but her feet and legs literally provide the support for everything she does. How many situations with problem cows boil down to problems with their feet and legs?

In most herds foot care and hoof trimming are considered to be a very necessary event and, therefore, an expense that cannot be avoided. With this absolute in mind, we tend to march on breeding, feeding and managing cows without taking the time to consider ways to stop merely treating the symptoms we`re stuck with. Solving the problem before it becomes a health or management problem could completely avoid starting our animals off on the wrong foot. The Bullvine invites you to consider the genetics of feet and legs with us to stimulate a breeding solution for these issues.

The Heels of a Dilemma

In milk recorded herds, culling cows for feet and leg problems is #1 on the list of conformation culling reasons. In the past, udder breakdown was once the leader. However breeders have placed sufficient emphasis on improving udders that we are now to the stage where milk producers are saying they do not need to select bulls for udder traits except to avoid ones that are too deep.  It’s encouraging to know that with focus and time identified problems can be solved.

Although removal of horns may be the current hot button for people concerned about the welfare of animals, and therefore breeders are selecting for polled, there are numerous reports predicting that lame cows will be the next and much larger target.

Certainly, there are no dairypersons who are saying that feet and legs are good enough that genetic improvement for feet and legs is not needed.

Locomotion is Costing Us an Arm and a Leg

Reports show that for a cow with one temporary sore foot it reduces her annual profit by at least $100.  So what is the cost of a cow with foot construction that requires trimming 3-5 times per year, medication, less milk production, milk withdrawal, extended calving interval and premature culling? Feet and leg problems could be costing some herds $300 per cow per year.  On a one hundred cow herd that is $30,000 less profit. Significant by anyone’s standard.

A Vet Looks at the Genetics of Lameness

Gordon Atkins, DVM and a member of Holstein Canada’s Type Classification Advisory Committee, was a speaker at the recent annual meeting of the Wisconsin Holstein Association. He is not prepared to accept the fact that feet and leg heritabilities are as low as they currently appear to be.  Additionally, he shared some interesting facts about feet and legs:

  • Lameness is 88% a rear foot situation
  • That leaves only 12% for it being a front feet and leg problem
  • The outside rear claws bear the brunt of the lameness issue
  • The fact is that the rear outside claw grows faster because it is growing tissue in response to the greater pressure it endures while walking
  • Thin cows have a higher incidence of lameness
  • Thin cows mobilized fat from their bodies including the fat from the foot pad or digital cushion within the base of the heel structure. This results in less protection for the foot and heel.
  • The foot’s fatty pad can be replaced as the cow regains body condition but over time scar tissue will form when adequate fat is not present in the pads

Dr Atkins went on to highlight

  • His very telling statement followed, that being, “we need to evaluate feet and legs better”


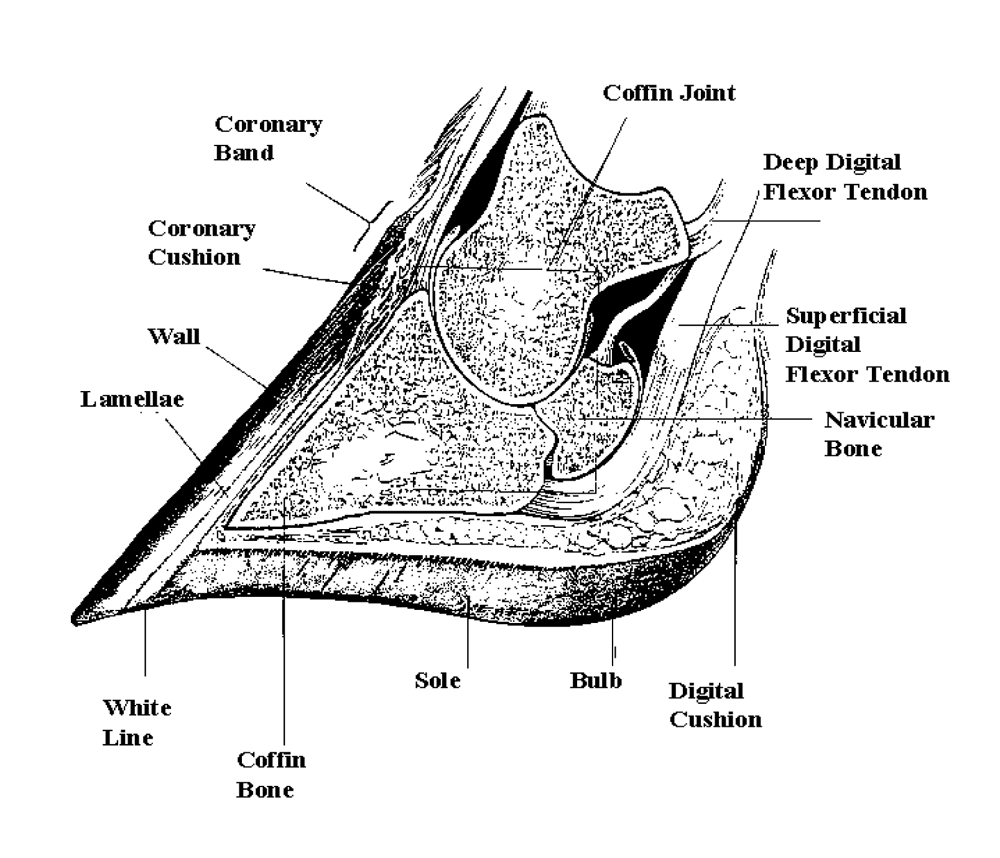
Diagram – cross section of the foot

Diagram – Cross Section of a Bovine Foot

Let`s Go Toe to Toe with the Facts Only Please

Let’s summarize:

  • Dairy cattle have a genetic problem relative to feet and legs especially for animals not allowed to get off cement or to exercise
  • It is rear feet that are the major portion of the problem with respect to lameness

The Achilles Heel for Classifiers

The classification system scores numerous traits but there are factors in the area of feet and legs that are beyond their control.  Foot angle is not a good trait to measure because it is so variable due to foot trimming. Cattle owners have feet trimmed before classification so type classifiers do not see the animals in their natural state.  Classifiers do the best they can, given the circumstances. Add to this the fact that classifiers do not see every cow walking. Since the ability to walk is what is most important, classifiers again are at a distinct disadvantage.

Estimating heritability using classification data shows these percentages:

  • 30% for bone quality (moderate)
  • 24% for rear legs side view (moderate)
  • 13% for rear legs rear view (low)
  • 11% for foot angle (low)
  • 8% for heel depth (low)

Yes the report card is in – we need to improve the evaluation feet and legs especially for rear feet and rear legs rear view. Genetically we have bred for thin cows and thus less fat in the foot pad. The only place we collect feet and leg data for genetic purposes is in the type classification programs and there the classifier, as mentioned, is at a disadvantage. What’s left that breeds, classifiers, people doing the genetic evaluations and breeders can do?

Getting a Toehold on the Solution

A collective approach is needed:

  1. We must admit that we have a problem and that we need to find a solution to more accurately knowing the genetics of feet and legs.
  2. The problem is not limited to one country and it is more prevalent in cattle not allowed to walk on natural surfaces.
  3. Resources (people and money) must be allocated to investigation and research.

Some suggestions the Bullvine has heard on ideas to consider include:

  • observe or measure the females over their lifetime
  • evaluate the feet on calves at weaning
  • evaluate the feet on heifers at first breeding
  • measure the feet on first lactation females on their first milk recording test day (before they are trimmed)
  • compare sire’s daughter feet and legs on confined versus pastured daughters
  • compare the genomic profiles of cow families that are both desirable and undesirable for feet (and legs)

It is encouraging to see that there is one hoof trimmers’ guild that has public support for a study to collect pedigree information at the time of trimming, to complete a report of the condition of the feet before trimming and then to have the data analyzed. That could be a start.

In the Interim… Feet Forward

Research takes time and cows are bred every day, in the mean time, breeders must use the information currently available from sire indexes or proofs. It is strongly recommended that sires be highly ranked for Net Merit, TPI or LPI and higher than 1.5 FLC or +7 Feet & Legs. A recent addition to the information to consider on bulls is their Body Condition Scoring index. Bulls whose daughters do not get as thin during lactation should not drain all the fat from their foot pads.  (Some Bullvine recommended sires to use can be found at From Fantasy To Reality – Top Sires To Address Herd Culling Problems)

The Bullvine Bottom Line- “Stop “Digging in Our Heels”

What is needed is an international approach to studying dairy cattle feet, much like the approach being taken to studying feed efficiency.  Hopefully a way will be found to move feet research in dairy cattle to the DNA level. If the industry collectively has the will, there will be a way. All we need now is a champion to take the first step.


Get original “Bullvine” content sent straight to your email inbox for free.


Genomic Young Sires vs. Daughter Proven Sires: Which one is best for Reliable Genetic Gain?

The Bullvine is often asked, “How can using genomic sires be better, if the genomic sire’s reliabilities are not as high as those for proven sires?” So in typical Bullvine style we set out to answer that question.  The following is our answer…

Single Trait – Fat

Bullvine wanted to keep this comparison as simple as possible.  To do this we used one trait, in this case fat yield, knowing that breeders do not select for one trait only. The results apply to all traits.

Females in Your Barn

You have a virgin heifer and a seven year old cow that are both indexed at 100 kgs for fat yield.  Both have been genomically tested and the cow is milking in her fourth lactation.  The heifer’s index is 67% Rel.  and the cow is 82% Rel.

TABLE 1: Females

Born Fat Index % Rel Regressed Fat Index
Heifer 2012 Jan 10 100 67 67
Cow 2005 Jan 16 100 82 82


Sires

Three sires you might consider using for breeding these females could be:

TABLE 2: Sires

Born Fat Index (kgs) % Rel Regressed Fat Index
Oman March 08, 1998 82 99 81
Supersire Dec 28, 2010 116 67 78
Pride January 27, 2012 135 69 93


Index of Calves

What will be the fat indexes for the resulting calves? (Add parents together and divide by two)

TABLE 3: Regressed Fat Indexes for Calves (kgs)

DAMS SIRES
OMAN SUPERSIRE PRIDE
Heifer 74 72.5 80
Cow 81.5 80 87.5

These values are the expected average fat indexes.  And, yes, there will be less variation amongst the progeny for Oman and the cow.  The most variability amongst the progeny can be expected for the heifer when mated to Supersire or Pride.

Therefore, the short answer for which bull to use, is Pride. Pride will maximize the calf’s fat yield index.

Rate of Genetic Gain

Determining genetic gain is a principle taught to all college genetic students.  The formula is:

Let’s simplify this:

Accuracy                              =             Reliability

Selection Intensity          =             Determined by where the animal ranks in the population (all these animals are in the top 1% of the population so their selection intensity is identical)

Genetic Variation             =             Standard Deviation of fat yield indexes (common for all the animals in the example)

Generation Interval        =             The average time between the birth of the parents and the birth of the calf.

Generation Interval is the place where the numbers for the heifer and the sires, Supersire and Pride, are much smaller (in years) than those for the cow and Oman.

TABLE 4: Generation Interval (years)

DAMS SIRES
OMAN SUPERSIRE PRIDE
Heifer 8.5 2.5 2.0
Cow 11.5 5.5 5.0

Since the numbers for fat index in TABLE 3 are all similar, dividing them by a larger vs. a smaller generation interval greatly affects the outcome for genetic gain.

For the cow and Oman dividing 81.5 (Fat Index) by 11.5 (Generation Interval) gives a much smaller gain than for the heifer and Pride (80 divided by 2.0).  In fact it is much different 7.9 compared to 40.

That’s the reason turning generations more quickly, using genomics, gives the faster rates of annual genetic gain. (Read more: The Genomic Advancement Race – The Battle for Genetic Supremacy)

The Bullvine Bottomline

Genomics gives you more speed.  No question.  If you’re worried about speed being dangerous, spread the risk by using multiple (not one) high indexing genomic sires where you might have only used one or two proven sires in the past.


Get original “Bullvine” content sent straight to your email inbox for free.


Dairy Cattle Pregnancy Rates: A CSI Investigation

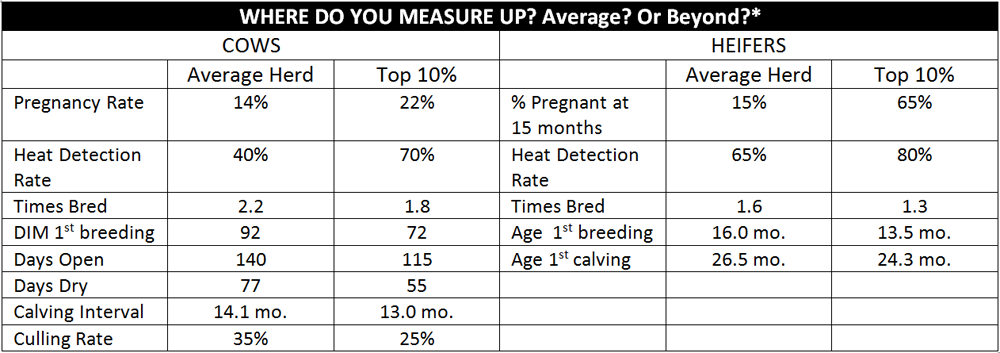
When you’re looking for money on your dairy farm, pregnant is where it’s at!  The person, team or tools responsible for success in this area, rank up there with the best investments you will ever make.  What is it worth?  A lot!  The Bullvine did some CSI investigation – Cow Scene Investigation into the numbers.

measure up preg rates

Face the Facts. Who’s to Blame?

According to researchers at the University of Wisconsin, 96 percent of the variation in conception rate comes from management factors.  Only the last 4 percent is related to the individual cow and service bull’s genetics.

Less is More $$$

Even though we are looking for more there are four lesser values that will help us make those dollars:  fewer non-productive cow and heifer days; fewer breedings and therefore less semen used; fewer vet expenses and, last but not least, less labor for observing, caring and feeding.

These four will make you big money.  And, one more, in fifth place that may be hard to get your head around. You may have to be willing to sacrifice 2 to 5 pounds of milk per day for the sake of reproduction. It appears to be on the negative side of the ledger because of the immediate reduction in the milk check.  However, the other savings could far outweigh this apparent deficit.  Don’t forget more calves are born and there is less culling of non-pregnant cows and heifers.

If you require more incentive, one anecdotal story reports on a herd that has a 25% pregnancy rate and the breeder projects that “over the next seven years I can double the size of my herd through internal growth alone.”

Where Has All Your Money Gone?

$- A missed heat cycle can cost as much as $29

$$- A missed pregnancy costs an average of $450

$$$ – Further economic analysis shows that each percentage point increase in pregnancy rate is equal to a saving of $35 per cow per year. So going from the average pregnancy rate of 14% to the top of 22% there is a savings of $280. It is entirely possible that considering all factors and both cows and heifers that a farm of 250 cows could save $75,000 which is $300 per cow per year.


At these levels of return, it’s easy to see how improving your reproductive performance pays off.  If you save $75,000 or even $50,000 (2/3 savings), you could hire an employee dedicated only to reproduction protocols and improvements.

When DIM is delayed because cows do not become pregnant on time, it’s not unusual to see a reduction of 10 pounds of milk of more per cow per day. This too adds up quickly.  This milk is not down the drain.  It never even made it to the bucket!

Take Advantage of Your Team

There are many experts who can bring something to your team:  A.I. staff, veterinarians, nutritionists, extension workers and other breeders. With these consultants don’t shy away from mistakes.  Once you know and admit where the problem is, you are half way to solving it. Once the problems are identified you have the opportunity to put solutions in place and make more money.

Invest in Cow Catchers

Heat detection is the easiest of the parameters to influence with training and management attention. The lower your current reproduction record is, the larger opportunity you have to improve it. One hour per week invested in training (i.e. heat detections) at $10 an hour will recover a tenfold or higher return from improved reproductive performance over a year.  Make sure the eyes on your cows know how to find cows in estrus.  Upgrade staff skill sets for managing reproduction and breeding for a pregnancy. Take a course or have staff take a refresher in insemination techniques.  Spend a little to save or make a lot.

Genetics is Where Every Little Bit Counts!

Although genetics only accounts for 5 to 10% of reproductive performance there are opportunities to improve here as well.

  1. Use higher conception semen
  2. Use semen with more sperm per dose
  3. If available, use semen that has a longer viability after insemination
  4. Only use sires that have 107+ Daughter Fertility or DPR 1.2+
  5. Avoid bulls that are over 2.85 SCS, cows more susceptible to mastitis do not conceive easily.

Step Up Your Game. Get off to a Good Start

  • Increase observations and monitoring (at least 3x per 24 hours)
  • Increase observations of bred animals until they are confirmed pregnant
  • Maintain accurate and complete records for access by all staff
  • Pregnancy check between 28 and 35 days post breeding
  • Cull any female that requires a 4th service

Take Advantage of Cash Cow Tools

  • Use a synchronization program for cows or heifers for which a heat is not seen
  • Use the reproduction part of your herd management software. Examples: REPRO MONEY is free of charge to Wisconsin dairy producers and is expanding to additional states in the future.  Other states, milk recording agencies and universities have similar programs.
  • Use activity monitors for loose housed animals
  • Investigate using transition cow and rumination software programs.

THE BULLVINE BOTTOM LINE:

You can’t reverse financial challenges such as high feed prices and items beyond your control. However improving poor reproduction is your responsibility.  Getting it right will significantly drive your profitability at the best of times and see you through the challenging ones!


Get original “Bullvine” content sent straight to your email inbox for free.


How Irish Dairy Farmers are Using On Farm Data to Increase Profitability

Loving one’s work is a nice thing to have but in the end work without reward does not equate to being in business for the long term. Every day we read about the dairy industry’s viability and sustainability but on an individual farm basis it comes down to having total revenue exceed total expenses. Some new revenue sources are possible on some farms, like the sale of embryos from top cows or heifers, but on most dairy farms revenue means the milk cheque. So having a successful dairy farm is all about maximizing milk revenue and keeping costs under control. And that takes careful management. Profit can generally only be had by careful management.

Herd Size Determines Management Style

Herds under 50-60 cows are frequently managed by recording and analysis using hard copy records with DHIA handling the production and SCC side of the information. But once over 100 milking cows the manager needs an electronic way to record or capture the on-farm events and information. At the present time that means the purchase of herd management software and someone entering the data for medium sized herds or the parlour electronics capturing the data at milking time in larger herds where the capital investment in an automated parlour can be justified. Of course on farms with robots the data is captured by the system and is available for the manager to address the exceptions or situations requiring attention. But for all herds the same rule applies – you can not manage without having the data.

Ireland took a Bold Step.

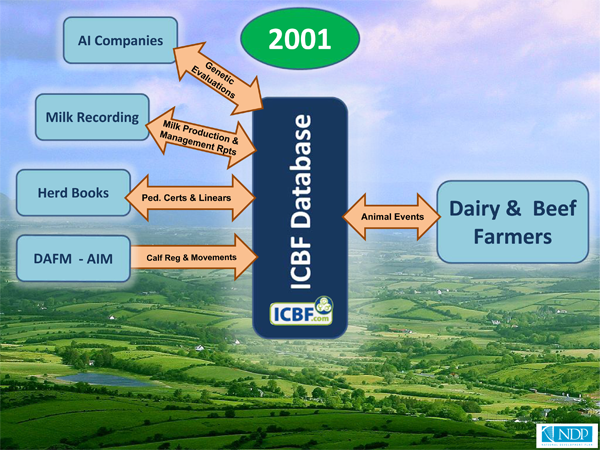
In 2001 the Irish Cattle Breeding Federation decided that farmers needed access to all the data from their farms in order to give them the opportunity be progressive and profitable. With public support from the National Development Plan (Transforming Ireland) the federation decided to bring together eight AI companies, nine regional milk recording agencies, the breed herdbooks, the department of the Irish government responsible for calf identification and animal movement and several farmer organizations to form one central database system. That was a major undertaking. The figure below provides the partners coming to the initiative in 2001.

A2 Downing-3

Dairy Farming in Ireland

Ireland has a pasture based, spring calving dairy industry. Cows must calve when the grass begins to grow each and every year. Cows not able to calve again on time for the spring are not retained at drying off time. As it would be too costly to overwinter a cow that would only have a short milking period in the subsequent year. Cow fertility is important in that system of dairying. In fact over the decade leading up to 2001, considerable emphasis had been placed on increasing milk yield much to the detriment of cow fertility and farmers were faced with the major cost of having to raise extra herd replacements for cows that may have produced more milk but were not able to get in calf. Something had to be done and 2002 was the year to get it done.

Irish Success

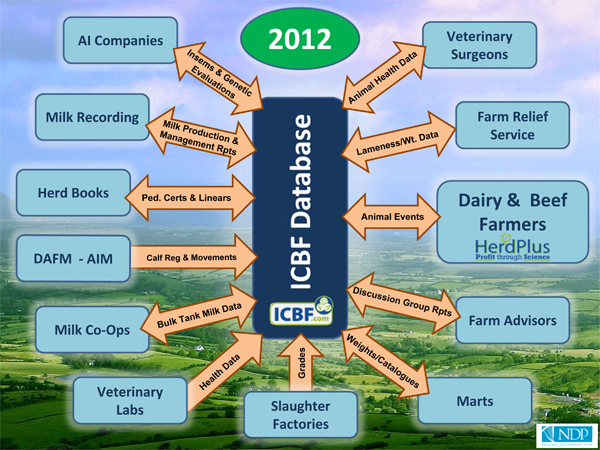
The theme chosen for the initiative was “Less Paper – More Profit (2002)”.  By 2006 the new data system was in place. There is “once only” recording of information or events and all data goes to the central database from farms, AI technicians, milk recording supervisors, veterinarians and many other organizations that touch Irish livestock farms. The figure below shows the many groups and individuals that provide data to the central database from Irish dairy and beef farms.  Data is entered via online entry from farms, handheld devices, mobile phones and third party data providers. Congratulations to the Irish Cattle Breeding Federation (ICBF.com) for bringing all the players to the table.

A2 Downing-6

What do Farmers and their Service Providers Get?

HerdPlus® Dairy provides users with a suite of reports and online services. Some of those products include:

Key HerdPlus® Reports

  • Calving Report – due dates, births, calving intervals, abnormal calvings, calf identification
  • Key Performance Reports – fertility, production, udder health, inseminations
  • Milk Co-op Performance Report – shipment details and milk quality by month and year

Key HerdPlus® Online Services       

  • Sire Advice – recommends sires according to producer’s goals including considering Inbreeding Checker
  • Catalogue Maker – for breeding stock sales
  • Stocking Rate & Nitrates Reports – for environmental reporting purposes
  • Discussion Group Reports – farmers can talk online to their fellow group members and compare results

Education Service

  • Young farmer training now includes a HerdPlus® training module
  • Farm service providers including economic advisors learn from the results, comparisons and benchmarks

Government

  • More informed and aware of industry performance and challenges
  • Can focus where to provide assistance with research and development

Successes Everywhere

This success story was presented at the September 2012 ICAR meetings and can be found at http://www.icar.org/Cork_2012/index.htm (K Downing – Using an integrated database to increase profitability on dairy farms).

A synopsis of the benchmarks of successes that have come about by having the integrated database as reported by Kevin Downing include:

At the Farm Level

  • Over 6050 farms participating by 2012 with focused goals and objectives (increasing at 9% per year)
  • 86% of the farms use the service online (14% use postal)
  • It is an excellent value at 60 euros per year (less than $US100)
  • Breeders are using superior sires through AI
  • Fertility performance has turned the corner and is improving

Beyond the Farm Level

  • Accurate nationwide benchmarks are now available for use by everyone
  • Both fertility and production per cow for the national herd are making significant improvement
  • Farm advisors, including veterinarians, now have all the facts when they advise the farmer
  • Farmers and their organizations have a national system that covers animal traceability, food safety and biosecurity

The Bullvine Bottomline

The Irish Cattle Breeding Federation central database has been a great move forward for farmers and the dairy industry in Ireland. Definitely the goal of “Data & Knowledge = Profit” has been achieved. It makes us all think about the big benefit there is to having all the facts in order make the best decisions possible. Managing for profit makes for a long rewarding and successful career in dairy farming.


Get original “Bullvine” content sent straight to your email inbox for free.


The Truth About Genomic Indexes – “show me” that they work!

Genomic indexes have created both excitement and concern in the dairy industry.  Some accept the science and the results while others are saying ‘Not so fast please! How can the accuracy be checked out?’ In the history of the dairy industry there has been 3 key issues that breeders took a strong stance for or against, artificial insemination, genetic indexes and now Genomics. With new traits being introduced and the world becoming more global there has certainly been loads of debate. While there has been many anecdotal comments about how and if it is working.  In an effort to further answer this question (Read more – Is The Genomic System Really Working), the Bullvine went searching for information on how genomics is performing outside of North America and also how it is performing for health and fertility traits.

The German Genomic Experience

Dr Stephan Rensing from VIT (Genetic Evaluation & Research Centre) in Verden reported on genomics in dairy in German at the September 2102 ICAR Meeting (Read more – What the Experts Will Tell You About Who Is Winning The Genetic Improvement Race). His presentation was entitled “Two years of experience with genomics – how well does it work?”   In Germany, like elsewhere, about 50% of the AI services are to young sires with both parent averages and genomic results.

In his report he mentions that with genomics results, known early in life, it totally changes the practices that breeders and A.I. organizations follow in selecting animals. Instead of selecting based on parent averages with low reliabilities followed by sampling, evaluating and then selecting the very best, both breeders and AI can now relatively accurately make selection decisions well before an animal is reproductively mature. He strongly recommends that selection be made based on all the information that is available on an animal at any point in time. That can be parent averages and genomic indexes or indexes that include parent averages, genomic evaluations and progeny performance data. Breeders have a new tool to increase accuracy and speed up the decision making.

The bottom line for Dr Rensing is that genomics is working very well in Germany.

In God We Trust, All others must bring data

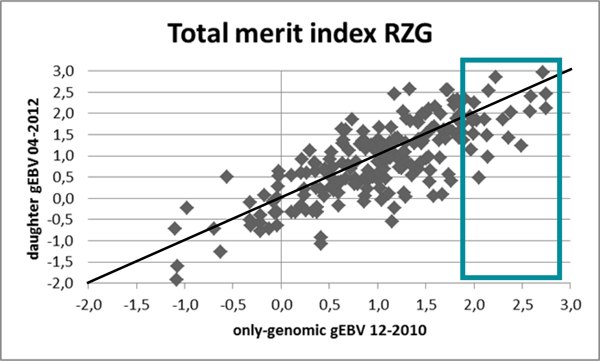
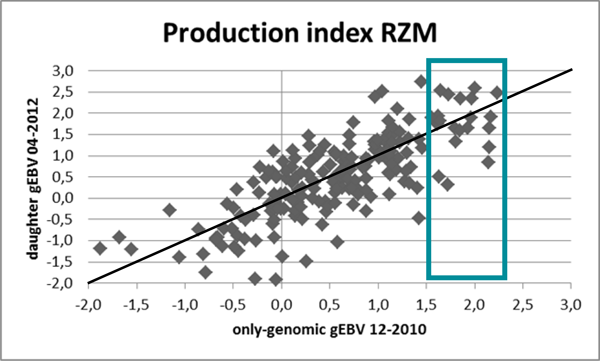
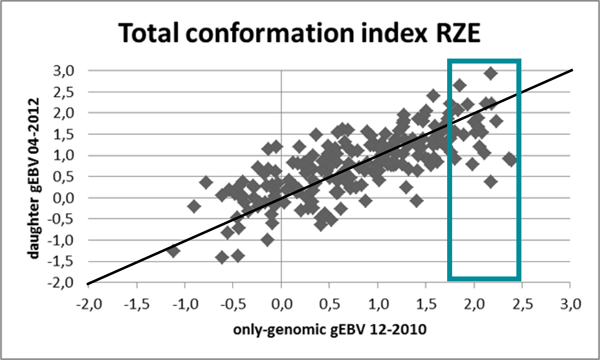
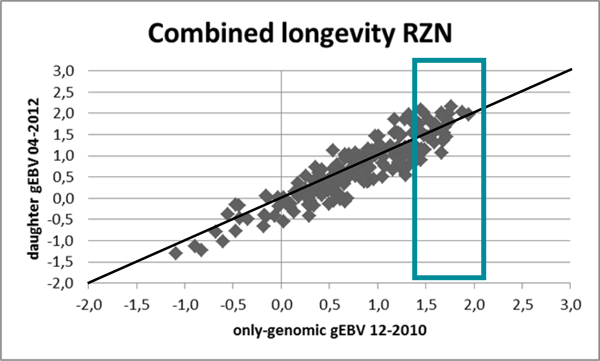
Dr Rensing included in his study the 199 bulls in Germany that received their first official daughter proof in April 2011. He compared their December 2010 genomic indexes to their April 2012 proofs. The reason April 2012 (the 4th proof run for the bulls) was chosen was because it allowed for more daughters, more data from each daughter and for daughters to be in their second lactation. Or in short, provided for more accuracy. Dr Rensing studied  the correlations between the two sets of indexes and also how the very best sires performed. The very best sires are important as they are the ones returned to active AI service and used as the sires of sons.

12-2010 genomic proofs vs. 04-2012 daughter based proofs

12-2010 genomic proofs vs. 04-2012 daughter based proofs

For total merit (RZG) 95% of the bulls have an official daughter proven index within 0.6 standard deviation of their genomic index. That is very good. Much better than had been the case when bulls only had pedigree indexes when entered into A.I.. Note that the top 10% (twenty) of the bulls perform in a similar manner to all the other bulls.  Showing that even the extreme sires had the same expected performance reliability as all the others sires.  Something anecdotal comments in the past thought to be not true.


12-2010 genomic proofs vs.04-2012 daughter based proofs

12-2010 genomic proofs vs.04-2012 daughter based proofs

When looking at production indexes (above) and conformation traits (below), again 95% of the bulls have a combined April 2012 index within 0.6 standard deviations of their December 2010 genomic index for both production and conformation. More evidence that there is a good relationship between genomic and official progeny proven indexes.

12-2010 genomic proofs vs.04-2012 daughter based proofs

12-2010 genomic proofs vs.04-2012 daughter based proofs

The results from health traits (below) surprise to me. I had thought that there would be greater variation between genomic indexes and official progeny proven indexes for these lowly heritable traits. However it is less, almost half as much variation. After thinking about it, it stands to reason that for traits of lower heritability the genomic indexes are a giant step forward and will greatly assist in breeding for mastitis resistance, fertility and length of productive life. Since the Holstein breeding world is moving to breeding for these traits (Read more – Fact vs. Fantasy: A realistic approach to sire selection and From Fantasy to Reality: Top sires to address herd culling problems) genomic indexes will make that almost impossible job possible.

12-2010 genomic proofs vs. 04-2012 daughter based proofs

12-2010 genomic proofs vs. 04-2012 daughter based proofs


Comparing Top Canadian Genomic Bulls

To take this article one step further The Bullvine decided to study the current top five gLPI and compare them to each other.

NameLPIProtConfSCSDF
MR LOOKOUT P ENFORCER-ET383789152.81109
GENERVATIONS LIQUID GOLD360787142.84102
MR CHARTROI ELOQUENT-ET350791132.8197
MR LOOKOUT P EMBARGO-ET346771162.85105
DE-SU DISTINCTION 11130-ET344774142.79104

To start with we must say that these five bulls are all 99% Rank. Enforcer is the best for LPI and daughter fertility. However each other bull has his strength – for protein yield Eloquant is the best, for conformation Embargo is the best and for SCS score Distinction is the best. If you are using any or all of these bulls, first make sure they are strong where your herd needs improvement and then use corrective mating.

More CDN Research Underway

CDN is currently conducting research into confidence limits around the individual trait genomic indexes. Some time ago CDN did publish that for genomically evaluated bulls with 65% reliable gLPIs, breeders can except 95% of the time that their official proof will be within 670 LPI points (within about 18-20%).  Meaning that we can be 95% sure that Enforcer will be higher than +3167 LPI once he has his official progeny proven index that is over 90% reliable.  That would mean that at least 95% of the time Enforcer would end up with an official proof that would rank him #2 in Canada.  That is the worst case.

Apply this to your breeding programs when looking at a genomic young sire you can take 670 LPI points or approximately 455 TPI points off their predicted index and they will achieve that number or higher 95% of the time. For example, take the #1 gPA TPI sire, Seagull-Bay Supersire, who has a current gPA TPI of +2530, you can be 95% certain that his daughter proof that is over 90% reliable will be at least +2075.  That would place him in the top 43 sires in the US (220 points behind current proven leader Freddie).  Remember that is 95% of the time he would be there at least.  Not a bad worst case scenario.

The Bullvine Bottomline

Genomic indexes are a great tool that allows breeders around the world to more accurately select from within the animals that do not have an official sire proof or cow index. It is true they are not as accurate as indexes that include actual cow or progeny performance information for production and conformation traits. However they are significantly better than parent averages and a great addition to the breeder’s tool kit when it comes to selecting for health and fertility. They are here to stay, they will be used by discerning breeders and yes they will be improved on over time.


The Dairy Breeders No BS Guide to Genomics


Not sure what all this hype about genomics is all about?

Want to learn what it is and what it means to your breeding program?

Download this free guide.


What the Experts Will Tell You about Who Is Winning the Genetic Improvement Race

Every country loves to tell you that they have the best Genetics in the world and that their cattle are superior to any others.  At a recent International Committee for Animal Breeding (ICAR) Session in Cork Ireland, a group of leading geneticists got together to discuss lots of highly scientific and many mind boggling things.  Tables upon tables of stats and graphs that look more like maps of the solar system and would make most people’s heads spin.  However, from that session there were some really interesting presentations about genetic improvement around the world that just needed to be “translated” into dairy speak.  The following is the Bullvine’s attempt to de-nerd the nerdy.

Look Who`s Talking

Canadian Dairy Network Researchers, along with an associate, presented a paper entitled “Genetic improvement: a major component of increased dairy farm profitability’.  To be totally honest it was the ‘profitability’ word that first drew our attention but on reading the paper, studying the power point presentation and listening to the video of the presentation on the Internet (http://www.icar.org/Cork_2012/index.htm) we garnered many interesting facts about the genetic merit of bulls and genetic trends by year for many traits in seventeen countries for the time period 1997 to 2006.  Sixteen of the seventeen countries studied were sampling more than 200 dairy bulls per year and in the USA both the TPI™ and Net Merit were included in the analysis since both are widely used total merit indexes.

Genetic Progress –Which Countries are winning the genetic race?

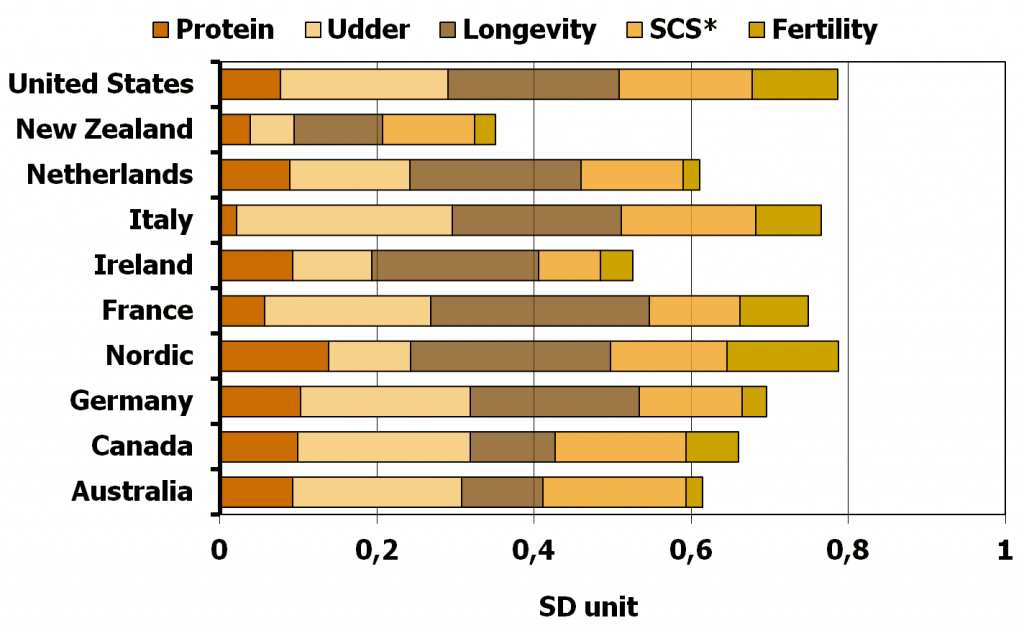
Are breeders in these 17 countries making genetic progress?  Definitely yes!  It is difficult to compare across countries given the multitude of ways of expressing sire proofs for traits across countries.  Therefore, the researchers converted the expression to standard deviation units (SD unit) and summarized the results in the accompanying graph comparing the time periods 1997-2001 to 2002-2006.

Yearly genetic progress by country and trait

Yearly genetic progress by country and trait (bulls born 2002‐’06)

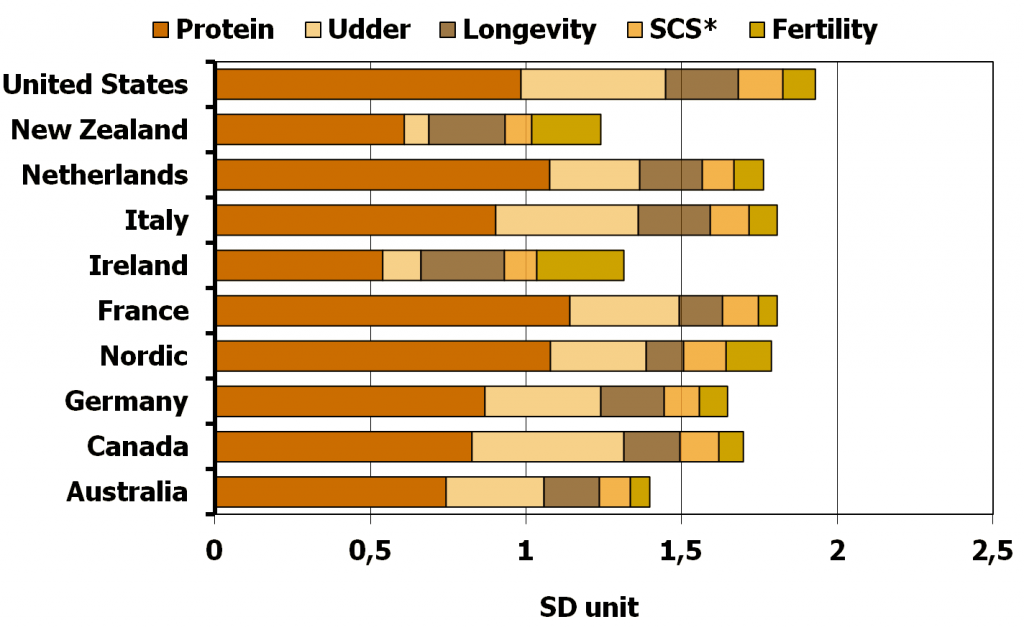
It is interesting to see that while many of the major genetic markets in the world are advancing at similar rates, the Nordic countries are giving the United States a run for their money and the Canada was the sixth fastest advancing country, almost 18% behind the genetic advancement rate of the US and the Nordic Countries.

Canada`s NOT First

So I am sure many of my fellow Canadians are saying that we are ahead in the race, others may be gaining on us, but we still have the best cattle there are.  Well folks I hate to burst your bubble but as the following chart shows, for bulls born in 2005-2006, it’s actually the United States that are out ahead followed by France and Italy.  Canada comes in sixth, behind the Nordic regions and the Netherlands.

Average EBV of bulls born 2005‐'06 'for the 17 country average index

Average EBV of bulls born 2005‐’06 ‘for the 17 country average index

Genetic Progress by Trait – The Leaders and the ‘Also Rans’.

  • Protein Yield: Increasing rates of genetic gain have been achieved by all countries except for Ireland and New Zealand where progress has been flat lined due to the major selection emphasis being on fertility and other management traits.  The leaders for the increased genetic progress in protein yield are France, Nordic Countries and the Netherlands.
  • Overall Udder: The rate of genetic progress for udder is also building at an increase rate with the leaders being Italy, Canada and the USA.  Selection for udder improvement was not part of the breeding strategy in New Zealand and Ireland and no genetic progress was made for udders in those countries.
  • Longevity: Very significant progress was made for longevity in all countries with the leaders being Ireland, Italy, New Zealand and the USA with France following behind the rest of the pack.
  • Somatic Cell Score:  No genetic gain was made in any country from 1997-2001 for SCS.  However that turned around after 2001 and all countries made progress with the leaders for genetic progress being the USA, the Nordic Countries and Canada.
  • Calving to First Service: Ireland and New Zealand have made progress since 1999 and are significantly out in front of all other countries.  For the other countries there was negative progress until about 2003.  Since then all countries have started to give attention to this trait and the tide has turned to where slight progress was being made by 2006.  After Ireland and New Zealand, The Nordic Countries are leading the other countries in increasing their rate of genetic progress for this fertility trait.

So what happened to production?

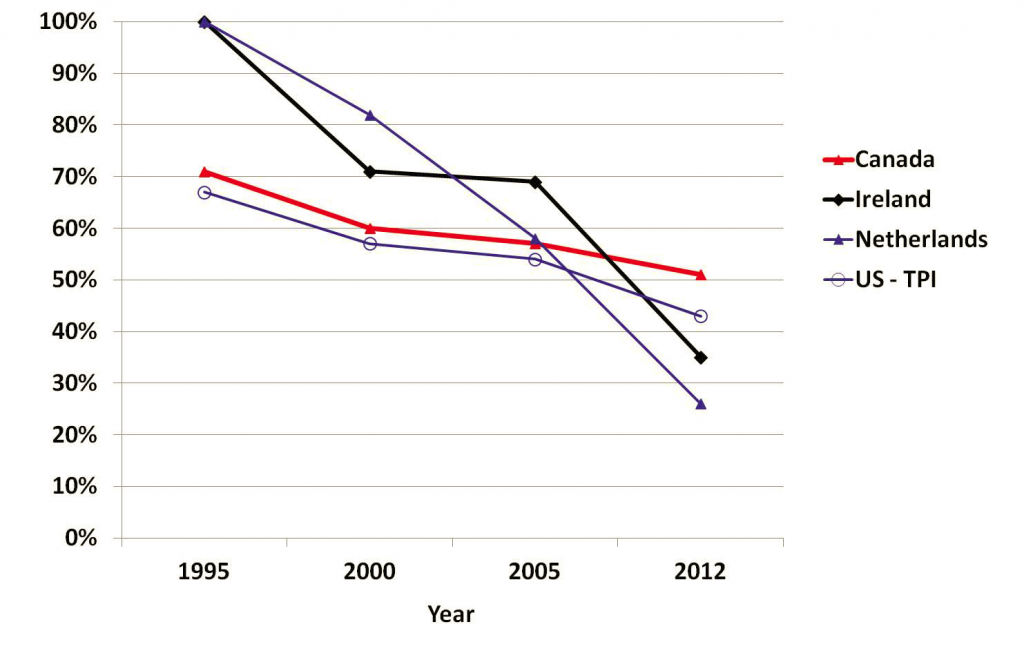
There is Reduced Emphasis on Production. By way of example the researchers provided a graph (below) showing how The Netherlands and Ireland have gone from 100% emphasis on production traits in their total merit index in 1995 to approximately 30-35% in 2012.  While the USA and Canada have been more moderate in their reduced emphasis on production traits, from 70% to 45-50% in their 2012 total merit indexes.  There is more to breeding than all out selection for production but it is still an important component in the total scheme of things.


Relative emphasis in national selection indices

Relative emphasis in national selection indices

What Traits are Driving Progress?

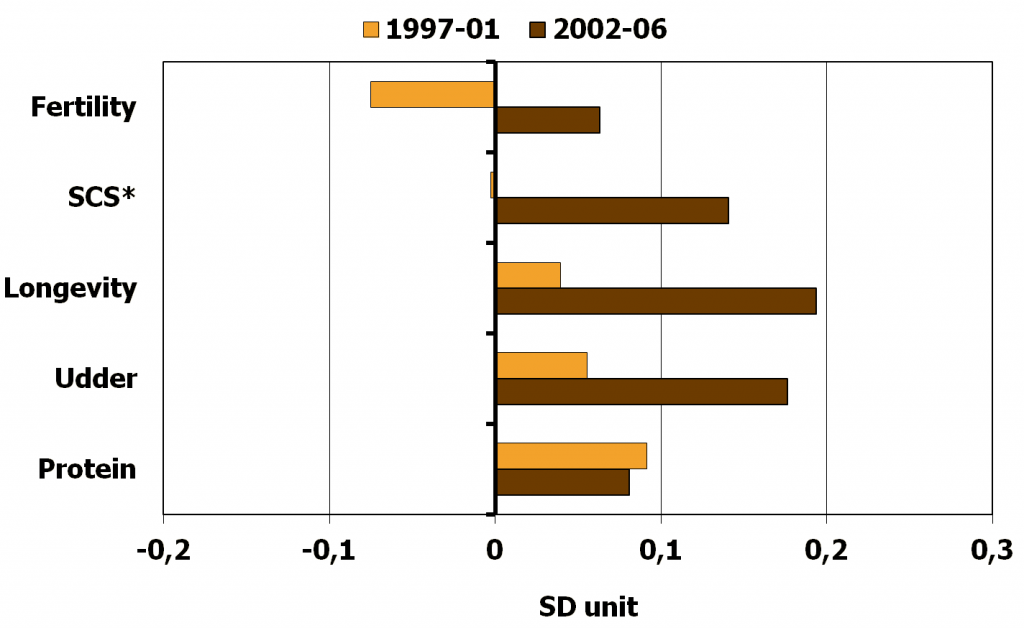
When you take a look at the average genetic progress by trait across countries (graph below) you  see that the rate of genetic advancement in each area reflects the relative weighting change in each country`s  major index.  With the rate of genetic gain on longevity, health and fertility greatly improving and that for the production trait (protein) actually showing a slightly slower rate of genetic gain.  It is interesting to note that in the period of 1997-2001 the primary emphasis on protein improvement actually had a negative impact on the rate of improvement for fertility.


Average genetic progress by trait across countries

Average genetic progress by trait across countries

Different Strokes for Different Folks

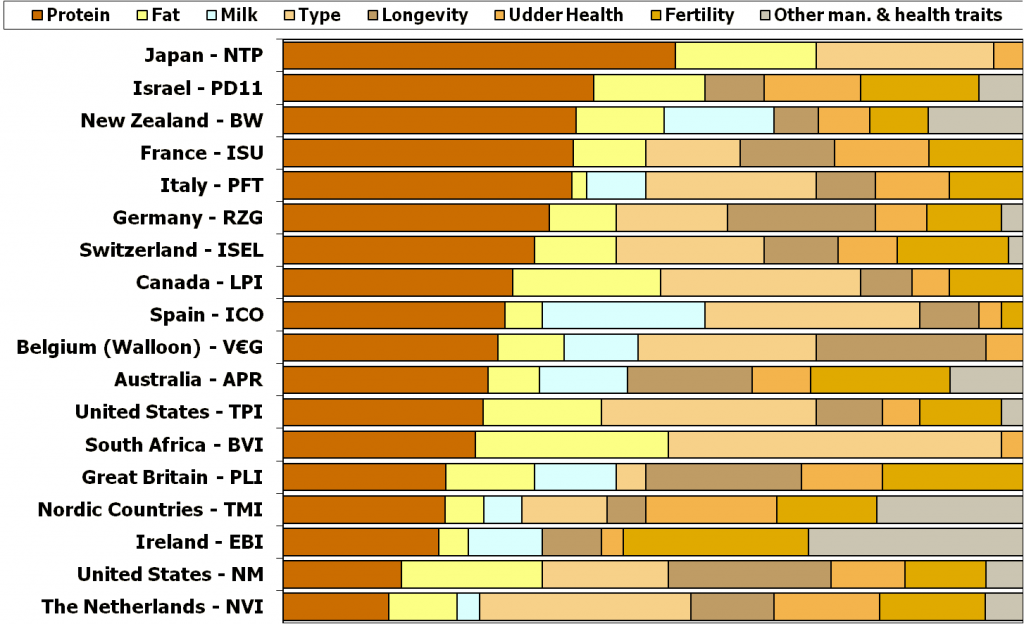
As the chart below indicates, the relative weights each country put on each trait in their national indexes has a huge impact on the rate of genetic gain for those traits.  We understand that not every country dairy’s under the same circumstances.  Hence why for Japan places 72% of the emphasis on protein, fat and milk while the Netherlands places 26% of the emphasis on protein and fat yield.  Ireland and then the Nordic countries place the most emphasis on Health, Fertility and other management traits.  South Africa then USA (TPI™), Spain, The Netherland and Canada place the most emphasis on overall type.  Italy places the most emphasis on udders.  In addition, the USA (Net Merit) places the most emphasis on longevity.

Relative weighting of selection indices worldwide

Relative weighting of selection indices worldwide

The 2012 average weights placed on the various components in the 18 indexes are:

  • Production 48%
  • Type 17%
  • Longevity 11%
  • Fertility 11%
  • Udder Health  8%
  • Other  5%

Increased emphasis on functional traits in most countries has resulted in more genetic progress for these traits.  These advances were achieved without a reduction in the rate of progress for key production and conformation traits and without the use of genomic selection, since that new tool was not yet available. As genomic genetic evaluations were not occurring from 1997 to 2006, it will be interesting to see the trends for the five and ten years following 2006 when extensive use of gnomically evaluated bulls has occurred.

The Bullvine Bottom-line

Neither the art nor the science of dairy cattle breeding is dead.  In fact it can likely be said that rates of genetic improvement are about to accelerate.  Are we ready to keep up?


Get original “Bullvine” content sent straight to your email inbox for free.


30 Sires that will produce Feed Efficient Cows

2013ecttop13of2013Commercial milk producers want to breed cows that have high feed conversion efficiency, that avoid culling and that take the least care or staff time (Read more – Feed Efficiency: The Money Saver).  The well known and widely used total merit indexes, TPI*TM  and LPI, rank sires according to which ones leave the most profitable ideal or true type cow. However the factors in those indexes and the assumptions that are made when calculating them do not address feed, culling or low maintenance.   Milk producers are left to fend for themselves when it comes to selecting sires that will leave their kind of cows.

What’s Being Heard

Milk Producers say: “All I want is a trouble free cow that efficiently converts forages to the kind of milk my milk buyer wants.

Veterinarians say:  “Cows must get in calf, have minimal feet problems and must not be prone to having production limiting diseases (reproduction problems, mastitis, metabolic disorders or  ..etc.).

Farm Workers say:  “Sick animals, calving problems and animals that do not work easily within the farm system waste my time.

Feed Advisers say: “Test your forages, feed the rumen, get the most out of your forages and the use of nutrients for both production and maintenance must be considered simultaneously (i.e. medium sized cows yielding the same as large cows are more feed efficient).

Milk Processors say: ”Except for the milk we sell as a drink, we want the solids not the water.

Financial Advisers say:  “Make decisions based on profit per cow, per litre, per hectare, per pound of feed consumed, per worker, …etc.

Consumers say: – Well in fact we may not be listening to consumers (Read more – Milk Marketing: How “Got Milk?” became “Got Lost”)

There are even more voices speaking in producers ears and more words appearing on the computer screens that producers read.  With all the information that is currently available, selecting sires that best meet the needs of milk producers can be a daunting task.

Getting Started

Milk producers do not wish to deal all the numbers that appear on proof sheets. That can be a very time consuming exercise with no definitive answers at the end of it.

The Bullvine decided to research what is available today on selecting sires for feed conversion efficiency, for freedom from major known reasons for culling and for minimal extra care. We recognize that down the road there will be genomic indexes that are based on the relationship between yet to be recorded on-farm cow performance data and the DNA make-up of cows for these three areas. But today those genomic indexes do not exist.

Bullvine Efficiency Index (BEI)

Based on the information from a number of countries that we have been able to access, the Bullvine has developed the following formulas:

  1. BEI = Production (45%) + Durability (35%) + Health & Fertility (25%)
  2. Production = 30 Fat Yield + 50 Protein Yield + 10 Fat% + 10 Protein%
  3. Durability = 17 Herd Life + 42 Mammary System + 25 Feet & Legs  – 8 Body Depth – 8 Stature
  4. Health & Fertility = 46 Somatic Cell + 23 Daughter Fertility + 23 Udder Depth + 8 Milking Speed

Notes:

  1. Milk Yield is not included as it contributes to more udder strain and added milk haulage or on-farm water removal costs.
  2. The negative weightings on Body Depth and Stature reflect that larger cows  require extra feed to grow to that size and to maintain that larger size each and every day compared to cows of more moderate size.

Sire Rankings

Using CDN’s Custom Index Calculator  the following sires came to the top of the list,

CANADIANINTERNATIONALYOUNG SIRES
LONG-LANGS OMAN OMAN-ETCO-OP BOSSIDE MASSEY-ETFARNEAR-TBR-BH CASHMONEY-ET
CRACKHOLM FEVERCOYNE-FARMS DORCY-ETSOUTHERN-HILLS BAYARD-ET
BRAEDALE GOLDWYNDE-SU  CIMARRON-ETFARNEAR-TBR-BH CASHCOIN-ET
ALLYNDALE-I ATTICUSBADGER-BLUFF FANNY FREDDIEMR LOOKOUT P ENFORCER-ET
LIRR DREW DEMPSEYCERVI ALLEMAR ETCO-OP BOOKEM YUXI-ET
DE-SU GILLESPY-ETDE-SU GULF-ETCO-OP MASTER GENO-ET
GEN-I-BEQ BRAWLERBERTAIOLA MINCIO ETAMIGHETTI NUMERO UNO ET
GILLETTE JORDANGUARINI-ETTEEMAR OBSERVER ADAM-ET
GEN-I-BEQ TOPSIDEDE-SU FORK-ETDE-SU DISTINCTION 11130-ET
ENSENADA TABOO PLANET-ETDE-SU WATSONDE-SU UNO 11446-ET

Please note: Due to the fact that CDN’s Custom Index tool only allows quires by Domestic Canadian, MACE and Genomic individually it is not possible to do an overall ranking.

Key Findings

  • Except for the Domestic Canadian list only a small difference exist between bulls
  • The rankings do not always follow TPI* TM or LPI due mainly to the negative weighting on body depth and stature and increased emphasis on SCS, daughter fertility and udder depth.
  • Although Braedale Goldwyn, Sandy Valley Bolton and Picton Shottle progeny are prominent on these listings, they are from different cow families so inbreeding using the sires on these lists should not be a problem, providing a breeder does not focus on just one of them

Highlights

  • Braedale Goldwyn appears on the listings himself. As well he has six sons on the lists and is the maternal grandsire of three of the genomic bulls.
  • Sandy Valley Bolton has seven sons on the listings
  • Picton Shottle is the maternal grandsire of nine bulls on the listings
  • Oman sons Long-Langs Oman Oman and Badger-Bluff Fanny Freddie both appear on the listings, as do one son and one maternal grandson of each of them
  • De-Su Observer, yet to be daughter proven, has three sons and one maternal grandson on the genomics listing

The Bullvine Bottom Line

Commercial milk producers often want the decisions on which sires to use to be as simplified as possible. That is why the Bullvine has produced these BEI listings. With due consideration to avoid inbreeding, milk producers can expect BEI to rank bulls for them for production, durability and health & fertility with emphasis on the sires that can convert intake into milk production.

Get original “Bullvine” content sent straight to your email inbox for free.


Feed Efficiency: The Money Saver

Fed up? Losing money? Start Tracking Feed Efficiency. The current lack of forages for dairy cattle in North America and high grain prices globally has brought feed front and center on most dairymen’s radar screen. Since for most herds feed costs vary between 50% to 60 % of the dairy’s operational costs, the current higher costs are narrowing on-farm margins. In some cases it has resulted in farms downsizing their milking herd, selling off their heifer herd and for some farms an exit from the dairy business. To say the least dairy farmers are having to address something foreign to most of them – the amount and cost of the feed their herd is consuming.

New Territory for Dairy Farmers

Given that dairy cattle breeding, to a very large extent, has ignore any genetic aspects to a cow’s ability to convert feed into milk, the idea of culling cows that do not convert well is an unheard of practice. Seeing that this subject is new to most breeders, The Bullvine decided to delve a little deeper into what is known and what investigation is underway when it comes to the efficiency with which cows convert their feed to products humans can consume.

Feed In. Dollars Out. It’s Hard to Capture FIDO.

It is costly and time consuming to capture individual cow feed consumption, so producers and their feed advisors have taken the approach of feeding the herd or groups within the herd and monitoring the production, feeds costs and the returns over feed costs. Only in research herds has there been any attention paid to individual cows and their efficiency of conversion or return over feed cost.  And then only for cows on feed composition trials and nothing on a cow or sire’s daughters genetic merit for feed conversion. So to put it simply the industry has said – feed them more, balance the diet differently, add some micronutrients, have adequate fibre in the diet, etc. because we have not been able to address the cow’s genetic ability to convert feed to milk.

What We Know about What’s Eating You

Some facts about feeds, feeding animals and feed costs include:

  • The poultry and swine industries have paid considerable attention, for quite some time now, to feed conversion / feed efficiency. With much success especially in      poultry meat industries. In beef and sheep feed conversion for animals being finished in feedlots is an important profit factor.
  • In dairy cattle, feed conversion ability includes all aspects – feeding for growth, production and maintenance.  We do not always think about the extra cost to grow heifers larger or to maintain a large versus a medium sized cow. By the way the Net Merit index does include a 6% weighting on cow size. And it is a negative weighting so larger cows are penalized for their extra size. So if you have been using the Net Merit index you will already be indirectly breeding for feed efficiency.
  • Level of milk production very much depends on the amount of feed consumed by a cow (commonly known as Dry Matter Intake). But we do not know the degree of correlation between volume consumed and feed efficiency.
  • Recent cost studies show that milking cow feed costs on individual farms vary from 20 to 35% of milk revenue. That variation is significant! So the opportunity to make progress in returns over feed costs is out there.
  • Given the wide variety of feeds and feed practices on dairy operations, an average feed cost per milking cow per day on individual farms can be anywhere from $4.00 to $8.00.
  • Every day dairy farmers have happen but do not monitor or comprehend differences in their cows’ ability to convert their diet into milk revenue. Depending on lactation numbers and stage of lactation a cow consumes 1 kg of dry matter to producer between 0.8 kg and 1.8 kgs of fat or energy corrected milk. Differences in milk, fat and protein production are monitored on-farm however cow differences in feed conversion efficiency are not.

Measuring the Future: You are What THEY Eat

Farmers and their nutritional advisors will continue to fine-tune the diets of cows. That’s a given. Gains in the returns over feed costs will be made by fine tuning diets and by adjusting the management and environments for cow and heifers.

However if the swine and poultry industries have been able to genetically enhance their species’ ability to convert feeds to meat or eggs, then is there not an opportunity for dairy cattle to also be bred for feed conversion efficiency?

It should be possible to breed for heifers that grow more efficiently and cows that convert feeds more efficiently into the milk needed to produce the products consumers want and will buy. If through more efficient milk cows there could be $0.33 more profit per cow per day, which amounts to an extra net income of $25,550 per year for a 200 cow milking herd. Nothing to be sneezed at.

From a Pile of Feed to a Pail of Milk?  Where’s the Genetics DATA?

However the challenge remains how to the get data for use in on-farm decision making and for determining the genetic difference between animals and bloodlines for feed efficiency. Well in fact there are some keen researchers in the United States, the Netherlands, the United Kingdom and Australia in association with countries with national data bases used for genetic evaluation addressing this challenge. Currently they have studies underway to measure feed intake and cow outputs for cows on research trails. After obtaining the data they will correlate the efficiency results with the DNA (snips) makeup of the cows. In the USA alone there will be over 8,000 cows currently being studied.

Within a year the dairy industry can expect to see some preliminary results of this research work. But genomic indexes will only be the start. I expect that on-farm data capture software and systems will become available to measure a cow’s feed intake. The data from such systems will have value both at the farm level and at the genetic evaluation level.

The Bullvine Bottom Line

Stay tuned for what will be new genetic evaluations and animal genomic indexes for feed conversion efficiency. It could take up to a decade for there to be accurate indexes and wide use made of the indexes but it will come fast once the basics building blocks are in place. Even a 5% gain in feed conversion efficiency in dairy cattle will be worth billions of dollars annually to the global dairy industry. Once again opportunity knocks at our doors.

Looking for more on Feed Efficiency check this out – Holstein vs. Jersey: Which Breed Is More Profitable?

Semen Prices Are Never Too High

Many cattle breeders may be under-spending on semen. They have the mistaken idea that not spending is providing savings. What they are failing to consider is that short term savings could be causing expenses in the longer term.  While the old adage “It takes money to make money.” seems cynical, there are times when it simply means there is good cause for loosening the purse strings.

Heifer Costs TODAY

A check of dairy heifer rearing costs for North America reveals a range between $1900 and $2200. For today’s discussion, let’s assume that that is the cost to produce an average proven sire daughter. It takes five doses of semen to get a heifer calf (including repeat services and a ratio of 50% bulls and 50% heifers). Therefore the cost to get a higher quality heifer is $ 2000 + 5 times the extra semen dose costs. That is the simple math and the simple answer is “Yes!” It costs more and the numbers could range, on average, from $25 to $50 extra per female bred per year.

What’s it WORTH to YOU?

It would be wonderful if you could dial in a one-size fits all answer to the complicated business of dairy cattle breeding. Since we can’t, we have to constantly analyze our business and the marketplace. Each dairy herd ultimately has to make semen buying decisions based on the answers to questions such as these ones:

  • Where are the genetics of your herd at today?
  • Where do you want your herd genetics to be in the future?
  • What financial or logistics issues affect your sire choices (i.e. herd size; availability of semen)?
  • What market are you targeting as your revenue stream (sales of milk, embryos or breeding stock?)

A Closer Look at SEMEN

Looking at recent economic studies we found that, on average, North American producers spend about 1.5% of their annual expenses on AI costs. On average that is $76 per cow per year and that does not include the on-farm labour costs for herds that inseminate their own animals. If, upon reading this, you are happy with where you fit in relation to the average, let’s remember “Being average today means that you will be behind tomorrow!”

At The Bullvine we are interested in which sires get used.  We obtained the semen price lists for six major North American AI studs.  Each organization has different product lines and their pricing strategies and customer focus groups also differ.

Our next study was to determine average semen prices, depending on a bull’s merit. For each organization we determined a weighted average semen price and compared categories of bulls to that average. The following chart shows how much extra you would have to spend on semen cost to get the targeted results. (See below)

What’s the DIFFERENCE?

Targeted Results Extra Semen Cost per Dose
Average Proven Sire on Price Listings $ 0
Sexed Semen  + $19
Proven Sires  
Over 2200 TPI and PTAT >2   or  2500 LPI and CONF >+10 + $22
Over 2000 TPI and PTAT >1 or  2000 LPI and  CONF >+5 $0
Other bulls -$21
Net Merit > +$600  + $10
Unproven Sires
Genomics        TPI > 2200 or LPI > +2500 + $ 18
Genomics        TPI < 1800 or LPI < +2000 –  $ 11
Net Merit > + $750 + $ 12

Since neither Red nor Polled Sires on the price lists covered the genetic merit ranges listed above, a comparison for those categories was not possible.

An increase of $20 per dose is one thing when you’re looking at a 40 cow herd but it becomes quite significant in a herd of 500 cows.  Is it a good investment or a worrisome expense?

What Is The Sexed Payback?

At the outset you have to accept that any payback from using sexed semen or will be three to four years down the road.  With sexed semen, although there is lower conception and therefore it requires more doses per pregnancy, you are 90% sure of getting a female.  Some breeders limit the use of sexed semen to their higher genetic merit animals. The payback is that they get more heifers from cow families they want to build from. Consider that 100 cows require an average of 30 replacements (a range form 20 to 40 dependent of herd).  Using sexed semen on your top 50 cows will cost an additional $2850 ($19 x 3 or $57 in semen per cow). Your savings will have been in not rearing heifers from lower end cows. Those low end heifers can be sold at birth, vealed, bred for beef calves or used as embryo recipients. If you save $250 per cow per year in rearing fewer calves and getting some income from low end heifers calves, you save $25,000 for every 100 cows in one year. Why isn’t everyone using sexed semen?  Simple answer: Sexed semen is not available on unproven or all top bulls.

Proven Semen: Show Me The Money?

The difference in semen cost between an average and top proven bull is $110 (5 x $22) per heifer calf. By selecting to solve herd problems (Read more – Fact vs. Fantasy: A Realistic Approach to Sire Selection and From Fantasy to Reality – Top Sires to Address Herd Culling Problems), here is what should you get for your money:

  • Less mastitis
  • Less feet problems
  • Less labour for calving problems
  • Less labour for health problems
  • Higher performance
  • Longer Productive Life

If you can save $250 per cow per year on these issues, you will net $14,000 per hundred cows.  So you have invested $11,000 to get $25,000 back.  A net of fourteen thousand is nothing to sneeze at. And, unlike with sexed semen, you should be able to target the bulls that provide the corrections that your herd needs.

You Could Get EVEN MORE MONEY.

There is a $29 difference (-$11 vs. +$18) between young sire with low genomics compared to one with high genomics. Here it gets into exactly which young sires you use. If you use the top ones, you reduce the risk of calving out the “dogs” from lower end genetic bulls. If it costs $2000 to raise a “dog” and she sells for $1500 (or less) you have lost $500 at the outset. On the other hand, the scenario of using the top genomics young bull produces a heifer with significantly more sale value than the $2000 cost to raise her. Using high genomics, you again have the potential for savings on mastitis, feet, calving and health problems. With genomic testing of your heifers, you also have the choice of not raising an animal that is undesirable for your target market. Granted there is an added cost of $45 but you potentially save on rearing costs, have parentage verified and you have a head start, if the numbers are high, of attracting interest from the marketplace.

Can You Bank On It?

Depending on your scenario, the opportunity to benefit from investing more dollars in semen can vary. Let`s look at different scenarios.

If you are heavily into ET and IVF, avoid sexed semen as it appears to give poor results.  You are going to have to make your money back from using non-sexed semen from the top sires and merchandising some progeny from them to cover the added costs and more bull calves. (Read more – $10,000 a dose polled semen and $750 Dollar Semen! Are you crazy?)

If you are milking 500 cows, you can use both sexed semen and semen from top proven and genomics sires. Your challenge is that you will have to manage more breeding events but your rewards are that you do not need as large a heifer herd around for replacements and the ones you do have will be of a higher quality.

If you are working with robotics, you may feel that semen isn`t a big issue that you are more concerned with cows that work within your system. However, you have already got the savings on labour and you can invest some of those dollars back into raising the genetic level of your herd. This could be a new revenue stream to assist your bottom-line. (Read more: Robotic Milking: More than just automation it’s a new style of herd management)

Low Cost Semen Actually Costs More Money

If, over several years of breeding, you consistently choose your semen based on low cost, you are not only falling behind the genetic curve but you are also not solving the problems that your herd has.

The Bullvine Bottom Line

The bottom line is that if you really want to move forward in today’s dairy breeding business, you’re going to have to invest money in semen! Lose the death grip on your wallet.

When the sires you use meet your on-farm needs, semen is never too expensive!! 


The Dairy Breeders No BS Guide to Genomics


Not sure what all this hype about genomics is all about?

Want to learn what it is and what it means to your breeding program?

Download this free guide.


Robotic Milking: More than just automation it’s a new style of herd management.

Everyone agrees that dairy farming is hard work 24-7. Effective labour management is not only a financial cost but it also impacts herd health and production. The past decade has seen increased uptake and considerable improvements in robotic milking. This has been a direct outgrowth of concerns relating to finding, training and financing farm labour.

Robotic MilkingThe Bullvine had the opportunity to meet and interview four robot users. First is Francisco Rodriguez of Madison, Wisconsin who is a recognized authority on the use of robots and brings his experience as a veterinarian, breeder and Dairy Management Advisor Automatic Milking for DeLaval North America (Read more – Francisco Rodriguez – Passion with a purpose). We also talked to three Canadian breeders, Roger Wikkerink (Norwich, ON), Gerrit Wensink, (Innerkip ON) and Terry Howell (Jerseyville,ON).

These gentlemen generously shared their insights with The Bullvine.

WHY DID YOU CHOOSE ROBOTS?

The simplest answer, in each case, boiled down to “Robots are the right choice for labor efficiency”. Of course, there’s no such thing as a truly one size fits all simple answer and that’s where Francisco Rodriguez gives us a good method for determining if robots are right for your situation. He recommends this: “Ask yourself: ‘Why do I want to buy Robots? If the answer is “I want to be more efficient at managing my herd, while building a sustainable operation and working smarter rather than harder” then you will succeed. However, if the answer is ‘I don’t want to spend time in the barn, robots will help me to do everything’ then sell the cows and play golf, because you still you need to manage your business and work with your cows, whether you use robots or not.”

All three Ontario dairymen went to robots to address labour needs and to find more time to spend with family or to focus on crucial areas of the operation. Gerrit was competing for labour with Toyota and robotics allows his hired staff to have better hours and use their time more productively. For example there is now less time moving cattle and better hours. It took a minimum of three people for each milking (3x). As well, all four gentlemen felt that automated milking is where it is at and especially where it will be at in the future. They made the leap.

Terry Howell & family

Terry Howell & family

HOW DO ROBOTS WORK FOR YOU?

Francisco knows robotics from setup to output and is one of the best North American resources with experience in Colombia as well. He gives this overview. “Automatic milking a proven technology. After 20 years more than 1.2 million dairy cows are milked by robots globally. What makes the main difference from farm to farm is having a well designed barn managed by a knowledgeable proactive dairyman.” He urges anyone considering robotics to “Make sure you choose a layout that fits into your philosophies and management style. This is the key. The best layouts are simple and always expandable.”

Roger Wikkerink milks 70 cows and reports that he “likes cows and working with them”. In his setup, all the animals of all ages are under one roof and when someone is not there, he has cameras to monitor the barn. He set up his first robot ten years ago and used it for 8.5 years. For the past year and a half he has upgraded to the newest technology and reports that “There have been many improvements.”

Gerrit Wensink installed six robots four and half years ago, using three for fresh and three for pregnant cows. He sees his most important role as that of manager and feels that is the highest priority regardless of your milking system. He was challenge and has adapted to working with technology after facing labour that became too expensive in competition with nearby Toyota.

Terry Howell is the newest of our group to take up robotics and milks 60 cows and has one robot. Has 14 months experience under his belt and reports “ I had to do considerable thinking about how to do things better.” and, like the others, found that robotics provided the best opportunity for his situation.

Robotic Milking

ROBOTS RANK HIGH ON PERFORMANCE

Whether it is with 60 cows in Ontario or 1000+ cows in the US, robotics is meeting and surpassing the expectations of the farmers who have adopted the technology. As mentioned, Roger moved with enhancements and upgraded his robots and Terry is so pleased, at this point, that he has purchased more quota.

Francisco expands on what robots can mean to a dairy operation. “Robots are living up to expectations. They are reliable and becoming more reliable all the time. Robots gives (me) family time and mean not having to hire more labour. A robot milking 60-70 cows for one family plus young stock, gives the farm operator time to observe and manage and gives more time to work with fresh cows or animals that need attention. The breeder works as a manager not the labourer. Robotics is a great tool for business oriented farmers” is how he sums up the benefits.

From the cattle management point of view there are several observations. “Teat ends are much better, cows are not over milked – robot takes off when each teat is done.” Even the environment is changed. “It is quiet in the barn.” This peaceful setting now means that some routine events like bedding, vet checks, herd health, and hoof trimming, can represent enough of a disruption in cows’ milking schedules that they may drop in production at those times.” However all agree that the benefits of a more flexible personal schedule and the fact that they can get “more milk from less cows” are benefits that definitely weigh significantly on the positive side.

Robotic Milking

SIRE SELECTION FOR ROBOTIC MILKING

The area of specific selection for robotics is relatively new. For Roger Wikkerink it is not an issue and therefore has not changed his bull selection criteria. “I still require that bulls be +12 for Conformation. They must be positive for component percentages. Specifically I want to minimize to minimize use of Oman blood because they lack dairy strength and the median suspensary ligament is not as strong as I would like.” He details his selection. “I am using Goldwyn (still some semen) and his sons – Lauthority and Lavanguard then Dempsey, Fever, Sid, Damion and Windbrook. I have used Shottle but only later – none milking yet, … sires must have type and + components.” He adds, “I must like the pedigree of any sire I use. My preference is to use daughter proven sires.”

Gerrit Wessink reports his method. “Every proof run I sit down and look the bulls over. I pick out one main bull to use for the next four months. Besides ONE proven bull I also use 3-5 high genomic bulls for one proof time (4 months). If I need more variety I do it thru choosing more genomic bulls.” This spreads the risk. “I have been using Manifold – now have 70 milking daughters – and they are fantastic. They will not be the kind for the show ring but I reviewed them (yesterday) and they are significant plus for BCAF + BCAP (that’s what I like). ” Over and over the robotics users emphasize that you want to meet your individual goals with the system. Gerrit also has good news for those concerned about calving ease. “You can in one generation get calving easy into a herd. That is very necessary when staff are not always present in the barn.”

With experience in very large commercial herds, in and out of North America, Francisco looks feels character is a trait to consider. “Aggressive cows are a must since segregating cows in groups by lactation stage is not recommended and according to practical conditions small farms milking less than 60 cows-one robot will have limitations to house young and adult cows in different groups. If the cows don’t have the strength and willingness to compete, they won’t have the same opportunity to perform in a voluntary milking system like this.” He also points out the feet and legs are vital to getting the most from the robotic system. “If cows don’t have good mobility in a system where nobody is there to push them to the parlour, there is no way they will access the robot to get milked by their own.”

For Terry Howell sire selection is simplified in his management system. Knowing, for one example, that udders that are too deep or too shallow can both be a problem, he uses an AI mating program to select sires. In that program he can set the parameters he wants and the program will select sires according to cow his particular parameters.

Resources for Breeders

North American AI organizations are recommending sires to use in robotic herds. Robot Ready Sires from Semex is one example. DeLaval is developing a performance index. Francisco outlines what they are working toward. “Sires that work best in the system are identified. The Performance index measures how fast and easy the robot can attach the teat cups to a cow with an exclusive indicator relating to attachment. Cows over 100% are great for robots, below 99% means they are losing efficiency. Sometimes there are cows with very high milking speed but really poor attachment times and that makes them inefficient in a robotic system.” There are undoubtedly great developments ahead despite the ongoing challenge of the heritability of selecting for a total performance. It is still very low.

The Bullvine Bottom Line

All four gentlemen are excited about the potential of robotic milking and are very satisfied with the choice of going to robotics. Terry Howell is enthusiastic, “So much so that I have just bought more quota.” Gerritt, Wessink and Rodriguez emphasize how robotics allows them and their work force to focus on management.

Management, regardless of the system your dairy uses, is the modern day #1 priority. Robots allow this focus in a sustainable, effective and financially realistic way. They all foresee this as a growing trend in a dairy industry that is moving toward “smart and sustainable” dairy farm management.

MAN-O-MAN will he turn Platinum?

As we approach the next index release day, December 4, The Bullvine is hearing considerable speculation about Man O Man, the #2 GTPI daughter proven bull and the top GTPI bull with second crop daughters. Many expect that he will be the top total index daughter proven sire in many countries. What people differ on is will he merely exceed all others or whether he will significantly outdistance the field. The Bullvine decided to summarize some of the highlights and some of the facts as we know them today.

From L to R: GenerVations MOM Lola (VG-86 2yr), Gen-I-Beq MANOMAN Bibi (VG-85 2yr), Mapel Wood MAN OMAN Bambi (VG-85 2yr), Misty Springs MOM Santana (VG-85 2yr), Mapel Wood MAN O MAN Bombi (VG-85 2yr), Morsan MANOMAN Fools Gold Red (VG-85 2yr), Mapel Wood Man O Man Lucy (GP-84 2yr)

From L to R: GenerVations MOM Lola (VG-86 2yr), Gen-I-Beq MANOMAN Bibi (VG-85 2yr), Mapel Wood MAN OMAN Bambi (VG-85 2yr), Misty Springs MOM Santana (VG-85 2yr), Mapel Wood MAN O MAN Bombi (VG-85 2yr), Morsan MANOMAN Fools Gold Red (VG-85 2yr), Mapel Wood Man O Man Lucy (GP-84 2yr)

Man O Man died during his waiting period and so his semen was always in limited supply and therefore he was used primarily on high indexing females. Of course we all know that second crops proof for bulls whose semen is higher priced or in limited supply can often result in elevated values in a second country as the analysis can not totally remove the high merit of the mates nor any preferential treatment of daughters.  The fact remains Man O Man progeny are performing extremely well in many countries and his daughters are in demand.

Man O Man Sons

Man O Man does not have any daughter proven sons. Quite likely daughter proven sons will not be available for another 2.5 to 3 years.

Man O Man’s top ten sons in the USA for PA GTPI are:

  1. Amighetti Numero Uno – 2587
  2. Ladys-Manor Man-O-Shan – 2522
  3. Texel Beauty Cosmo – 2451
  4. Holbrick-ML Limocar – 2421
  5. GenerVations Lexor – 2420
  6. Cookiecutter MOM Hunter – 2409
  7. Cabon Fernand – 2407
  8. GenerVations Lingo – 2390
  9. Hood M-O-M Emmett – 2387
  10. Ladys-Manor-RD Shimone – 2387

A search of the CDN August 2012 Genomic Bull list shows that 18 of the top 50 bulls are Man O Man sons and their average indexes are:

  • GLPI +3038
  • Milk +1728 kgs
  • Fat +94 kgs (+0.28%)
  • Protein +81 kgs (+0.24%)
  • SCS 2.75
  • CONF +10
  • Herd Life 108 .
COOKIECUTTER MOM HUE VG-86-2YR-CAN

COOKIECUTTER MOM HUE VG-86-2YR-CAN

Daughters of Man O Man

Man O Man daughters do not take a back seat to his sons. Outstanding daughters can be found in every country and websites and magazine articles are full of these females.

The Bullvine studied his top ten DVG LPI daughters. Our thought is that by looking at their DVGs we would minimize any bias due to preferential mating or treatment. Their almost off-the-charts DGV averages are:

  • LPI +3437
  • Milk +1837 kgs
  • Fat +106 kgs ( +0.41%)
  • Protein +88 kgs (+0.27%)
  • SCS 2.75
  • CONF +12, MS +9, F/L +10, DS +9, R +7 ,
  • Daughter Fertility 102, and Herd Life 108
RALMA-RH MANOMAN BANJO VG-88-2YR-CAN

RALMA-RH MANOMAN BANJO VG-88-2YR-CAN
9th Jr. 2yr old RAWF 2012

Recent auction sales have seen Man O Man daughters in high demand. Those selling for over $50,000 in the fall 2012 sales are:

GEN-I-BEQ MANOMAN BIBI VG-85-2YR-CAN

GEN-I-BEQ MANOMAN BIBI VG-85-2YR-CAN

It is too late to start using Man O Man as his semen supply is nearly exhausted. However, most AI organizations have used him as a sire of sons or have sons from Man O Man daughters. Breeders who have already used him like their hard working trouble free Man O Man daughters that are above average for functional traits. They may show a bit of Oman’s rounder turn of rib and lack of style but they are significantly better that Oman’s for median suspensor and dairy quality. One profit oriented milk producer recently summed it up quite well for the Bullvine – “I could milk a whole herd with only Man O Man daughters in it”.

COMESTAR LAUTAMAI MAN O MAN VG-86-2YR-CAN

COMESTAR LAUTAMAI MAN O MAN VG-86-2YR-CAN

The Bullvine Bottomline

In less than a week’s time, we will know Man O Man’s updated American proof and his first official proof in some other countries. Breeder satisfaction and their decisions to continue to invest in his daughters speaks volumes for what we can expect to see.

From Fantasy to Reality – Top sires to address herd culling problems

In our recent article, Fact vs. Fantasy – A realistic approach to sire selection, we highlighted the need to choose sires not just on ideal conformation goals, but to also match your sire selection to the key management challenges your herd faces. In typical Bullvine style we wanted to take this one step further and to go from fantasy to reality and identify just what sires will help address these top culling issues.

The Bullvine’s Realistic Approach:  Breed to Minimize Your Profit Thieves

In the previous article, we recommended minimum sire proof levels for total index, female fertility, somatic cell score and feet & legs in both the US and Canadian genetic evaluation systems.  Since we only have access to DGVs from CDN, all values quoted in this article will be in Canadian terms.

Some considerations set for sires to qualify for consideration are worth repeating:

  1. A minimum LPI/TPI value (+2000) was set to address the problem of cows being culled for low   production;
  2. Sires had to be on an active marketing list of a North American AI organization; and
  3. Sires with only genomic evaluations had to have been born in 2011 or, in other words, they are in the initial stages of their sampling time.

Just a reminder of the minimum values The Bullvine set for bulls to be considered.

  • Lifetime Profit Index    > +2000
  • Daughter Fertility       > 100
  • Somatic Cell Score       < 2.90
  • Feet & Legs                 > +5

INFERTILITY: You can’t make milk if you can’t make calves

Breeders know that there is a difference in bulls’ daughters’ ability to become pregnant.  It’s probably one of the most important profit metrics on most herds. This is measured as Daughter Fertility in Canada and Daughter Pregnancy Rate in the USA.  This information has been available for some time, yet it still seems to be given little heed when sires are selected for use in A.I. and herds.

The Bullvine offers the following sires for use by herds wishing to genetically address infertility.

GENOMICALLY EVALUATED SIRES: ranked by DGV Daughter Fertility Index

  • 111      Ever-Green-View FONSY (Super x Shottle)
  • 110      Brant-View ALTAOTIS (Observer x Active)
  • 110      Latuch Trigger TREK (Trigger x Ramos)
  • 109      Rosylane-LLC JOSIAH (Jives x Ramos)
  • 109      Blue-Horizon ALATASUPLEX (Super x Planet)

DAUGHTER PROVEN SIRES: ranked by Daughter Fertility Index

  • 110      Badger-Bluff Fanny FREDDIE (Oman x Die-Hard)
  • 107      Synergy ALTAJENKINS (Mac x Shottle)
  • 107      Mainstream MANIFOLD (Oman x Marshall)
  • 107      Co-op Oman CAVANA (Oman x Hunter)
  • 106      Crackholm FEVER (Goldwyn x Blitz)

MASTITIS – a bane to producing high quality milk

No producer wants mastitis, the cost of loosing a valuable cows, or the possibility of having a tanker load of milk lost due to antibiotics in the load. Additionally milk producers don’t want their vet visit time consumed with mastitis problems. Can mastitis be lowered by using genetic evaluations?  “Yes!” claim many producers who know from experience that the daughters of bulls with an SCS over 3.10 are problems.  Sure, they may be fine in their first lactation but in later lactations they are usually more prone to mastitis.  The Bullvine offers the following sires for use in herds that wish to avoid mastitis, as much as possible:

GENOMICALLY EVALUATED SIRES: ranked by DGV SCS Index

  • 2.22     Coyne-Farms JACY (AltaIota x Massey)
  • 2.32     Welcome ADOLF (Shameless x Ramos)
  • 2.40     Oconnors BAROMETER (Garrett x Shottle)
  • 2.47     De-Su ALTAHALEY (Alta Meteor x Goldwyn)
  • 2.48     Stantons EVEREST (Observer x Shottle)

DAUGHTER PROVEN SIRES:  ranked by SCS Index

  • 2.45     Co-op Bosside MASSEY (Mascol x Bret)
  • 2.54     Lirr Drew DEMPSEY (Goldwyn x Derry)
  • 2.62     Coyne-Farms DORCY (Bolton x Bret)
  • 2.62     Coppertop DOBERMAN (Shottle x Granger)
  • 2.63     Crackholm FEVER (Goldwyn x Blitz)

Feet and Legs – Vital for High Performing Cows

The heritability of feet & legs is low (.20 to .25) but there are significant differences between sires in their ability to sire animals with functional feet and legs, especially feet. The costs mount up when you consider that cows with sore feet do not come in heat. And their feet must be trimmed more often. On top of that they require medication. In the end, there is milk withdrawal and definitely there is a loss of milk production. The Bullvine offers the following sires for use in herds that care about reducing their costs and losses due to feet and leg problems.

GENOMICALLY EVALUATED SIRES: ranked by their DGV Feet & Legs Index

  • +16 Blue-Horizon ALTASUPLEX (Super x Planet) Side View +7, Rear View +10, Foot Angle +7
  • +15 Ronelee Shottbolt DENZEL (Shottbolt x Outside) Rear View +12, Foot Angle +7.
  • +14 Seagull-Bay HEADLINER (Robust x Planet) Rear View +12, Foot Angle +10.
  • +14 De-Su RANSOM (Robust x Ramos) Foot Angle +10, Heel Depth +7. Bone Quality -1.
  • +13 Farnear –TBR- BH CASHMONEY (Observer x Goldwyn) Rear View +10.

DAUGHTER PROVEN SIRES: ranked by Feet & Leg Index

  • +16 Gen-I-Beq BRAWLER (Baxter x Shottle) – Foot Angle +12, Heel Depth +13.
  • +15 Crackholm FEVER (Goldwyn x Blitz) – Bone Quality +10, Rear View +11, Rear Set +13.
  • +14 Lirr Drew DEMPSEY (Goldwyn x Derry) – Foot Angle +11, Heel Depth +8, Rear View +9.
  • +14 DANILLO (Goldwyn x Oman) – Foot Angle +12, Rear View +13.
  • +12 Va-Early-Dawn SUDAN (Jammer x Sailor) – Foot Angle +8, Rear View +13. Rear legs straight.

THE BULLVINE BOTTOM LINE

The sires recommended here are genetically superior for reducing the nagging problems of fertility, mastitis and feet. At the same time, they are superior for their Lifetime Profit Index.  Bulls’ daughters that do not reach their potential due to any or all of these limiting factors are not needed on your farm or in the national herd. Choose the best sires that correct the actual problems that you face and thereby give you the opportunity to increase your profit per cow per year.  This method of selecting sires is not showy like winning in the show ring is but your bottom line on your year-end financial statement will be a larger number. Taking your goal of greater profits from fact to reality.

Looking for more mating recommendations and insights…click here.

FACT VS. FANTASY: A Realistic Approach to Sire Selection

How often do you select a mating sire for the reasons you typically cull animals, as opposed to what your perceived ideal cow looks like?  Further to our discussion about what the Perfect Holstein Cow looks like we here at the Bullvine started to ask ourselves, “How often do we choose our matings based on what we think the perfect cow looks like? vs. what our true management needs are?” Far too often sire selection is based on the fantasy of breeding that next great show cow or VG-89-2YR instead of facts needed to breed that low maintenance cow that will stay in your herd for many lactations and produce high quantities of milk.  Do your sire selections overlook your management needs?

Speedy Selection. Long-Lasting Problems

Discernment is the hardest part of sire selection.  Seeing your herd for what it is and what its genetic needs are is step one.  Step two is choosing what will work for you almost three years from now when the daughters of the sires you use today will be entering the milking string.  The old adage was “breed for type and feed for production.”  But how many breeding stock animals have you sold recently based solely on conformation?  How many will you be selling in three years based on their type?  What are the revenue sources for your farm now and in the future?  If your answer is “We get our revenue from the milk cheque from as few cows as possible and with as much profit per cow as possible” then selecting for type could mean that your sire selection is out of alignment with your management needs.

How Can You Tell If You Are You Out of Sync?

One place to determine where your herd has issues is to look at the reasons for and the frequency of culling. Every cow that leaves your herd for any reason other than a profitable sale is an indicator of the issues that could be arising from sire selection that is out of alignment with what is going on in your herd.

The Bullvine found the following information on milking age females that are removed from herds:

  • Over 35% of cows in a herd are replaced annually. That is costly!
  • The top known reasons for culling or removing cows are:
    • Infertility  / reproduction                    23.1%
    • Sold for dairy purposes                       21.4%
    • Mastitis                                               13.8%
    • Feet and Legs                                        9.6%
    • Low production                                     7.6%
    • Total    75.5%
  • The other known reasons for culling or removing cows are:
    • Injury               10.0%
    • Sickness           7.0%
    • Old Age           2.4%
    • Diseases          1.8%
    • Bad Temperament      0.9%
    • Difficult Calving          0.9%
    • Conformation 0.9%
    • Slow Milker                 0.6%
    • Total    24.5%

Are You Breeding to Spend Money or Are you Breeding to Make Money?

You may be comfortable with your culling rate especially if it isn’t too far off “normal”. However when you look closely at the cows that remain in your herd how “needy” are they?  Staff time, vet calls, hoof trimming, semen, drugs, supplies, extra time in the dry cow pen and removing cows from herds before they reach maturity – these all add up to significant dollars down the drain.  Therefore, anything that can be done in sire selection to minimize these costs goes right to improving the financial bottom line.  All unbudgeted costs mean less profit. If an animal is culled early, it does not matter where she placed at the local show or that her sire was a popular bull that left fancy udders.  If he also left poor feet and low fertility, that costs you money.

A More Realistic Approach: Breed for the Bottom Line Not Just the Top Number

Often top bulls for total index are put forward to breeders for their use, without regard for the bull’s limiting factors.  The Bullvine doesn’t support that approach.  We recommendation that minimum sire selection values be set for the reasons cows are culled so that sires used in a herd don’t create new problems while the breeder tries to solve the current ones.

Here are the Bullvine we recommend the following requirements bulls should meet to be considered for use by bottom line focused breeders:

  • In Canada
    • Lifetime Profit Index   > +2000*
    • Daughter Fertility          > 100
    • Somatic Cell Score         < 2.90
    • Feet & Legs                      > +5
  • In USA
    • Total Performance Index        > 2000*
    • Daughter Pregnancy Rate          > 1.0
    • Somatic Cell Score                    < 2.90
    • Feet & Legs Composite               > 1.0

* A high minimum value has been set for both LPI and TPI to address the removal of cows for low production and so animals sold for dairy purposes can be in demand for their milk producing ability.

THE BULLVINE BOTTOM LINE

Every dairy breeder wants a superior herd and wants to eliminate the daily annoyances, costs and loss of valuable cows due to infertility, mastitis and feet problems and low production. Breeders should choose the best sires that correct the actual problems that they face in their herd instead of chasing a fantasy that has nothing to do with their reality.

The Dairy Breeders No BS Guide to Genomics


Not sure what all this hype about genomics is all about?

Want to learn what it is and what it means to your breeding program?

Download this free guide.


Young Sire Sampling: Are we headed in the correct direction?

The Bullvine decided to take a closer look at the top (2012 August) 100 GLPI Canadian Holstein young bulls. To make it more informative the analysis is by groups of 25. It is important to recognize that the average reliability values for these genomically tested young bulls are between 64% and 69% almost as high as some new release bulls in the past. Behind us are the days when young bulls indexes were 33% to 37% reliable and posed a much greater risk due to low reliability.

Production – all breeders are also milk producers

Young Bulls Average Rating

GLPI GroupMilk (kgs)Fat (kgs)% FatProtein (kgs)% Protein
1 to 25+2303+96+0.10+86+0.11
26 to 50+2016+92+0.17+78+0.12
51 to 75+2012+84+0.09+74+0.09
76 to 100+1885+85+0.13+69+0.10
All+2054+89+0.13+77+0.10

The top 100 GLPI young bulls are truly an elite group with production index values compared to recently proven sires of 98%RK for milk, 99%RK for fat and 99% RK for protein yields. An interesting note is how the top twenty-five stand out ten percent above the others, while each group afterwards drops by about 5-6%. A much greater variation than all other traits.

Type – important to predicting durability

Young Bulls Average Rating

GLPI GroupCONF (overall)MammaryFeet & LegsDairy StrengthRump
1 to 25+11.5+11.1+8.4+6.5+5.7
26 to 50+9.9+9.2+6.9+5.1+5.8
51 to 75+11.6+10.7+8.8+6.8+6.0
75 to 100+10.6+10.1+8.1+6.0+6.8
All+10.9+10.3+8.1+6.0+6.0

On average the type indexes of these top 100 GLPI young bulls are very high. The equivalent to a 98%RK for CONF for the recently proven sires. Note that the 26 to 50 group have the lowest type trait indexes to go along with high fat and protein especially for % Fat and % protein. In many cases, the bulls in the 26 to 50 group are the full or half brothers to the 1 to 25 group, who may have gotten more components but are not as high for CONF and Mammary.

Functional Traits – important but they have lower heritability’s

Young Bulls Average Rating

GLPI GroupHerd LifeDaughter FertilitySCSAverage H&F contribution to DGV LPI
1 to 25110992.6757
26 to 501101002.7185
51 to 751101002.7388
76 to 1001111012.70124
All1101002.7089

The average Herd Life and SCS ratings for these bulls are very good, positively contributing to H&F augmenting the GLPI values. However it must be noted that the Daughter Fertility ratings are only average detracting from the overall GLPI values for these bulls. Daughter Fertility is a trait that is primarily affected by non-genetic factors, but has a significant impact on the bottom line of any operation. The breed needs to be concerned because daughter fertility is not likely to see any significant gain genetically by using these bulls. As we all know more pregnancies equals more profits. Definitely more attention and more research needs to be given to the genetic evaluations and genetic merit of the breed for Daughter Fertility.

GLPI – the combination of production, durability and health/fertility

Young Bulls Average Rating

GLPI Group GLPIDGV LPIPA LPISire DGV LPIDam DVG LPI
1 to 25+3218+3459+2784+3089+2599
26 to 50+2978+3127+2730+3191+2047
51 to 75+2900+3097+2592+2960+2052
76 to 100+2831+2960+2674+3056+2196
All+2982+3161+2674+3056+2196

These top 100 GLPI young bulls are truly outstanding! They are exceeding by 982 LPI points the value required for a recently proven sire to get a 99%RK for GLPI. This was not even dreamed possible before there were genomic analysis using SNIP technology. Note that the Parent Average LPI’s are lower than GLPI’s and DGV LPI’s and are very close to being the same for all four groupings. It is in fact the young bulls DGV’s that put them in the top 100. They have full and half siblings that have lower DGV’s.  This supports our previous analysis of 7 Reasons Why You Shouldn’t Use Genomic Sires With DGV’s Lower Than Their Parent Average.  The AI sire analysts have made very good use to the DGV’s after initially identifying bulls from their pedigrees, and then sampling those who’s DGV’s exceed their Parent Average LPI’s by a goodly amount. Think about it, the average of the top 100 young bulls at +2982  GLPI, and there is only one Canadian proven sire above that level. It should be noted that the dams/ DGV LPI’s for the first grouping far exceed the other three groupings.  Even if you factor in for a slight decrease in values, the top 25 would still all rank higher than the highest current proven sire.

Pedigrees – more similar than desired

Inbreeding is a concern that must be addressed as the top 100 GLPI young bulls are from a limited number of parents (Read more – Inbreeding: Does Genomics Affect The Balancing Act?).

Sires of Young Bulls

The five sires with the most sons are:

  • Oman Oman 28%
  • Snowman 20%
  • Planet 10%
  • Observer 10%
  • Freddie 7%
  • Other 25%

With Oman Oman, Snowman and Freddie all Oman sons inbreeding must be watched. 82% of the young bulls are sired by daughter proven bulls and 22% are sired by genomic young sires.

Dams of Young Bulls

The sires of the young bulls’ dams most prevalent on the list are:

  • Planet 25%
  • Shottle 23%
  • Goldwyn 18%
  • Bolton 13%
  • Baxter 7%
  • Other 14%

The dams with the most young bulls are:

  • Gen-I-Beq Shottle Bombi – 5
  • Comestar Goldwyn Lilac – 4
  • Sandy-Valley Planet Sapphire – 3
  • Marbri Baxter Brandy – 3
  • Sully Planet Manitoba – 3
  • Ten dams with two young bulls each
  • Sixty-two dams with one young bull each

Definitely there is more pedigree variability amongst the dams than the sires of these young bulls. All dams are milking cows. Five dams are below +2000 GLPI, 33 dams are below +2000 DGV LPI and 6 dams do not have DGV LPIs as they reside outside North America.

Owners

The bull owners for the top 100 GLPI young bulls are:

  • Semex – 64%
  • Alta Genetics – 10%
  • Genervations – 10%
  • Select Sires – 6%
  • CRI – 5%
  • Other – 5%

NAAB – top 100 USA GTPI young bulls

The Bullvine is not able to do as  extensive an analysis on the NAAB list as the DGV TPIs are not available for analysis. Below are the average ratings for the top 100 young bulls. Note this group is similar to the Canadian one hundred young bulls – again a significant concern is that fertility is not high.

  • Milk +1503 lbs.
  • Fat +71 lbs. +0.06%
  • Protein +55 lbs. +0.04%
  • PTAT +2.93
  • UDC +2.57
  • FLC +2.06
  • Productive Life +6.3
  • DPR 0.7
  • SCS 2.68
  • Net Merit +774
  • TPI +2395

The Bullvine Bottom Line

The use of genomic testing has provided  a very significant opportunity to increase the rate of genetic improvement in herds that use North American sampled Holstein bulls (read more – The Genomic Advancement Race – The Battle For Genetic Supremacy). The top 100 GLPI young Canadian bulls are the equivalent to over 99%RK for recently proven sires. Congratulations to the breeders and breeding companies for using the genomic results to produce the young bulls. Thank you to the breeders who use the top young bulls. A bright future is ahead.


The Dairy Breeders No BS Guide to Genomics


Not sure what all this hype about genomics is all about?

Want to learn what it is and what it means to your breeding program?

Download this free guide.


Which is Your Most Profitable Cow?

Early in my working career, working as a dairy cattle improvement specialist, I was invited to take part in a dairy producer education day with the theme of “Which is your most profitable cow?” That morning program had been organized by an Agriculture Agent in an area not far from my home farm. This effective educator had had a long career as a County Agent, specializing in farm bookkeeping and the use of records on the farm. His plan for the day was to have a variety of speakers who would bring varying points of view on cows that could make a profit. The day had over 150 people in attendance. He had done a good job of getting the crowd out. He wanted producers to go home with ideas on genetics, feeding, management and record keeping. I, personally, learned a great deal from the points of view shared by both the speakers and the crowd.

Is it the show kind?

The lead-off speaker was a well known showman who two years previously had purchased a tall, deep bodied, sharp chined, good uddered four year old cow with feet and legs that were not the best. He had worked with the cow to get her to walk just right in order for her not to show off her questionable feet and legs. He had done such a good job that the previous year she had been Grand Champion at the Royal, All Canadian and eventually her daughters would also do very well at Madison. Everyone in the crowd knew what he had paid for the cow, as she’d been purchased at a public auction. So the excellent showman and cow developer described how he would be able to sell sons of her to AI and daughters and granddaughters to foreign countries. That for him was his most profitable cow, yet for the vast majority in the crowd they could not personally identify with this showman. Buying cows in the rough and developing them was not in their expertise. The speaker did not get any questions.

Is it the balanced kind?

The next speaker was the sire analyst from a successful AI coop, who had recently been designated as an Official Judge and who would go on to be a very successful international dairy cattle judge. He spoke about bulls that can consistently sire daughters that can win in the show ring and at home can produce very good volumes of milk with a minimum of 3.8% butterfat. His speech mainly dealt with how a sire analyst uses his knowledge to search the breed office records before he goes on-farm to check out all members of the family of young sires already on the ground and that could pass health tests to enter into the young sire sampling program. Many in the crowd were interested in his presentation as dairy cattle breeders always want to know who the next hot bull is. However the producers present did not go away with any gems of knowledge on which would be the bull they should start using. Balancing strengths and limitations gives an average but not necessarily profit.

Is it the index kind?

At that time, nearly four decades ago, cow indexes for production traits had just been produced by genetic researchers and were starting to be used by some early adopters. So the third speaker was a recent college graduate whose family farm had decided to invest in two cow families that had placed cows at or near the top of the index list. This speaker, although not long in the tooth as a cattle breeder, was eager, entertaining and informative on what he had learned in buying into the cow families. He spoke of BLUP and the need to treat all cows in a herd in a like manner for accurate indexing. However few in the crowd comprehended the value or benefit of cow indexing or how that could be translated into cow profitability. From the questions asked of this speaker, it was obvious that there were more doubters than believers in the crowd. By the way, this speaker through sound business and breeding decisions and the use of ET has developed an excellent herd of high performing cows earning him a Master Breeder designation. But, on that day, his speech did not resonate with the crowd on what should be their most profitable cow.

Can you use a pencil to calculate?

I was the fourth speaker on the program. Newly out of graduate school where I had developed the “Dollar Difference Guide to Dairy Sire Selection” I was to speak about that new listing service. I focused my presentation on how to use the guide when selecting proven bulls to produce profitable cows. The formula was similar to the present day Net Merit index only it did not include traits beyond milk and fat. The Dollar Difference would eventually be replaced by the Canadian LPI system for ranking both males and females. I received many questions both in support and questioning how dairy cattle could be bred using just numbers and not the human eye. In fact the crowd all on their own debated the merits of selecting for yield only, selecting for the balanced Canadian kind or the merits of selecting only for the recently adopted Canadian Holstein true type model. To say the least I learned much that day about delivering a speech, about getting the crowd involved in the discussion and how to react as a speaker to both support and criticism. Yet, in the end, I likely did not help producers when they went home to breed profitable cows.

What works in the barn?

The final speaker was a quiet middle aged man, who dairy farmed locally with his wife. They milked thirty cows in an older tie stall barn, having taken over the farm when his father had been killed in a farm accident. They were raising a family of five very bright children, two of whom were already in university. They were devoted pupils of the county agent’s farm records and bookkeeping club. I had heard many in the crowd during the coffee break time question what this man could bring to the crowd as he seldom attended cattle shows, their children’s 4H calves were always at the bottom of the class, he did not attend breed meetings and they only owned a few purebred cows. He started his speech with an explanation of how people learn and then proceed to describe his most profitable cow. She always stood in the same stall at the far end of the barn. It had a steel plate as the floor over the stable cleaners. She was a purebred Holstein classified Good 76, milked ten percent below the herd average, gave milk of 5% butterfat, ate mainly the feed swept to her that the other cows did not eat, never kicked, was loved by his children, first calved at 24 months, conceived every time on first AI service, had never seen the vet, never had mastitis and was now 72 months old milking in her fifth lactation. Well the crowd, almost laughing, thought he was joking. He wasn`t! For him she was his most profitable cow. Obviously the county agent had selected him to speak because his views were different from what all of the breed, DHI and AI recommendations would be and from what the other speakers thought to be the most profitable cow.

Lesson learned?

At the end of the day, I spoke with many producers present and the buzz was about the final speaker. They remarked on how he had made the day beneficial for them because he had shared real life practical experience with them. His way of farming meant breeding cattle, raising a family and that cows were present on farms to bring financial returns to the farm and not just to look pretty. These were all points I heard mentioned by the crowd. Yes profit is in the eye of the beholder. Dairy cows exist to feed the world. And yes every cow does not fit every dairyman’s view of the most profitable cow.

The Bullvine Bottom Line

Every farmer and every farm has their own individual situation. One type of cow is not the most profitable for everyone. But it is important that every cattle breeder takes the time to decide which, for them personally, is the most profitable cow. And then it’s equally important that they take the next step and breed for that type of cow. Your reality is the source for your profit..

What has your experience been?  Please share in comments box below.


Not sure how much to spend on that great 2 year old?
Want to make sure you are investing your money wisely?
Download our Dairy Cow Investment Calculator.


Everything You Need To Know About TPI and LPI

How much do we really understand the TPITM and LPI system? Do we really know what they mean and what their limitations are? Earlier this week CDN General Manager Brian VanDoormaal posted an informative an interesting article, ‘Canadian Pride of the Canadian Kind!’, on the CDN website comparing and contrasting TPI™ and LPI, the national indexes for the USA and Canada. This got us here at the Bullvine thinking, maybe it’s time to revisit just what these indexes mean, why we have them and what their limitations are.

A New Tool was Needed

These indexes started in Canada and the USA for a number of reasons.  In 1984 Holstein Canada had adopted its breeding strategy whereby equal emphasis was to be placed on type and production yet almost two animal generations later breeders often continued to practice single trait selection – for show type, for conformation, for fat percent, for other traits. Marketers were all claiming to the #1 bull for this that or the other thing. In short the strategy was not being followed and the benefits of moving the population forward were not being achieved.

Setting the Standard for Continuous Improvement

TPI and LPI were introduced at relatively the same time and their primary achievement was to set a common base for breeders to rank their animals. Both indexes were first used over twenty years ago and have been continuously improved. Since starting as a way of combining type and production TPI™ and LPI have been enhanced by attaching economics to the traits.  This relates back to the breeders bottom line. The indexes have been adjusted to norms and standard deviations. For instance, milk yield is a big number and conformation is a single number, but their relative importance may be more closely related than the numbers alone would indicate.  Having said that, it was a good move to remove milk yield in favour of fat plus protein.  We don’t need to be shipping water or forcing cows to producing more and more low component milk.  Next conformation traits used in the indexes was limited over time to those of most economic importance on the farm. More recently the indexes have added health and fertility traits.

These are all worthwhile enhancements. Yes these indexes have been dynamic over the past two decades but have not been changed so frequently that they have lost the trust and support of the users

How to Use the Indexes

Today we make multiple uses of  TPI™ and LPI:

  • to select parents especially bulls to be used,
  • to market both males and females,
  • to follow the breed’s breeding strategy specifically indentifying the animals that best combine the traits and weightings in the strategy
  • used as culling tools within a herd or population primarily for proven bulls. Cows are most often culled for one or two economically limiting factors they have.

And the most important use of TPI™ and LPI

  • To rank animals based on the breeding strategy.

Moving the Population Forward!

It is the breeder’s and breeding companies that use the rankings to move their herd of the population forward. Since the traits in these indexes frequently have zero or negative correlations with each other, the indexes are a way to rank animals and come up with what is often referred to as ‘balanced breeding’. Animals with show type and production well below average or high production and low type, do little to improve herds or breeds.

Indexes Go Beyond the Numbers

Wouldn’t it be great, if you could just combine this LPI or TPI number with this trait you’re trying to improve and , “Voila!” you have the progeny that will improve your breeding program?  In 2012, when we are using, TPI™ and LPI we must be mindful that they include composite and predictive traits that are independent or negatively associated with each other. This means that the number in the index cannot be seen in the milk pail, in the eye of the breeder or in the bottom line of the farm. For instance a cow or bull with 3000 LPI – where do you see that number? It’s the combination of factors that is important. Simply stated, the indexes are a way of comparing the merits of animals.  The significance is in the comparison not in the number itself.

So what are the Results?

Since the adoption of both TPI™ and LPI, breeders and breeding companies have been able to significantly improve their herd and move the breeds forward according to the breeding strategies. The results can be seen in the udders in the barns and the volumes of fat and protein in the bulk tanks to name just three components of these indexes. Less obvious are the results for less heritable traits like feet and legs, SCS and the more recently added traits for female reproduction and longevity. Measuring the results of breeding is not easy or free of complication. Variables on each farm such as nutrition, housing, labour, management and environment can all impact the breeding results.

Annually CDN publishes the changes in many traits for the Canadian dairy cattle populations. These changes are estimates of the genetic gains made in the previous year. In 2012 the published changes for Holsteins include LPI +160, fat +3.4 kgs, protein +2.4 kgs. Conformation+1.05, Mammary System +0.93, Feet & Legs +0.81, Herd Life +0.50, SCS -0.03 and Daughter Fertility -0.27.  As you can see progress was not made for all traits. This happens because animals in the population are the result of breeder decisions and not the result of having a national breeding strategy. We do not have access to the results for the USA however we expect that they would mirror those in Canada.

Are There Limitations?

Yes there are two limitations.  First, as mentioned, TPI™ and LPI points cannot be seen by the human eye, measured in the bulk tank or on a farm’s financial statement. Secondly TPI™ and LPI function as if breeders are mating animals evenly rated for all components in the index. In actual fact, every bull and every cow has both strengths and limitations. Neither the absolute average nor the perfect animal in the population has ever been achieved. Each time a breeding decision is made, breeders must consider the attributes and limitations of both the male and the female in the population along with the objective of that particular mating and not just take the TPIs™ or LPIs of the parents, add them together and divide by two to get the resulting progeny!

The Bullvine Bottom Line

Even though TPI™ and LPI have limitations, they are beneficial tools to use in improving the genetics of North America’s dairy cows. There is no doubt that these indexes will be refined and improved in the future. The dairy cow of the future will be even better. Genetics does make a difference!

CATTLE BREEDING: If we don’t change we don’t grow

The Art of Livestock Breeding: It starts with a need

The breeding of domesticated livestock has long been considered to be an art practiced by food producers of the world. It is has definitely not been static. It started with observant farmers seeing an opportunity to improve the attributes of their stock. Initially this meant fixing the characteristics of their stock and establishing breeds. Breed purity was the primary focus which often meant coat colour in cattle or ability to pull heavy loads in horses; reproduction rates in pigs’, egg production volume in chickens; ability to find their way home in carrier pigeons and so on as the need or goal was established.

Dairy Cattle Breeding: The cream rises to the top

Over the centuries species and breeds have evolved. In cattle it meant animals that were developed for draught, meat and milk production. Milk has achieved special designation and has been recognized as nature’s most perfect food. Over time, there have been hundreds of attempts at developing breeds of cattle for their milk producing ability. That progressed to the point where there were only a few. Today Holstein and Jersey are the major survivors. These breeds were developed in temperate regions of Europe each with their own characteristics.

Advancement of North American Breeding: No decade stands still

Over the twentieth century dairy farmers in North America have molded their dairy cattle into what they are today by taking many steps. A brief and not all inclusive synopsis of some of those changes by decade are:

Early 1900’s Milk recording groups formed to authenticate volumes and milk quality
1920’s Type Classification programs started
1930’s With electricity came the start of machine milking, larger herds and the need for teats to point to ground and be close together
1940’s Artificial insemination, the painting of breed True Type pictures and the need for milk not to carry diseases humans could contact
1950’s Mechanization of field work resulted in farms specialization, improved forage quality, off farm processing of milk and sire daughter raw averages
1960’s Sire proving coops were formed, milk recording started to be used for more than just animal authentication purposes and farmer marketing coops were established
1970’s Greatly expanded numbers of young sires being sampled, BLUP analysis technique and genetic indexes for both bulls and cows
1980’s Significant changes in genetic indexing methodologies, breeds and breeding companies with specified breeding strategies, the practise of on-farm preventive medicine programs by veterinary practices and amalgamation of farmer coops for recording, breeding and milk marketing
1990’s Dairy cattle breeding adopted more finely tuned breeding formula’s (TPI, LPI and Net Merit), total mixed rations, on-farm least cost feeding, increased on-farm management practises including computer software programs, data analysis to better predict genetic merit, and in Canada governments , due to budgetary constraints removed themselves from the provision of milk recording and genetic indexing services
2000’s Greatly enhanced rates of genetic advancement, capture of data for auxiliary and functional traits, refinements in breeding strategies to consider more than milk and conformation, routine use computerized farm management for both production and economics, greatly expanded herd sizes,management took on greater importance on all farms and researchers started to consider if the DNA make-up of an animal could be used for genetic advancement

Finding a New Path: Adding Genomics

Very definitely the move about five years ago by a few AI companies and the USDA to compare the DNA snips results with the genetic evaluations for dairy bulls proven in the USA and Canada was significant. However the decision not only to study but to make the results openly available to breeders was a gigantic step. Breeders could know the genomic results for bulls and cows. This meant that breeders were central to the genetic future of their animals and their industry. Compare that to the swine and poultry industries where relatively few breeding companies own the genetics of the world. Now in 2012 all dairy cattle breeding regions of the world are using, or are about to use, genomics to evaluate their animals’ genetic composition.

The Bullvine Bottom Line

I have always noticed that people who make a difference are the ones who, not only don’t resist change, but welcome it. It is important that producers through their breed societies and breeding coops continue to have open minds and collectively research and develop the genetics of their dairy cattle. If breeders are to govern their destinies, they need to make sure that their elected and organization officials are objective and dynamic in how they approach changes to cattle breeding such as genomics. Many changes are yet to be thought of. We always need to remember that, “When you are through changing, you are through.”

A Closer Look at the August 2012 New Release Sires

With many new sires coming out in this week’s proof round, we here at The Bullvine figured we should take a closer look. The following is our analysis of the top new TPITM and LPI sires.

GEN-I-BEQ BRAWLER #2 LPI +2638

0200HO05929 Gen-I-Beq Brawler (Baxter x Shottle)

GEN-I-BEQ BRAWLER BLANCHE VG-86-2YR

Owner/Distributor Semex

Daughter Strengths

  • Fat Yield
  • Protein Yield
  • Conformation
  • Feet & Legs

Protect for

  • Straight Rear Legs (Side View)
  • Height at Front End

Sire Stack Baxter x Shottle x Champion x Storm x Grand

Dam: GEN-I-BEQ SHOTTLE BARBI VG88(5yr) 4* 1 Superior Lactation tracing back to Baler Twine 32* / Gypsy Grand 37*

Siblings

Best used on typical daughters of:
Man-O-Man, Snowman, Planet, AltaEsquire, AltaIota, Garrett, Bolton

Comments
Boris is the latest sire from the family to be designated as ‘Extra’ with third dam Baler Twine having three Extra Sons, including Goldwyn and Topside now #4 LPI sire, and fourth dam Gypsy Grand having five Extra sons. In the future more awards can be expected from his dam Barbi’s progeny. Barbi is a full sister to Shottle Bombi Ex 92 with many sons with high DGV’s and awaiting proofs. His progeny proofs closely match his DGV except for a slightly lower rating on his progeny for Health & Fertility for which he still has a positive rating. His highest rated milking daughter is Gen-I-Beq Brawler Fee from a Goldwyn from Lila Z. She has a DGV LPI + 2689. Brawler was a high genomics young sire and already has 2321 registered daughters.


COYNE-FARMS DORCY ET – #3 TPITM +2266

Owner / Distributor – ABS

Daughter Strengths

  • Udder Composite
  • Feet & Legs Composite
  • Productive Life
  • SCS

Protect for

  • Calving Ease
  • Straight Rear Legs (Side View)

Sire Stack – Bolton x Bret x Rudolph x Merrill x Darby

Dam: COYNE-FARMS BRET DAFFERS ET Ex91 (5yr) DOM 3-01 (305D) 14,034kgs 4.4F 3.3P

Siblings

  • Sisters
    • COYNE-FARMS PLANET DALIA-ET VG-85 GTPI+2282 +736NM$ PTAT+2.54
    • COYNE-FARMS BOLTON DARLA-ET VG-87 GTPI+2130 +535NM$ PTAT+2.12
    • COYNE-FARMS PLANET DACIA-ET VG-85 GTPI+2080 +552NM$ PTAT+2.33
    • COYNE-FARMS BOLT DIEDRA-ET VG-87 GTPI+2050 +467NM$ PTAT+2.71
    • COYNE-FARMS JET S DABBLE-ET VG-85 GTPI+1999 +455NM$ PTAT+1.92
    • COYNE-FARMS BOLTON DANAE-ET VG-88 GTPI+1936 +363NM$ PTAT+2.54
    • COYNE-FARMS COLBY DAHLIA-ET VG-85 GTPI+1900 +370NM$ PTAT+2.29
  • Brothers

Best used on typical daughters of:
Man-O-Man, AltaEsquire, AltaIota, Dempsey, Lauthority, Goldwyn

Comments
Dorcy was a high genomics (DGV LPI +2726) young sire with high ratings for Production, Durability and Health & Fertility. He has good ratings for all functional traits except for calving ease. Breeders interested in a Bolton son from an outcross pedigree, top notch udders, very good feet & legs and functional traits may consider Dorcy. Dairy Strength and Rump are only slightly above breed norms.

OCONNORS JAY #6 LPI +2305

Owner/Distributor Semex

Daughter Strengths

  • Fat Yield
  • Protein Yield
  • Component %’s
  • Conformation
  • Mammary

Protect for

  • Daughter Fertility
  • Milking Speed
  • Calving Ability

Sire Stack Bolton x Durham x Marvellous x Benchmark x Spipper

Dam: BROAD-VUE DURHAM JACOBEE EX-CAN 6* 2 Superior Lactations

Siblings

Best used on typical daughters of:

Man-O-Man, Snowman, Planet, AltaEsquire, AltaIota, Shottle, Fever, Lauthority, Baxter

Comments
Jay is a result of the popular Bolton x Durham cross. Although not from a well known cow family, Jay’s dam achieved a 6 Star Brood Cow rating. Jay’s Extra award and high conformation and mammary system ratings are definitely a result of him having seven GP84 (2yr), ten GP83 (2yr) and fourteen GP82 (2yr) daughters from his first ninety classified daughters. Breeders should note that Jay’s rating for Health & Fertility are below average but they are above his DGV’s for functional traits. This means his daughters have outperformed expectations.

WABASH-WAY EXPLODE #9 TPITM +2184

Owner/Distributor Taurus Service

Daughter Strengths

  • PTAT
  • Udder Composite
  • Body Composite
  • Milk Yield

Protect for

  • Fat %
  • Daughter Fertility

Sire Stack Bolton x Shottle x Oman x Mtoto x Rudolph

Dam: WABASH-WAY EMILYANN VG-88-2YR-USA DOM 1* from the Lead Mae family

Siblings

Best used on typical daughters of:
Man-O-Man, AltaEsquire, Logan, AltaIota, Fever, Dempsey, Lauthority, Goldwyn

Comments
Explode is the first son to be proven from Emilyann and is a strong candidate for Gold Medal. His sire stack is very strong for production, durability and breeder respect. Explode was used extensively as a young sire having high DGV’s, especially for milk yield, conformation and herd life. Breeders can expect Explode to excel for overall conformation, mammary, feet & legs, dairy strength and rump. In fact only fat % and daughter fertility are rated below the breed norms.

MORSAN BORIS #10 LPI +2171

Owner/Distributor Semex

Daughter strengths

  • Fat Yield
  • Protein Yield
  • Conformation
  • Feet & Legs

Protect for

  • Milk Yield
  • Straight Rear Legs (Side View)
  • Daughter Calving Ability
  • Dairy Strength

Sire Stack Bolton x Durham x Airliner x Leadman x Chief Mark

Dam: OCEAN-VIEW DURHAM DORIS EX-94-CAN VG-87-2YR-USA 10* from the Dellia’s

Siblings

Best used on typical daughters of:
Man-O-Man, AltaEsquire, Logan, AltaIota, Manifold, Twist, Shottle, Fever, Sudan, Dempsey, Lauthority, Goldwyn

Comments
Boris’ dam has a double shot of Regancrest breeding through Dellia and her son Durham. His dam and two Dundee sisters have been show winners in Western Canada and Ontario. Breeders interested in using the Dellia bloodline will find Boris combines the Dellias with Bolton, a bull starting to show his ability to sire superior bulls and cows. Boris’ proof ratings closely follow his DGV’s except for Health & Fertility. Daughter Fertility is the trait where Boris daughters underperform what had been predicted by both his PA’s and DGV’s . His top daughter is Clearsky Boris 1501 with LPI + 2382.

For more information check out our Genetic Evaluation Resource Center.

Are You Going To Make a Profit This Year?

Every day during this summer of 2012 dairy breeders are reading about or personally experiencing the challenges of feeding their dairy herd.  The articles in the press deal with the cost of corn and soybeans as well as the quantity and quality for forages preserved or available for purchase.  Since the cost of feed to produce a pound or kilogram of milk is usually 55 to 60% of the cost of production, feeding the dairy herd is extremely important.

In a recent article the Bullvine addressed key factors that contribute to profit on farm ( read Why Dairy Farmers Need To Know Their Key Performance Indicators).  However, for many dedicated North American dairy cattle farmers the immediate challenge is to implement steps that will contribute to or assist with profitability until we have another crop-growing season.  The following ideas are offered based on the results I saw from working with success farms participating in dairy farm management clubs.

A Check List for Managing

  1. Know your facts
    A saying often herd is “If you don’t measure, you can’t manage.”  So taking time to review the details on your last milk cheque, your current feed bills, your daily feed fed and the information for the past two years from your DHI printouts or from your farm management software reports, all are key to getting started.  Also critical to taking positive steps is the farm manager’s attitude to problem solving on farm.  Yes prices received and prices paid are important but most frequently they are mainly outside individual manager’s control.
  2. Output per Cow
    Simply put farms producing over 5 pounds or 2.3 kgs of fat plus protein per cow per day return between 25 to 40% more profit per cow per day than farms producing 4 pounds or 1.8 kgs per cow per day.  Filling the bulk tank with 100 cows producing 55 pounds (25 kgs) or 79 cows producing 70 pounds (32 kgs) is what this equates to.  Those extra 21 mouths to feed are paramount to profit.  Moving the lower producing cows to dry pens, selling below average producers for meat or buying of bringing in, take care to protect biosecurity (read more Biosecurity – How Safe Is Your Dairy or Biosecurity: Control What’s Coming In, Going Out Or Going Around), animal about to calve or recently fresh are all steps that will move the herd to more profit per milking cow per day.
  3. Dry Matter Intake (DMI)
    Average DMI of at least 50 pounds (23 kgs) of feed are achievable.  Herds with DMI’s over 55 pounds (25 kgs) make 15 to 25% more profit per cow per day than herds with a DMI of less than 44 pounds (20 kgs).  However, feed intake averages and profit per cow per day are not achieved by feeding the average cow.  Keys to achieving desired levels of DMI and profit are caring and grouping of cows and heifers three weeks before and after calving, feeding the highest quality forage to the cows producing the most milk and not overfeeding cows later in lactation in any year not just when feeds are in short supply or high in price.
  4. Feed Quality
    Without feed testing or knowing the quality of feeds, be it home grown or purchased feeds, decisions and corrective actions cannot be taken.  Managing for profit and using feed resources wisely depend knowing the products you are working with.
  5. The Heifer Herd
    Managing for profit is greatly influenced by how the heifer herd is feed and managed.  Not raising all heifer calves, feeding heifers according to their needs (high quality feed to heifers in their first three months), using milk replacer instead of keeping extra cows so calves can get be feed whole milk and breeding heifers to calve by 24 months of age all need re-consideration in times of tight feed supply, lower quality feeds, and expensive feedstuffs.  Having 0.7 or 1.1 heifers per milking cow can significantly affect profit through feed cost, labour costs and overhead costs. (read 10 Ways Cool Calves Beat The Heat)
  6. Manage Reproduction
    In times of high costs, lack of plentiful feed supply and pressure on the time to manage, managers take steps (often inadvertently) not to check as often for heats or eliminate regular visits by the herd reproduction specialists.  Current estimates run between $75 to $110 for every heat that a cow or heifer is either not bred on or does not conceive on.  Of course that cost is a function of taking more feed, more labour, more animals on-farm and more time to manage.
  7. The Basics are Important
    We all know how nice it is to have fresh air to breathe, our climate controlled and a fresh glass of clean water.  Well animals are no different.  Clean waterers, lack of manure build-up near animals and clean air all lead to high performance by dairy cattle.  Documented and delivered herd protocols are important and can be neglected in times of stress including when feedstuffs are in short supply.

The Bullvine Bottom Line

Success in business very often is associated with managing to be ahead of challenges rather than in reaction to circumstances.  Profits on dairy farms depend on providing the crucial trinity, feed, environment and genetics.  Doing only two of the three is not sufficient.

BIOSECURITY: Control What’s Coming In, Going Out or Going Around

Although the specifics of a Biosecurity Program will differ from farm to farm, the overriding concern is to keep everything as free of germs as possible and to limit contact between animals. One of the greatest threats of disease to a dairy cow or calf is from other cattle, whether through surfaces, equipment, insects or people contaminated by diseased animals. A disease outbreak in any herd can be financially devastating to the operation.  There are many items to be considered so The Bullvine has looked at what comes in, what goes around and what goes out and has put together three checklists for your consideration.

What’s Coming In?

  • Limit the number of new additions to the dairy herd.
  • As thoroughly as you check out new animals, check out the sources you buy from.
  • One of the best ways to control mycoplasma is to avoid buying cattle from known positive tested herds.
  • Pest and Animals control. Employ rodent and other pest control measures.
  • Prevent birds, rodents, pets and other animals from coming into contact with the herd.
  • Make sure all suppliers and other farm visitors follow your biosecurity measures
  • Avoid borrowing equipment and vehicles from other farms.
  • Lock the doors to the barn.
  • Post a warning sign asking visitors to keep out. Leave a telephone number to call.
  • Limit access to the dairy facilities from outside visitors.
  • Limit access to the dairy herd from outside visitors.

Sign Them In – Write them Up

  • Maintain a log book of all visitors — date, time and origin.
  • Maintain records of the movement of animals and equipment coming in, on and off the premises.
  • Strictly control contact with newly arriving cattle (human and animal traffic, feeding, manure, etc.)

Keep Them Clean

  • Provide clean coveralls and boots for all visitors.
  • Require all visitors to wear clean boots, clothing and gloves.

Test Everything

  • Obtain serum on arrival and test for risk adverse diseases.
  • Maintain banked serum from new arrivals.
  • Test every new lot of hay or load of feed.
  • Test feedstuffs for microbial content, including molds, aflatoxin and salmonella.
  • Although salmonella most often enters a dairy through contaminated feed, new/replacement animals should also be tested for salmonella.
  • All new cattle should also be tested for the presence of mycoplasma.
  • In addition, sample the bulk tank at least monthly and preferably bi-weekly for problem organisms
  • Embryo transfer recipients can be a source on infectious disease, test appropriately.
  • Test all calves from purchased cattle for persistent infection with BVDV.
  • Require hoof trimmers to sanitize their chutes, tables, knives, and other equipment.

What’s going Around?

  • Identification
    • Identify all animals with proper ear tags for traceability.
    • Establish a functional record-keeping system.
  • Isolation:
    • Use proper quarantining of returning animals (from shows, sales, other farms etc.)
    • Isolate sick animals from the rest of the herd.
    • Isolate any new animals or animals returning to the herd.
    • Separate cattle by age or production groups.
    • Use a separate enclosure for isolating animals.
    • Be aware that multiple livestock species can share and transmit diseases.
  • Sanitation:
    • Routinely clean and disinfect buildings, barns, equipment, clothing and footwear.
    • Buildings should be thoroughly cleaned of all organic debris and pressure-washed using approved disinfectants.
    • Spray all surfaces with a commercial-grade disinfectant.
    • After each calving, all bedding, cleansings and discharges should be removed and cleaning and disinfection procedures should be repeated. That includes all buckets, tools, vehicles and utensils.
    • Never use moldy or dusty bedding.
  • Vaccination:
    • Develop a strategic vaccination program with your herd veterinarian.
    • Vaccinate cattle against certain diseases.
    • Vaccinate on arrival with standard herd protocol and re-vaccinate (booster) in 3-4 weeks prior to leaving quarantine facilities.
    • It’s also vital that producers follow label directions for the vaccinations and medications they use.
    • Immediately report any signs of illness to your veterinarian or the nearest CFIA office.
  • Ventilation
    • Check buildings for good, draft-free ventilation. One way to do this is to use the smoke-bucket technique–you burn some straw in a metal bucket and observe how the smoke escapes the building.
    • Don’t overstock areas.
  • Transportation
    • Maintain records of the movement of animals leaving the farm.
    • Maintain records of the movement of equipment leaving the farm.
  • Implementation
    • Monitor herd health daily.
    • Employ veterinary services to help implement herd health programs.
    • Train all staff in the application of your biosecurity program.
    • Regularly monitor the effectiveness of the program.
    • Be aware of any diseases in your area and just your Biosecurity Program to meet specific needs, as required.

What’s going Out?

  • The goal is to prevent mixing of age groups.
  • Promptly dispose of dead animals. Implement a manure management program.
  • Calving should occur in a designated building away from the rest of the herd.
  • Utilize individual calf hutches for newborn calves. Thoroughly disinfect between uses.
  • Designate a cleaning area for vehicles and equipment.
  •  Isolate sick and diseased cattle with unusual clinical signs or cattle that do not respond to customary treatments.
  •  Have a veterinarian necropsy (autopsy) any animal that dies from undetermined causes and dispose of dead animals promptly.

Removal

  • If the target organism(s) is detected, the options for maintaining biosecurity will depend on the number of animals that are infected. If only a few cows are infected, these can be removed from the herd.

Quarantine

  • Implement strict quarantine procedures.
  • When selling cull cows and bull calves, identify a location outside of the barn for cattle buyers to pick up these animals without entering the barn.

Traffic control

  • Don’t share (on feet or clothing or tools or equipment)  pathogens from your farm with others
  • Exhibiting cattle at fairs presents a risk of disease transmission (a lower risk than others).
  • Food safety is also a vital part of biosecurity, Salmonella-contaminated milk or other products that may leave the farm are a still a very real threat to food safety.

Eliminate

  • Reduce manure contamination of water sources, bunks, feeds and feeding equipment.
  • Keep cattle out of mud, streams and farm ponds.  Water and mud are havens for coliform bacteria and organisms like Pseudomonas aeruginosa that can cause mastitis.
  • Keeping cattle out of streams not only protects animals on the farm, it also reduces the possibility of contaminating animals downstream—or spreading organisms to other animals such as fish.
  • Controlling manure runoff and following proper waste management guidelines makes for healthier soils and animals.

THE BULLVINE BOTTOM LINE

A disease outbreak in any herd can be financially devastating to the operation. Take the time to make sure you know what is coming in, going around and going out. Protect your farm.  Protect your future.

BIOSECURITY – How Safe is Your Dairy?

As I got out of my vehicle and walked into the cow barn at my friend’s dairy farm last week, I asked myself, “Does he know where my shoes and clothes have been since I left home this morning?”  It’s all too easy for me to hop in the truck at my farm and, in the same clothes and shoes that I’ve been working in, pop over to his place.  Does he care where I’ve been walking? It also seems that the TMR mixer repairman or the milking equipment dealer can also walk anywhere in his barn without him showing concern. I do know that his AI Tech and Vet both take care to wash their footwear on both entry and exit from his farm. However, both those individuals know the cost of disease and carrying contamination between farms.

The Balance Between, “Hi! We’re Open for Business!” and “PRIVATE! Keep Out!”

Two months ago I visited a broiler farm being run by the children of my college classmate. There was a sign at the entry gate to the farm informing all visitors that they were to check at the farm office at the back of the house before proceeding further along the farm lane. At the office, I was served coffee and a sweet but at no time was there any consideration of allowing me anywhere near the exterior door to the poultry barn. Repairmen coming on that farm are given orders to put on completely clean shoes and clothes. I know for sure that the feed delivery truck must have its wheels hosed off before entering and after exiting that farm. These consistent rules are friendly but secure at the same time.

FACT: Dairy producers remain behind their counterparts in the pork and poultry industries on this front called biosecurity.

So why the difference?

The differences probably arise from tradition. Dairy cattle breeders like to see cows in the flesh and welcome opportunities to view the four-legged results of their labours. Poultry producers talk in terms of net return per kg of quota and are focused on producing a healthy product. They are well aware of the devastation that even a minor outbreak of disease can do to ruin the profit potential. Beyond the health of their flock, they also have the desire to guarantee the consumer the safe and biosecure product they demand. If you are thinking that we in the dairy industry do not need to worry about that, then think again. In time, and likely not a long time, it will be a global standard.

Taking absence of disease for granted

In temperate climates, where there is freezing during the winter, endemic zooenotic diseases are far less common than in tropical climates. This quickly became evident to me when I was consulting in the Middle East and witnessed firsthand that our dairy cattle had to be kept in eight foot high walled cow lots so that the native animals did not share their multitude of diseases. The end result from these precautions is that the producers in those countries profit from selling a safe, high quality product.

 What you don’t know CAN hurt you

In truth dairy farmers often are not aware of the incidence or level of a disease on their farms. As well they frequently do not know the cost associated with diseases. A good example is fact that many producers do not see the need to register in state or provincial Johnes eradication programs.  It is reassuring to see the leadership state, provincial, university and industry officials are providing in developing programs to eliminate positive animals. However, are we being too complacent in buying in? At the end of the day do we want to ask ourselves, “Is it comfortable to produce a product that we know we cannot guarantee as being safe and secure from disease contamination? “ Of course, the answer is, “No!”

What’s Ahead

Just last year I had a discussion with Canada’s Chief Veterinary Officer about what happens on the farms of Canada’s trading partners when it comes to biosecurity and what those countries are likely to require to happen in Canada, if they are to sign  trade agreements with us in the future. He spoke in terms of setting in place systems to monitor on-farm biosecurity which would be joint government and industry initiatives. Additionally he spoke about the need to fast track systems of recording, monitoring and guaranteeing healthy food products in Canada.

The Bullvine Bottom Line

Producing nature’s most perfect food does not only involve the production but also the obligation that the product is guaranteed free of any contamination. We all need to get behind the efforts needed at the farm and industry level to guarantee biosecurity. It is part of the future success of dairy farming.

GENOMIC HEIFERS: Understanding who is on top

Adding genomics to genetic evaluations brings more attention to young heifers. There is increased accuracy to heifer indexes and new population benchmarks.  Even more significant are the Direct Genetic Values (DGVs) that are generated from the DNA results.  As you will see, the the very top heifers increase their genetic indexes significantly, while their full sisters, without high DGVs are not on the list. The DGV value makes the difference.

The Bullvine continually receives the question, “Why are the top heifers at the top?” In order to assist the industry to better know how high is great, the Bullvine has done an analysis of the top 25 Canadian Holstein heifers published in April 2012 by Canadian Dairy Network.

What do the average for the Top 25 look like?

[csv2table source=”https://www.thebullvine.com/wp-content/uploads/2012/07/genomic-heifers.csv” icons=”false”]

This is a truly exceptional group. What other Top 25 female list would be able to boast of an average value of 192 kg. for fat plus protein and 13 for conformation on their Parent Average Genetic Indexes? And look at their DGVs. They are even higher at 203 kgs. for fat plus protein and 13.8 for conformation.

Digging Deeper

Average numbers are a good place to start, but there are additional facts that can assist us in understanding the Top 25.

  • 21 were less than 1 year of age and 4 were over 12 months of age. Obviously, the heifers on this list are young.
  • The prominent cow families represented on this list are: Lila Z (24%); Lead Mae (24%); Gypsy Grand (16%) and Laurie Sheik (8%).
  • The heifers’ sires are 48% daughter proven bulls and 52% genomic young sires.
  • The heifers’ dams are 40% with performance of their own and 60% with PA GLPIs only.
  • 96% of the heifers have DGVs higher than their PA GLPI.
  • The most significant fact is that the top 25 heifers on average have DGVs 228 LPI points higher than their PA GLPI. They are what are commonly referred to as high outliers. Most of these heifers have full sisters who are not as high for DGV. Previously, they would have been considered equals.

In future articles, The Bullvine will be bringing forward ideas on the genetic needs of dairy cattle and strategies to use in selecting and breeding.

THE BULLVINE BOTTOM LINE

When deciding to invest in a high genomics heifer, it is important to study both the heifer’s PA GLPI and her DGV. Although 25 may be too small a group to depend on for everything. Nevertheless from this small snapshot we get a clearer picture of the potential that genomics and DGVs provide.  The Bullvine is excited to provide this perspective on an ongoing basis.
The Dairy Breeders No BS Guide to Genomics


Not sure what all this hype about genomics is all about?

Want to learn what it is and what it means to your breeding program?

Download this free guide.


GENOMICS: Big Dollar Opportunities are Adding Up

Is the glass half-full or half empty?  The comment is often heard that genomics has yet to prove itself.   When index breeding for production traits came on the scene forty years ago, it too was seen as the new kid on the block.  In response,  The Bullvine has decided to compile a list of points could be considered significant dollar opportunities  Please note that these dollar values are derived from the Canadian situation but the general principles can be applied elsewhere.

Sample Only the Best Young Sires

Eliminating the need to sample the bottom 60% of 550 young sires (all breeds) will save the Canadian industry $16.5 M per year.  Add to that, eliminating the loss that producers bear when they must cull daughters of low genetic merit young sires and it is over $20M in savings by genomically testing all young sires and only sampling the top sires.

Turning Generations

Generation interval is extremely important in determining the rate of genetic advancement in a population of food producing livestock.  Shortening the generation interval, by using genomics to more accurately identify the top heifers and young bulls, will decrease the generation interval by one year, when 30% of the population is bred to young genomically tested young sires. That will increase the rate of genetic advancement by 25% per year.  However the rate of usage of genomically tested young sires is fast approaching 50% which equates to a reduction in generation interval of two years. This results in a 60% gain in genetic advancement.  Research has shown that that 60% gain is worth $30M annually for the traits that are currently included in the LPI formula.

Increased Accuracy

When considering the accuracy, with which we know the breeding values of the animal in a population, there are many points to consider:

  • Conducting a low density panel test on all heifer calves in a population of cows has a cost. It also has the benefit of having a totally accurate herdbook, no wrong assignments of parents and these help in genetic evaluations.
  • Knowing the genomic values for all females means that those genetic merit females can be used as recipients or can be fattened and sold for meat.

Identifying the elite females in a population greatly enhances the rewards that can be reaped from using only the best as dams of the next generation. Putting a dollar value on increased accuracy on the female side of a population is not easy to do but by The Bullvine’s calculation it would yield $20M per year in net terms for Canada’s dairy farmers.

Beyond Canada there are great populations of dairy cattle that contribute to the advancement of the genetic merit of dairy cattle everywhere.  Knowing the genomic values of these animals will greatly help North America advance their populations, especially for breeds with numerically smaller numbers.

Traits under Selection

As The Bullvine has reported (read Is Your Breeding Strategy a Field of Dreams) selecting for traits beyond milk, fat, protein, SCC and conformation will become possible with the use of genomics.  Already The Bullvine has learned from our followers that they look forward to knowing in genetic terms details for feed efficiency, production limiting disease resistance, calf health and liveability, reproduction traits and more.  Putting an industry dollar value on knowing the growth of those additional traits is not possible at this time.  But it will be quite a significant number.

Inbreeding

This article will not spend time addressing inbreeding as it has been addressed previously in The Bullvine (read Inbreeding: Does Genomics Affect The Balancing Act).  Suffice to say at this time inbreeding can be handled when selection uses genomic values.  Not previously mentioned by the Bullvine on inbreeding is the fact that in dairy cattle populations beyond Holsteins there is considerable benefit to using genomics to select semen and embryos from outside a country’s borders.

The Bullvine Bottom Line

So far in this article, The Bullvine has been able to identify over $70M to $100M in annual benefit to Canadian dairy breeders alone from the use of genomics.  That means $10,000 annually for each and every breeder.  So is the glass half full or half empty when it comes to using genomics? How do you see it?
The Dairy Breeders No BS Guide to Genomics


Not sure what all this hype about genomics is all about?

Want to learn what it is and what it means to your breeding program?

Download this free guide.


Plugin by Social Author Bio

Send this to a friend