June Class and Component prices were announced on July 5. With one exception, prices saw very little change from the prior month. The 52% increase in the price of other solids dominates Chart I. Other changes were minimal with the Class III price increasing by .2%. Cheese prices were down slightly, which reduced the milk protein price by $.08/lb. A drop in the cheese price usually causes a drop in the Class III price, however the increase in the price of other solids offset the loss to make the Class III price slightly positive.
 |
| Chart I – Dashboard of Dairy Price Changes |
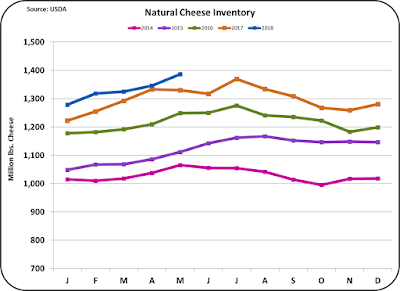
Why did cheese prices drop? Cheese inventories (Chart II below) were again up substantially. Before any meaningful increase in the Class III price can be attained, cheese inventories must come down. A lower inventory will force an increase in the price of cheese and an increase in the Class III price.How high was the cheese inventory increase? It was roughly twice the 2% growth rate of domestic cheese consumption compared to the prior year. Compared to two years ago the growth in inventories is roughly five times the growth in domestic cheese consumption. The growth in cheese exports can only absorb a small part of this increase.
 |
| Chart II – Cheese Inventory |
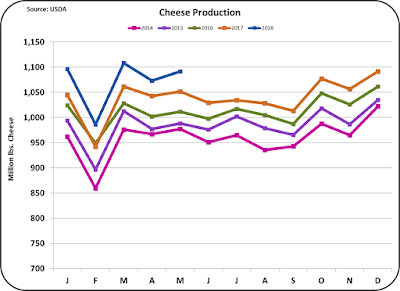
What is behind the growth in inventories? Over production of cheese caused by over production of milk is clearly the culprit. While there are lots of news headlines about new tariffs on cheese exports, the problem is really right in the U.S. With the drop in fluid milk consumption the increases in U.S. milk production cannot be sustained. Parking the excess milk in cheese inventories buys time, but it is not a solution.
 |
| Chart III – Cheese Production |
In the
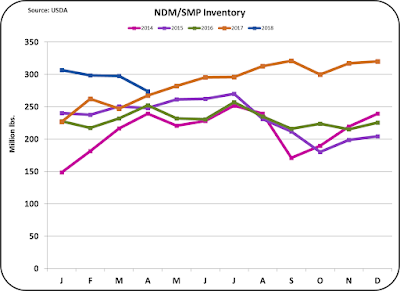
to this blog, the huge increase in Nonfat Dry Milk (NDM) exports was covered. It was impactful in reducing the inventories of NDM (Chart IV below).
 |
| Chart IV – NDM/SMP Inventory |
While the price of NDM is primarily dictated by international prices, there was a slight upward tick in the price of NDM, which in-turn gave a slight upward tick to the Class IV skim price. While any increase is helpful, the price of NDM is still in low range of under $1/lb. where it has been for the last three years. The excess global supply of NDM and Skimmed Milk Powder is keeping these prices low.
 |
| Chart V – NDM Wholesale Prices |
The big increase in the value of other solids is linked to the increase in dry whey prices. Because the drying price of dry whey comes close to the total value of dry whey, relatively small changes in the price of dry whey can have a big change on the price of other solids. The cost to dry whey is $.1991/lb. and the value of dry whey has ranged in 2018 from $.25/lb. to the current price of $.31/lb. That is why a 13.8% increase in the price of dry whey can calculate to a 52% increase in the value of other solids.
Other Solids Price = (Dry Whey Price − 0.1991) x 1.03
What caused the huge increase in dry whey prices? Chart VI below shows the huge drop in inventories in 2018.
 |
| Chart VI – Dry Whey Inventory |
U.S. dairy values remain stuck at moderate prices with a number of shifting parameters like domestic consumption, milk supply, and international events that impact exports and imports. Posts to this blog will continue to provide accurate and unbiased insights. As California moves closer to becoming an FMMO, more posts will provide information on what is happening in California and how it may impact the total U.S. dairy industry.


